
Grantee Research Project Results
Final Report: Health Effects and Characterization of Urban and Rural Coarse ParticulateMatter in Northeastern Colorado
EPA Grant Number: R833744Title: Health Effects and Characterization of Urban and Rural Coarse ParticulateMatter in Northeastern Colorado
Investigators: Hannigan, Michael P. , Miller, Shelly , Milford, Jana B. , Navidi, William C. , Peel, Jennifer
Institution: University of Colorado at Boulder , Colorado School of Mines , Colorado State University
EPA Project Officer: Chung, Serena
Project Period: January 1, 2008 through December 31, 2012 (Extended to June 30, 2013)
Project Amount: $1,200,000
RFA: Sources, Composition, and Health Effects of Coarse Particulate Matter (2006) RFA Text | Recipients Lists
Research Category: Particulate Matter , Air Quality and Air Toxics , Air
Objective:
We investigated associations between coarse particulate matter (PM10-2.5) mass concentrations and several health outcomes in a pair of urban and rural communities: Denver and Greeley, CO, and characterized the particle composition and origin in both communities. The study has been dubbed C-CRUSH (Colorado Coarse Rural and Urban Sources and Health) study.
Summary/Accomplishments (Outputs/Outcomes):
Below we provide a summary of the health impacts of PM10-2.5 that were observed in the C-CRUSH study. To better understand these epidemiological results, we first provide more information about the variability (both spatial and temporal), composition, and origins of the PM10-2.5. Since differences between the urban and rural/agricultural setting are a critical need for decision makers, we highlight those differences below as well as differences between PM10-2.5 and PM2.5. Additionally, while collecting the data needed to meet the two objectives, we ran into a few measurement challenges that we highlight below as they will likely inform future PM10-2.5 epidemiology and characterization studies.
Study Design: Prior to the C-CRUSH epidemiological study, there was broad concern about the potential for poor exposure assignment if single site urban ambient tools were used for mass concentration measurements as the thinking was that PM10-2.5 would be fairly spatial variable given that it had a relatively short atmospheric lifetime. This thinking was all framed by previous PM2.5 epidemiological studies and a comparison of atmospheric lifetimes between the PM size modes. Additionally, there was some thought that sub-daily time resolution would be needed for any measurement campaign, again as a result of shorter atmospheric residence time. As such, we designed the measurement component of our epidemiological study to address these concerns. We decided to employ dichotomous TEOMs at four sites in Denver and two in Greeley. These dichotomous TEOMs are capable of hourly measurement of both PM10-2.5 and PM2.5. This design enabled comparison PM10-2.5 and PM2.5 mass concentration trends and as well as removal of potential confounding of PM2.5 on the epidemiological study results. We maintained only two of the Denver sites (Alsup and Edison) while the Colorado Department of Public Health and the Environment, CDPHE, maintained the other two PM sites in Denver. Each of the six PM sites was located on school roofs and meets the EPA PM siting guidelines. We operated and maintained each of our sites for 3 years, and the CDPHE did the same for its two sites. Our team also collected hospitalization, emergency room visits, and birth outcome data from Denver and Greeley for those three years.
To meet our characterization objective, we also deployed filter samplers at each of our four sites (MCA, MAP, ALS, EDI). These filter samplers were designed to have a sampling inlet analogous to the one used in the dichotomous TEOM so as to reduce sampling bias. Each filter sampler was able to collect a quartz fiber filter and a Teflon filter for each size range (PM10-2.5 and PM2.5). As such, each sampler generated four filters per sampling event. The Teflon filters were designated for analysis for mass, ions, trace elements, and ROS assay. The quartz fiber filters were designated for carbon analysis that include total elemental carbon (EC) and organic carbon (OC), water soluble carbon analysis, endotoxin, and microbiological species survey.
What have we learned?
Measurements of PM10-2.5.
We had to merge our continuous mass measurements with the CDPHE’s measurements. The CDPHE does not operate a dichotomous TEOM but instead operates a PM10 TEOM and a PM2.5 TEOM; by subtraction of these two measurements, PM10-2.5 can be assessed. The challenge when comparing the two different data streams is that the dichotomous TEOM uses a FDMS to correct both the PM10-2.5 and PM2.5 channels for volatile PM while the CDPHE’s PM2.5 TEOM employs an FDMS but the PM10 TEOM does not. As such, a measurement bias exists when using the subtraction approach. Moving forward, several epidemiological researchers will likely want to merge data that follow each of these measurement paths, so we decided to assess and suggest remedies for this bias, see the “Errors …” paper for full details.
Variability and Origins.
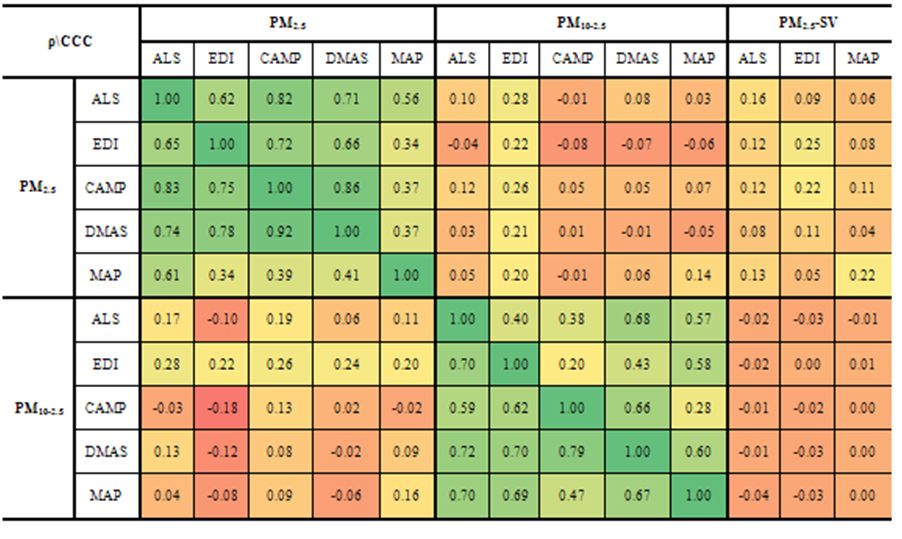
As mentioned above, the assessment of the spatial variability of PM10-2.5 is critical to the design of any future monitoring requirements as well as necessary to understand human exposure. The Table below summarizes the spatial variability observed between each site for each size range as well as for the semivolatile-PM2.5. The correlation coefficient (ρ) is presented below the diagonal and the concordance correlation coefficient (CCC) is presented above the diagonal. The CCC is a combination of the correlation and bias. If two locations show similar time series as well as similar absolute values, then the CCC will be only slightly less than the ρ, while if there exists a strong difference in the absolute values but the time series are similar, then the CCC will be much less than the ρ. What jumps out is that there is similar to only slight less spatial correlation for PM10-2.5 when compared to PM2.5. However, there exist larger CCC differences for the two size modes. PM2.5 shows a more uniform value spatially then PM10-2.5, likely due to the larger influence of nearby sources on PM10-2.5 concentrations. These results indicate that the number of monitoring sites needed for PM10-2.5 characterization is probably similar to the number needed for PM2.5, but site selection needs to be informed by proximity to sources. Additionally, we observe very little to no correlation between the two size modes. This means that not only are the sources of the PM2.5 and PM10-2.5 different but the atmospheric conditions conducive to enhancing those concentrations are also likely different. This has implication for future regulatory monitoring where the focus is PM10, the sum of the two modes; PM10 peaks may not be PM10-2.5 peaks.
Temporal variability is also an important factor for the design of regulatory monitoring and policy. Three Denver sites are near Interstates (ALS, CAMP, and DMAS), while the other Denver site (EDI) is very residential similar to both of the Greeley sites (MAP, MCA). For each of the residential sites, the median PM10-2.5 is similar to the median PM2.5, while the three sites in closer proximity to busy roadways show much higher median PM10-2.5. If the occurrence of high concentrations is a focus, then the comparison of 95th percentile concentrations is important. At the residential sites, the 95th percentile for the PM10-2.5 tends to be higher than for the PM2.5, with the exception of EDI for which they are similar. For the three sites in closer proximity to busy roadways, the 95th percentile concentrations are much higher (double at two sites) for PM10-2.5. In general, PM10-2.5 shows greater temporal variability than PM2.5; this has regulatory implications.
Temporal patterns can also give clues to the origin of PM. We explored diurnal, day-of-week, and seasonal patterns for each size mode and each site. With the long time-series we were able to short by season and day-of-week and then explore diurnal patterns. A highlight is shown in the figure below. Notice that the PM2.5 does not exhibit a strong diurnal pattern; there is a small increase in the morning rush hour on weekdays at the two near road sites. However, the PM10-2.5 does exhibit a strong diurnal pattern, especially on weekdays. This pattern is similar to the general traffic diurnal profile which may be an important source. Other PM10-2.5 sources may have similar diurnal profiles and since the atmospheric residence time of PM10-2.5 is on the order of a few hours, the night time drop is likely due to decreased anthropogenic activities at night. Seasonal aspects of the changes in diurnal patterns are likely tied to changes in the meteorology that are linked to emissions processes, more on this later.
Composition and Origins.
We collected both PM10-2.5 and PM2.5 samples every 6th day for an entire year at multiple sites in Denver and Greeley. Those filter samples have been chemically analyzed for mass, elemental carbon, total organic carbon, carbon volatility fractions, water soluble carbon, fluorescence, UV absorption as well as quantification of elements. The samples were analyzed biologically for assessment of bacterial, fungal and pollen species as well as for endotoxin levels. The samples we analyzed toxicologically using a macrophage ROS assay. We were able to explore temporal, spatial, and PM size mode differences for each analyte. Here we highlight differences that either inform our understanding of the epidemiological results or inform future PM10-2.5 characterization efforts.
PM10-2.5 vs PM2.5. Both size fractions have substantial carbonaceous content. The mean total carbon concentration in the PM10-2.5 ranges from 1.1 to 2.1 µg/m3 while the mean in the PM2.5 ranges from 1.8 to 2.6 µg/m3. However, the components of this carbon are inherently different. EC accounts for ~15-25% of the total carbon while there is no significant EC in the PM10-2.5. In the PM2.5, the OC peaks in the lower volatility fractions, while the OC is spread more even across volatility fractions in the PM10-2.5. We also looked at the TEOM volatility measurement. There was negligible volatility in the PM10-2.5 mode, while PM2.5 was composed of ~27 % volatile mass on average. This volatility is due to both ammonia nitrate and organic components which are known to contribute significantly to PM2.5. These components did not significantly contribute to the PM10-2.5. We also explored the water soluble OC and then applied UV and fluorescence spectroscopy to the samples. We find that the PM2.5 has a larger proportion that is water soluble than the PM10-2.5. In addition, spectroscopy results indicate that the PM10-2.5 is more similar to terrestrial organic matter than the PM2.5. The carbon is in part a result of biological components. We observe relatively less bacteria in the PM10-2.5 as compared to the PM2.5; this results in relatively more fungi and pollen PM10-2.5 than in the PM2.5.
Similar to carbonaceous material, both size modes have a similar fraction of elements as demonstrated by their similar proportion of elemental reconstructed mass: 16 to 24 % in the PM2.5 and 18 to 24 % in the PM10-2.5. Just like the carbon analysis, this similarity is deceptive as the components are different. This difference is best observed through source apportionment results; 5 factors/sources were identified using a PMF model. Note that the factor best identified as coal combustion, as it has a strong S signal from sulfate PM, dominates the PM2.5, with vehicle wear showing up as an important additional source of elements to that size mode. The PM10-2.5 is dominated by the crustal factor followed by road salt. We can further explore the crustal nature of the PM10-2.5 by determining crustal enrichment factors (CEFs) for each element. We observe similar CEFs to those observed for PM10-2.5 in recent Los Angeles studies. The good news is that the CEF for two potentially toxic trace metals (Pb and Cd) have been greatly reduced since those observed in the Denver area two decades ago.
Urban vs Rural. The elemental composition is similar between the Denver and Greeley samples if the focus is on PM10-2.5; for PM2.5, there are some differences as vehicle wear shows up to a smaller extent in Greeley. The carbon composition does vary between the two, although the relative amount of carbon and carbon volatility is consistent between the two sites. The carbon composition differences are best highlighted by looking at the biological differences. In Greeley, cow fecal bacteria show up as important while those species are not a large portion of the bacterial communities in Denver. Also, the endotoxin levels in Greeley are larger than those in Denver.
Health Effects.
Relatively few studies have specifically evaluated the health impacts of PM10-2.5. Coarse particles are capable of penetrating the thoracic region of the lungs when inhaled and are more likely to contain crustal elements such as aluminum, iron, and calcium, but may also contain ions, transition metals, organic, and biological material compared to fine particulate matter. We investigated the association of PM10-2.5 concentrations and several health outcomes: respiratory and cardiovascular hospital admissions, respiratory and cardiovascular emergency department (ED) visits, premature birth (gestational age between 29 and 36 weeks), term low birth weight (a birth 2500 grams or less among infants born at 37 or greater), and mean birth weight among term births. The study area included the counties of Adams, Arapahoe, Denver, Douglas, Jefferson, and Weld for the time period 2009 – 2011.
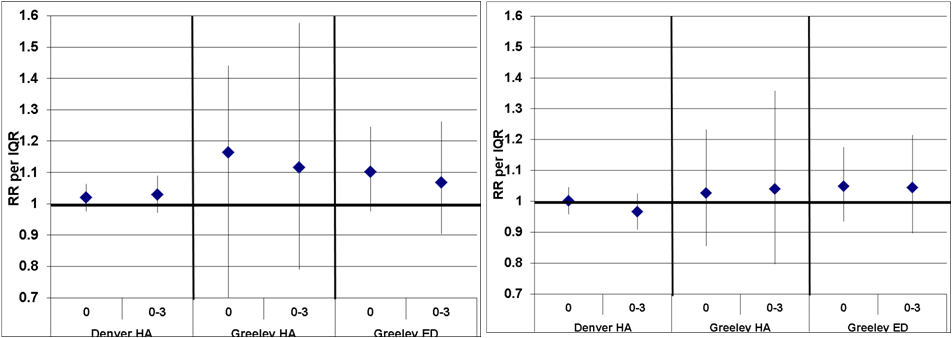
For the hospital admission and emergency department analysis, we conducted a time-series study examining the association of PM10-2.5 mass with emergency department visits and hospital admissions for cardiovascular (ICD-9 codes: 410-414, 427, 428, 433-437, 440, 444, 451) and respiratory disease (ICD-9 codes: 460-466, 480-486, 490-493, 496), along with specific subgroups within these larger groups, in Denver and Greeley, Colorado. We included hospital admissions and ED visits from residents living within a 20-mile radius around the two city centers. For Denver, an average of the scaled daily PM10-2.5 concentrations from all sites was used, while in Greeley the daily PM10-2.5 concentrations from the Maplewood Elementary School site were used. We evaluated the association using generalized additive models adjusting for long term time trends (cubic splines with 12 df per year), day of week, holidays, temperature (cubic splines with 3 df), and humidity (cubic splines with 3 df). We evaluated distributed lags and single day lags for pollution. Effect estimates were generally consistent with a null association with wide confidence intervals. We observed suggestive results for both asthma hospital admissions and ED visits, and estimates were somewhat stronger for Greeley than for Denver. Coarse PM concentrations were inversely associated with cardiovascular hospital admissions and ED visits in Greeley, see figures below. The left side shows the results of asthma and the right side shows the results for COPD.
For the birth outcomes, we investigated 109,935 singleton births. Births were assigned the PM10-2.5 concentration from the nearest monitoring station, using the centroids of the zip code area of residence. Premature birth and low birth weight were evaluated using logistic regression, and birth weight was evaluated using linear regression, adjusting for confounders. Increased average coarse PM concentrations during the last 12 weeks before the birth were associated with an increased odds of premature birth. However, we observed inverse associations between average coarse PM concentrations in the first and second trimesters and premature birth and between average coarse PM concentrations during third trimester and low birth weight. Results for mean birth weight were largely consistent with a null association. Results may have been affected by large amounts of missing PM10-2.5 data, particularly in the cold season.
Journal Articles on this Report : 4 Displayed | Download in RIS Format
| Other project views: | All 16 publications | 5 publications in selected types | All 5 journal articles |
|---|
| Type | Citation | ||
|---|---|---|---|
|
|
Bowers RM, Clements N, Emerson JB, Wiedinmyer C, Hannigan MP, Fierer N. Seasonal variability in the bacterial and fungal diversity of the near-surface atmosphere. Environmental Science & Technology 2013;47(21):12097-12106. |
R833744 (Final) R834552 (Final) |
Exit Exit Exit |
|
|
Clements N, Piedrahita R, Ortega J, Peel JL, Hannigan M, Miller, SL, Milford JB. Characterization and nonparametric regression of rural and urban coarse particulate matter mass concentrations in Northeastern Colorado. Aerosol Science and Technology 2012;46(1):108-123. |
R833744 (2012) R833744 (Final) |
Exit Exit Exit |
|
|
Clements N, Eav J, Xie M, Hannigan MP, Miller SL, Navidi W, Peel JL, Schauer JJ, Shafer MM, Milford JB. Concentrations and source insights for trace elements in fine and coarse particulate matter. Atmospheric Environment 2014;89:373-381. |
R833744 (Final) |
Exit Exit Exit |
|
|
Clements N, Milford JB, Miller SL, Navidi W, Peel JL, Hannigan MP. Errors in coarse particulate matter mass concentrations and spatiotemporal characteristics when using subtraction estimation methods. Journal of the Air & Waste Management Association 2013;63(12):1386-1398. |
R833744 (Final) |
Exit Exit |
Supplemental Keywords:
RFA, Air, Scientific Discipline, Geographic Area, Health Risk Assessment, State, particulate matter, Biology, bioavailability, coarse pm, atmospheric particles, cardiopulmonary responses, cardiovascular vulnerability, PM10, cardiotoxicity, atmospheric particulate matter, chemical speciation sampling, human health effects, Colorado (CO)Progress and Final Reports:
Original AbstractThe perspectives, information and conclusions conveyed in research project abstracts, progress reports, final reports, journal abstracts and journal publications convey the viewpoints of the principal investigator and may not represent the views and policies of ORD and EPA. Conclusions drawn by the principal investigators have not been reviewed by the Agency.