
Grantee Research Project Results
Final Report: Hydrologic Forecasting for Characterization of Non-linear Response of Freshwater Wetlands to Climatic and Land Use Change in the Susquehanna River Basin
EPA Grant Number: R833013Title: Hydrologic Forecasting for Characterization of Non-linear Response of Freshwater Wetlands to Climatic and Land Use Change in the Susquehanna River Basin
Investigators: Wardrop, Denice Heller , Easterling, William Ewart , Brooks, Robert P. , Shortle, James S. , Dressler, Kevin , Duffy, Christopher , Najjar, Raymond , Ready, Richard C
Institution: Pennsylvania State University
EPA Project Officer: Packard, Benjamin H
Project Period: April 20, 2007 through April 19, 2011
Project Amount: $899,656
RFA: Nonlinear Responses to Global Change in Linked Aquatic and Terrestrial Ecosystems and Effects of Multiple Factors on Terrestrial Ecosystems: A Joint Research Solicitation- EPA, DOE (2005) RFA Text | Recipients Lists
Research Category: Aquatic Ecosystems , Climate Change
Objective:
In addressing the need to collectively understand how and when nonlinear ecological changes, in response to climate change and variability, affect ecological systems and their associated services, this project identified the freshwater wetlands of the Susquehanna River Basin (SRB) as an extremely important aquatic resource, whose ability to provide recognized ecosystem services are dependent upon the hydrology of surface water and groundwater systems. The Susquehanna River Basin (SRB) encompasses an area of over 27,000 square miles, extending from southern New York through Pennsylvania to northern Maryland (Figure 1). Although the basin is largely rural in character, it has experienced problems with water quality and quantity (SRBC, 2005). In addition, the Susquehanna is the largest tributary of the Chesapeake Bay, supplying about half of its fresh water inputs (SRBC, 1998). This large contribution means that the water quantity and quality of the Susquehanna can directly affect the health of Chesapeake Bay, an important economic and ecological resource. The SRB is also one of the most flood-prone areas in the United States (SRBC, 1998).
Characterizing the response of freshwater wetlands to climatic and land use change requires a series of steps because the impact of precipitation changes is mediated through hydrologic processes operating across a range of scales. Our approach thus involved the following series of activities:
- Develop scenarios of climate and land cover change, operating on a scale of decades, relevant to the Susquehanna River Basin (SRB).
- Using these scenarios, in conjunction with a coupled surface-groundwater model, develop a number of predictive hydrologic scenarios for a collection of 11-digit HUC watersheds representing a range of human-associated land uses in the SRB.
- Characterize the relationships between hydrologic and landcover parameters and ecosystem characteristics and services in wetlands of various types in the SRB, focusing on those with preliminary evidence of non-linearity and/or thresholds.
- Utilize the predicted hydrologic scenarios to forecast changes in ecosystem services across the entire Susquehanna River Basin, clearly identifying where and when non-linearities and/or thresholds in response occur, utilizing a series of unique statistical tools to develop a probability surface.
Summary/Accomplishments (Outputs/Outcomes):
Selection of Climate Model and Management of Output
The goal of this portion of the project was to make estimates of the likely changes in the climate of the Susquehanna River Basin (SRB) by the middle of the 21st century, with the additional consideration of utilizing the climate forcings as input to an ecologically relevant hydrologic model. We elected to base our climate projections on the output of one or more General Circulation Models (GCMs) under conditions of greenhouse gas forcing. We chose one such model to use from a large array of possible candidates, based on our analysis of model performance for ecologically relevant metrics across the study region.
To get a sense of model reliability for this region, we evaluated how the climate models have performed in the past for this region. Performance indices were computed based on selected ecologically relevant metrics. Based on our model comparsion process, we chose to use daily output from the MRI-CGMC model to provide as forcing to the hydrological model. Daily data were provided to the hydrologic modeling group for two 20-year time periods: (1) 1979-1998 = “historical climate,” and (2) 2046-2065 = “future climate.” The projections generally show that “future climate” winters and springs are wetter, and precipitation events are more intense.
The evaluation of climate models for the purposes of providing input to a hydrologic model that, in turn, is intended to provide ecologically relevant hydrologic scenarios presents a unique challenge. Our use of various performance measures for this purpose provided the following lessons learned:
- Global climate models are skillful enough to provide meaningful information about future changes in hydrologically relevant climate variables brought about by increases in greenhouse gases. That message comes across clearly from the model evaluation, which was based on a wide variety of metrics (temperature, precipitation, wind speed, humidity, and solar radiation).
- The models show consensus (and therefore some level of certainty) in future projections of certain metrics: temperature in all seasons, precipitation in winter and spring, and the intensity of precipitation. All of these metrics are projected to increase.
Construction of Land Cover Change Scenarios
In order to accurately project future hydrologic scenarios under climate change, we needed to project land cover scenarios for each watershed. A two-stage land cover change model to predict aggregate changes in land cover within a geography (county, minor civil division, census tract) was developed; the first stage predicted the quantity of land cover change, while the second predicted the probable location of that change. The resulting product is a map for each study basin of land use in 2050. Modelling of individual basins resulted in an appropriately wide range of predicted open space loss, but was relatively small overall. Open space loss (2001-2050) ranged from less than 1% (Young Woman’s Creek) to 17% (Little Conestoga).
In summary, we feel that our multi-level modeling approach provides a plausible projection of the quantity of land use change in each basin and its general spatial distribution. It places land use change into the right part of the watershed at a gross scale. New development tends to be near already developed land, not on steep slopes. Very little development is projected on protected land. It also matches the gross-scale patchiness of observed land use change. Because the spatial resolution of projected change is limited to our 1 km x 1 km grid, our approach cannot capture very small-scale spatial patterns. In some cases, it yields some improbable fine-scale results, such as predicted development on top of a ridge.
PIHM Modeling and Hydrologic Metric Output
This project utilized a fully coupled and distributed modeling system which simulates surface water (overland, channel, lake), soil moisture, and groundwater dynamics. The model is referred to as the PIHM (Penn State Integrated Hydrologic Model) (Duffy 2004, Qu and Duffy 2005). The hydrological processes included in the model are: tree canopy and low-vegetation interception, evapotranspiration, overland flow, lake or reservoir storage, infiltration, vertical unsaturated flow, lateral groundwater flow, surface flow and channel routing. PIHM uses a Triangular-Irregular Network (TIN) representation of the watershed discretization, and formulates the governing equations using the semi-discrete finite volume method (Qu and Duffy, 2005). Because hydrologic modeling of the entire SRB was beyond the scope of this project, seven mesoscale watersheds (Shaver’s Creek, Little Juniata River, Mahantango Creek, Young Womans Creek, Kettle Creek, Muddy Creek and Lackawanna River) were selected for representation of different types of watersheds across the SRB.
As a first measure of the utility of PIHM in the assessment of wetland-related ecosystem services, we compared PIHM-generated predictions of wetland area and location with those available from the National Wetlands Inventory (NWI). If the PIHM predictions were reasonably consistent with the NWI representation of the size of the wetland resource, then PIHM results could provide an estimate of the expansion or contraction of wetland area as a result of climate change projections in each of the representative basins. While this would not be a direct measurement of a specific ecosystem service (e.g., flood storage, wetland habitat), it would be a general indicator of how the commonly-accepted bundle of wetland ecosystem services might fare under one scenario of climate change. Because the model was reasonably predictive of wetland area in three of the five watersheds, we then utilized the climate change forcings to predict expansion and/or contraction of wetland area across the five study watersheds. The model predicted minor amounts of overall expansion or contraction, depending on the watershed.
Once we had demonstrated the capability of providing a baseline estimate of ecosystem service change (i.e., expansion or contraction of wetland area), we then proceeded to the calculation of ecologically relevant streamflow characteristics for two watersheds, each in one of the two major physiographic regions of Pennsylvania (Young Woman’s Creek and Little Juniata). Because of the high level of uncertainty associated with forecasting hydrologic variables with climate change in general and in the Mid-Atlantic in particular, it is important to focus on changes that could be ecologically relevant. We examined the ecologically relevant hydrologic metrics associated with stream flows (mean, maximum, and minimum flows, and flow variability), and groundwater levels (average depth to water, time in the growing zone).
Various measures of flow magnitude provide a general measure of aquatic habitat availability and suitability, with monthly means describing daily monthly conditions, and similarity between monthly means describing hydrologic constancy throughout the year. Inter-annual variation for any given month describes contingency, or the extent to which flows vary within any given month. Extremes in daily to seasonal water conditions provide measures of environmental stress. For both watersheds, there were increases in the magnitude of mean flows under the future scenario, with accompanying increases in the magnitude of maximum flows but a decrease in the magnitude of minimum flows. Forecasted seasonal differences in flow are not evenly distributed: the largest increases occur during the typically wet winters and springs while the summers show slight decreases in mean flows. Overall, an increase in the mean magnitude flows would indicate an increase in flooding events, with a concomitant increase in the duration of inundation in habitats in the floodplain. Additionally, it would indicate an increase in stream power, or the amount of work a stream can do in terms of moving materials. Another ecologically relevant metric of stream flow is flashiness. Flashiness has no set definition but is generally associated with dramatic fluctuations in flow, such as high flows immediately following wet weather and a rapid return to pre-rain conditions shortly after the end of the precipitation. This rapidity in response is often the result of faster surface runoff, with a sudden and intense peak flow in the receiving stream, which represents a loss of water storage in soils and vegetation (i.e., water that precipitates will make its way quickly from the land into the stream and be flushed through the system). Two estimates of flashiness are presented here: the baseflow index (proportion of baseflow to the total flow) and the Richards-Baker flashiness index (increases with increasing flashiness). The baseflow index is given here because a stream with a lower baseflow index will be more prone to flashiness due to a relatively higher amount of surface water contributing to the overall flow. For both watersheds, the proportion of baseflow goes down in the future scenario. This could have potentially significant consequences for the thermal sensitivity, defined as the sensitivity of stream temperature of a given site to change in air temperature. Conversely, the flashiness increases with the future scenario. Average groundwater levels increase in both watersheds for the future scenario. An increase in groundwater would influence different types of wetlands differently. However, though the overall mean groundwater levels increase in the future scenarios, seasonally there are increases in the winter and spring but decreases during the dry summer months. Similar to overall groundwater levels, the future scenarios show a marked increase in the percent of time groundwater is in the growing zone (upper 30 cm). Seasonally, again, the increases in time in the growing zone occur in the winter and spring, while there is a decrease in the summer months.
Hydrologic Scenario/Ecological Response Model
In order to develop the hydrologic scenario/ecological response translator, a series of investigative steps was necessary, and are reported out as follows:
- Design of a reach classification system
- Instrumentation of a series of 10 “super sites” with up to seven automatic recording wells, in order to get fine scale hydrologic data and instensive biological sampling data at the same sites for development of the translator
- Development of a rapid assessment protocol for aquatic habitat to characterize a number of watersheds across the SRB,
Climate change will affect wetlands in multiple ways. Some of the most crucial alterations are likely to be in ecosystem structure and function, especially with regard to ecological complexity and diversity. The most prevalent and diverse hydrogeomorphic wetland types in the SRB are found along stream reaches and can be generally classified as riverine complexes (Lowe and Liken 2005, Wardrop et al. 2007). These complexes represent mosaics of surface and groundwater habitats of varying spatial and temporal hydrologic connectivity, the combination of which creates ‘hotspots’ of ecological diversity. This structural complexity and diversity is a major factor in maintaining ecosystem resilience. The objective of this portion of the project was to evaluate ecological diversity within a riverine system and predict ways in which climate change may alter this diversity. The goal was not simply to identify cause-and-effect relationships between climate change and riverine wetlands, but rather to broaden our understanding of riverine complexity in order to mitigate those responses through optimal maintenance of the system’s resilience. We defined riverine ecological diversity as a combination of structural (habitat) diversity, biological (species) diversity, and functional (hydrologic process) diversity. Climate change may directly affect each of these components differently; however, the greatest impacts may be indirect through the effects of changing temperature and precipitation patterns on the hydrologic regime. This in turn will affect the habitat structure and the resident biological assemblages. With that in mind, we must be able to establish links between hydrology, habitat, and biology. This required the following steps: (1) characterize the biological and habitat structure of minimally disturbed riverine systems and relate these patterns to probable hydrologic processes that create and maintain that structure; (2) compare these results with biological and habitat structure, and characteristic hydrology of impacted riverine systems to predict ecological responses to changes in hydrology; and (3) apply these relationships to climate change scenarios.
Figure 1 illustrates the major changes (and probable cause) in active zone, floodplain, and wetland habitats of both mixed and floodplain functional process zones as land use shifts from primarily forested to agricultural and residential. In addition, the taxonomic shifts in the macroinvertebrate assemblages within these habitats are also included.
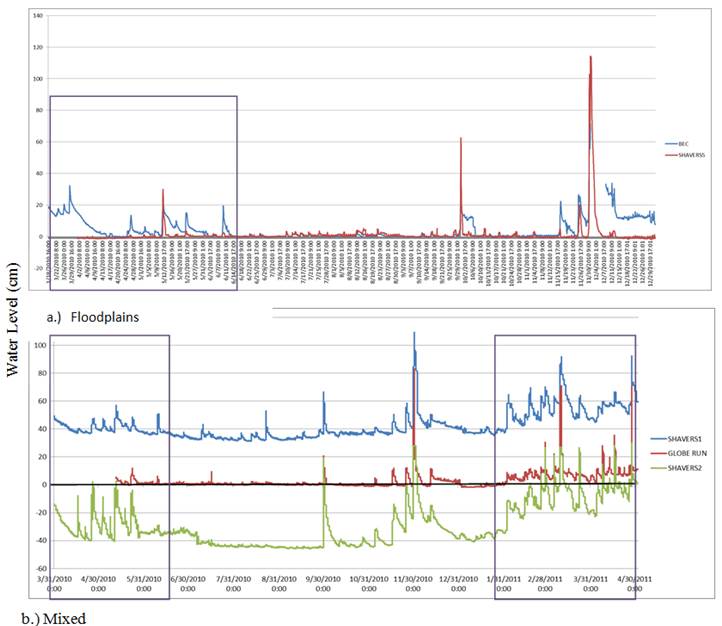
Figure 2 shows the results from the monitoring wells placed in active zone flow pulse habitats of the forested floodplain sites (Bald Eagle Creek and Shavers5) (20a) and mixed sites (Shavers1, Globe Run, and Shavers2) (20b). The Shavers5 well was located in the only flow pulse habitat available nearby, which was farther upstream inside a meander. The Shavers2 site did not contain flow pulse habitats; however, we were able to use data from a groundwater monitoring well located in an area of the floodplain that would have been at least seasonally inundated active zone habitat if the channel were not slightly incised and affected by sedimentation. The well at the Shavers1 forested mixed site was located in an area of the active zone with a permanent hydroperiod, which is not always present in flow pulse habitats. Surface water levels were recorded from spring 2010 through winter 2010 for floodplain sites and spring 2010 through spring 2011 at mixed sites. Results indicated that aquatic flow pulse habitats at Shavers5 and Shavers 2 were largely missing during the spring of 2010. Because most of the taxa associated with these habitats have 1-year life cycles, predictability of spring inundation from year-to-year is a necessity. This helps support the conclusion that flow pulse habitats in the active zone are largely absent in entrenched agricultural streams.
Figure 1. Summary illustration of the major changes in habitat and macroinvertebrate structure from both floodplain and mixed functional process zones as land use changes from forest to agriculture and residential. Arrows depict the likely source of change in each habitat type. End result: riffle habitats support more tolerant stream taxa; AZ flow pulse habitats are replaced by baseflow habitats and associated taxa; floodplains and wetland habitats become more isolated and either dry or become stagnant supporting taxa adapted to extreme drought and anoxic conditions.
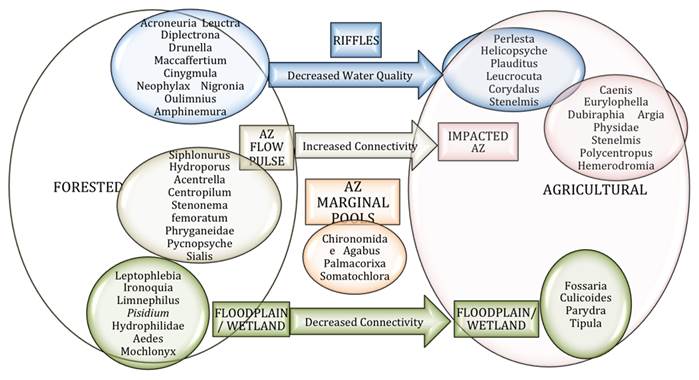
Figure 2. Results from monitoring well data showing loss of inundation of flow pulse habitats in agricultural active zones for both floodplain (a) and mixed (b) functional process zones. The well at BEC washed out 11/29/10 and was replaced 12/07/10. The black line in the mixed graph corresponds to ground level (Shavers2 well is a groundwater well). Important seasonal inundation periods for macroinvertebrate development are outlined in the purple box.
We hypothesized that the habitat changes observed across different land use settings in the intensive assessment would be similar when extrapolated to other areas throughout the river basin. Testing this, however, required the development of a rapid procedure for evaluating these habitat changes throughout the reach. Thus, our objective for the riverine rapid assessment was to extrapolate the results obtained from the intensive assessment to other floodplain, mixed, and wetland reaches throughout the SRB. Overall, we were trying to answer the following question: What happens to the extent, complexity and condition of riverine aquatic habitats (as defined by their aquatic ecological set) as forested landscapes are converted to agricultural/urban areas? We categorized hydrology and habitat into three major areas: (1) the active channel zone located between or adjacent to the main stream banks and connected (inundated) below bankfull; (2) the floodplain area that is created and maintained primarily by flood pulses (inundated above bankfull); and (3) groundwater-supported wetlands within the riparian zone that may or may not be located within the adjacent floodplain or active zone. To estimate complexity within each of these aquatic ecological sets, we also characterized habitats at the functional set and habitat unit scales. In addition, large woody debris (LWD) was evaluated as a measure of structural complexity throughout the reach. Collectively, the results suggest that ecological diversity is expressed through spatial and temporal heterogeneity, which is maximized at intermediate connectivity levels. The following series of figures (Figures 3 through 7) illustrate how increases or decreases in hydrologic connectivity can both result in loss of diversity.
Figure 3. Illustration of a forested floodplain or mixed functional process zone with intermediate levels of hydrologic connectivity. Much of the wetland habitat is characterized by saturated conditions intermixed with inundated channels and pools. Flow pulse habitats are characterized by shallow depths with cobble and gravel substrates. Floodplain channels are typically a mix of inundated scour pools and mucky, saturated areas along the margins.
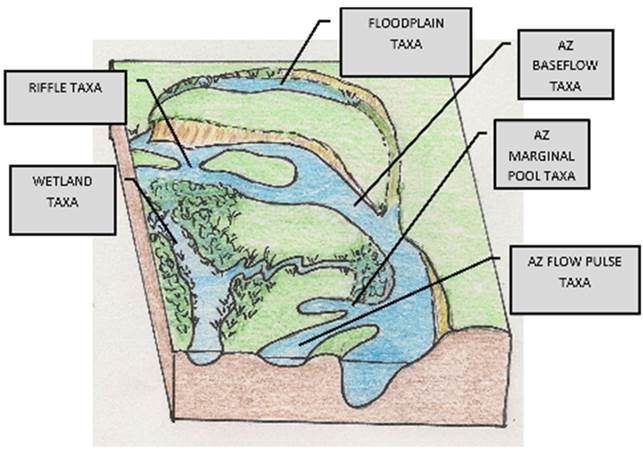
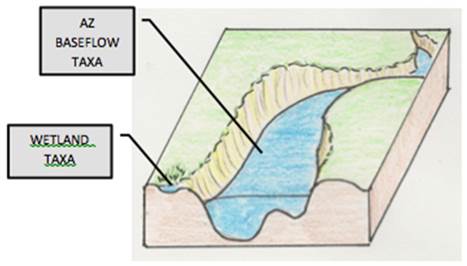
Figure 4. Illustration of a forested floodplain or mixed FPZ with low levels of hydrologic connectivity. Wetland habitats consist mostly of inundated channels or pools. Flow pulse habitats have dried up. Floodplain channels either complete hydrarch succession and become habitat for terrestrial arthropods or support tolerant taxa with physiological adaptations to extreme drought or anoxia. Marginal pools in the active zone remain relatively unchanged. Riffles may contain fewer taxa due to lower baseflows.
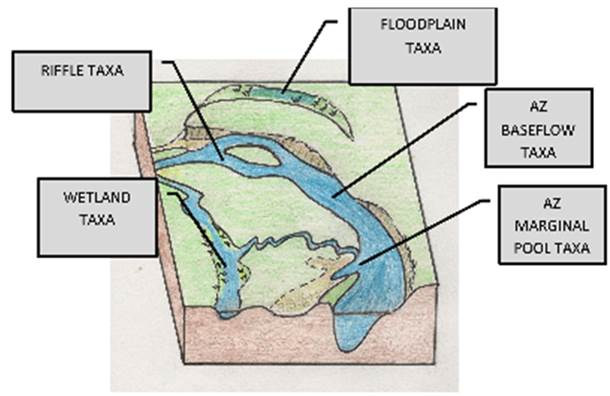
Figure 5. Illustration of a forested floodplain or mixed FPZ with high levels of hydrologic connectivity. Wetland habitats are mostly inundated. Flow pulse habitats have been replaced by baseflow habitat. Floodplain channels switch to permanent hydroperiods, floodplain taxa outcompeted by taxa adapted for biotic interactions in stable lentic conditions. Marginal pools in the active zone remain relatively unchanged. Riffles may become less frequent due to higher flows.
Climate change is likely to shift hydrologic connectivity in both directions. These contradictory shifts may occur at the same locations but at different times of the year. For example, a system experiencing increased winter precipitation and decreased summer precipitation would be subjected to increased flooding in winter (increasing connectivity) and longer droughts in summer (decreasing connectivity). The results in more resilient riverine ecosystems may mimic the scenarios outlined in Figures 4 and 5. The effect on more impacted systems, however, will most likely be to exacerbate the current stressors to the system. For example, increased flood magnitudes will increase rates of bank erosion and entrenchment. A possible scenario is depicted in Figures 6 and 7.
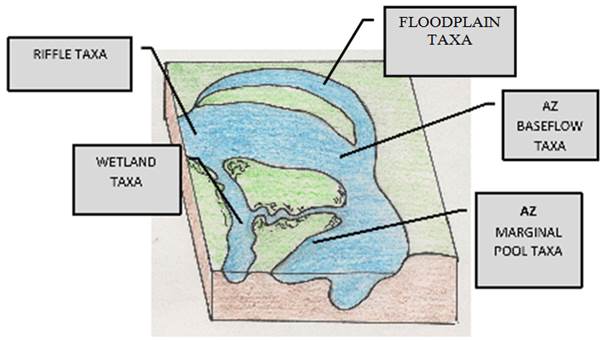
Figure 6. Illustration of a moderately impacted floodplain system in its current state supporting a mix of primarily baseflow taxa and wetland taxa. Riffle and active flow pulse habitats are limited.
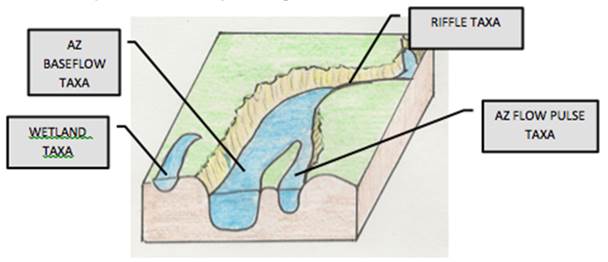
Figure 7. Illustration of a moderately impacted floodplain system under a climate change scenario. Increased scouring and entrenchment have replaced AZ flow pulse and riffle habitats with glide/pool baseflow habitats. Wetland habitat is severely reduced to supporting opportunistic tolerant taxa.
Conclusions:
Benefits
Our project resulted in the following benefits:
We applied a climate model performance measure utilizing ecologically relevant metrics to a regional climate model application, and demonstrated that the selection of a climate model for ecological application is an interative process between climate modellers, hydrologic modellers, and ecologists.
We significantly advanced the useability of the hydrologic model, PIHM, and developed a website to allow open access to both the tool and the results of our project.
We developed a a plausible projection of the quantity of land use change in each basin, and its general spatial distribution. It places land use change into the right part of the watershed at a gross scale.
We significantly forwarded knowledge of macroinvertebrate ecology as it is related to hydrologic metrics, and identified for the first time the importance of intermediate bankfull events in structuring aquatic habitat.
We documented impacts to the extent, complexity and condition of riverine aquatic habitats as forested landscapes are converted to agricultural/urban areas, and confirmed the utility of using this model as one which resembles probable impacts of climate change
We developed a unique GIS-based method of reach classification, for use in future aquatic impact studies, that integrates the wetland and stream environments and allows a broad range of tools (e.g., hydrologic models) to be used in impact assessment.
Recipients
State water managers allocate limited resources to implement federal laws. Local officials must respond to citizen concerns about threats from climate change and/or land use change and a desire to protect aquatic habitats. Our project addressed the needs of both by providing a hydrologic scenario/ecological response model that can be utilized to communicate future trajectories of freshwater wetland ecosystems given a set of conditions.
Products
Extensive tools, documentation, manuscript downloads, and data sets at:

Journal Articles on this Report : 3 Displayed | Download in RIS Format
| Other project views: | All 5 publications | 4 publications in selected types | All 4 journal articles |
|---|
| Type | Citation | ||
|---|---|---|---|
|
|
Fennessy M, Wardrop D, Moon J, Wilson S, Craft C. Soil carbon sequestration in freshwater wetlands varies across a gradient of ecological condition and by ecoregion. ECOLOGICAL ENGINEERING 2018;114:129-136. |
R833013 (Final) |
Exit Exit |
|
|
Kumar M, Bhatt G, Duffy CJ. An efficient domain decomposition framework for accurate representation of geodata in distributed hydrologic models. International Journal of Geographical Information Science 2009;23(12):1569-1596. |
R833013 (2007) R833013 (2009) R833013 (Final) |
Exit Exit Exit |
|
|
Yu X, Bhatt G, Duffy CJ, Wardrop DH, Najjar RG, Ross AC, Rydzik M. A coupled surface–subsurface modeling framework to assess the impact of climate change on freshwater wetlands. Climate Research 2015;66(3):211-228. |
R833013 (Final) |
Exit Exit Exit |
Supplemental Keywords:
Water, watersheds, groundwater, global climate, precipitation, temperature, ecological effects, vulnerability, ecosystem, scaling, aquatic, habitat, ecology, hydrology, climatology, modeling, monitoring, surveys, general circulation models, mid-Atlantic;, RFA, Ecosystem Protection/Environmental Exposure & Risk, Air, Scientific Discipline, Ecological Risk Assessment, Atmosphere, Regional/Scaling, Monitoring/Modeling, Air Pollution Effects, Atmospheric Sciences, Hydrology, climate change, Environmental Monitoring, biodiversity, Global Climate Change, ecosystem assessment, climate model, water quality, coastal ecosystem, global change, atmospheric chemistry, ecological models, coastal ecosystems, climate models, environmental measurement, climate variability, environmental stress, UV radiation, anthropogenic, aquatic species vulnerability, meteorology, land use, regional anthropogenic stresses, greenhouse gases, stressor response modelRelevant Websites:
Penn State Integrated Hydrologic Modeling System Exit
Progress and Final Reports:
Original AbstractThe perspectives, information and conclusions conveyed in research project abstracts, progress reports, final reports, journal abstracts and journal publications convey the viewpoints of the principal investigator and may not represent the views and policies of ORD and EPA. Conclusions drawn by the principal investigators have not been reviewed by the Agency.