U.S. flag

An official website of the United States government

Here’s how you know

Dot gov

Official websites use .gov
A .gov website belongs to an official government organization in the United States.

HTTPS

Secure .gov websites use HTTPS
A lock (LockA locked padlock) or https:// means you have safely connected to the .gov website. Share sensitive information only on official, secure websites.

  • Environmental Topics
  • Laws & Regulations
  • Report a Violation
  • About EPA
Contact Us

Grantee Research Project Results

Final Report: Ensemble Analyses of the Impact and Uncertainties of Global Change on Regional Air Quality in the U.S.

EPA Grant Number: R833369
Title: Ensemble Analyses of the Impact and Uncertainties of Global Change on Regional Air Quality in the U.S.
Investigators: Lamb, Brian , Mass, Clifford , Guenther, Alex , Wiedinmyer, Christine , Salathe, Eric , McKenzie, Donald , Chung, Sandra
Institution: Washington State University , National Center for Atmospheric Research , University of Washington , USDA
EPA Project Officer: Chung, Serena
Project Period: February 1, 2007 through January 31, 2011 (Extended to January 31, 2012)
Project Amount: $899,987
RFA: Consequences of Global Change For Air Quality (2006) RFA Text |  Recipients Lists
Research Category: Climate Change , Air

Objective:

This project builds on results from a previous EPA global change project (RD8383096, Chen, et al., 2009a,b; Avise, et al., 2009). Our overall goal was to answer questions, as initially posed in our previous project, related to the effects of global change on regional air quality, to include quantitative estimates of uncertainties as part of the answers to our research questions, and to present our results specifically in terms appropriate for air quality regulatory needs. The overall research questions include: How will global change affect regional air quality in the future? How are biogenic emissions affected by global climate change and land management practices and thus affect air quality? How will changes in emissions in Asia impact U.S. air quality? How will the role of fire change with respect to regional air quality in the future? How will global change affect atmospheric deposition in sensitive ecosystems?

Our objectives evolved through the course of the project to include: 1) assessment of the relative importance of the effects of local U.S. emission changes, climate change, land use change, and increasing Asian emissions upon future air quality in the continental United States; 2) development and application of a relative response factor (RRF) approach similar to that used for state implementation plan (SIP) model analyses modified to include a climate impact factor; 3) analysis of Policy Relevant Background simulations for the United States, and 4) analysis and projection of modeling uncertainties through a limited ensemble analysis approach. The latter objective involves analysis of results from various model configurations and using both ECHAM5 and CCSM3 global output for A1B and B1 scenarios. This portion of the work is not complete and will not be addressed in this report.

Summary/Accomplishments (Outputs/Outcomes):
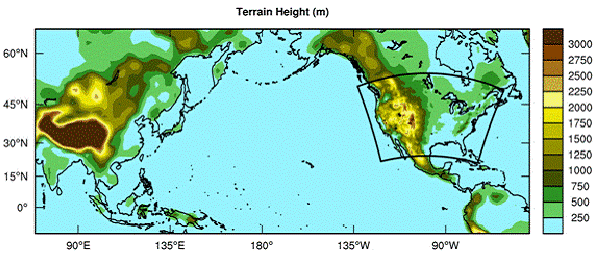
In this project, the primary approach was to use ECHAM-5 global circulation model (GCM) output to drive WRF downscaling simulations for the A1B IPCC scenarios. The CMAQ chemical transport model was applied at a partial hemispheric scale to account for the impact of Asian emissions upon chemical boundary conditions in the United States, and then CMAQ was used for a continental United States (CONUS) domain with 36 km grid cells to simulate ozone, PM2.5 and related pollutants on an hourly basis for summertime months. Simulations were completed for five representative summers during current (1995-2004) and future (2045-2054) decades. In this report, we present our results in terms of daily maximum 8 hr ozone levels and daily maximum 24 hr average PM2.5 concentrations for summer months (Jun, Jul, and Aug) in the United States.
 
Figure 1
Figure 1. Semi-hemispheric domain for WRF and CMAQ simulations to capture long range
transport of Asian emissions. The CONUS domain is outlined by the box with black lines
 
Emissions and Land Use Changes
The MEGAN biogenic emission model (Guenther, et al., 2006) was used to estimate current and future biogenic volatile organic compound (VOC) and NOx emissions using downscaled current and future meteorology and current and future land use. Global emissions for the semi-hemispheric domain were compiled from a variety of sources and anthropogenic U.S. emissions were derived from the 2002 NEI with projections to 2050 based upon MARKAL business as usual estimates. The compilation of emissions is summarized below with the resulting percent changes in U.S. anthropogenic emissions shown in Figure 2.
 
Global Anthropogenic Emissions for the Semi-Hemispheric Domain:
  • POET inventory (Olivier, et al., 2003; Granier, et al., 2005) for reactive gases
  • SO2 from EDGAR 32FT200 (Olivier and Berdowski, 2001)
  • Primary organic aerosol and black carbon from Bond, et al. (2004)
  • 2050 projection factors from David Streets
CONUS Anthropogenic Emissions
  • NEI 2002 for the current decade
  • Emission Projection Scenario (ESP) based on MARket Allocation energy system model assuming current regulatory curtailment extended through 2050 (Loughlin, et al., 2011)
MEGANv2.04 biogenic emissions model (for both semi-hemispheric and CONUS domains)
  • Future cropland data based on IMAGE 2100 global cropland extent data, the SAGE maximum cultivable land data, and the MODIS cropland data
  • Plant functional type (PFT) for broadleaf, conifer, shrubs and grasses were projected using Mapped Atmosphere-Plant-Soil System (MAPSS) model output (http://www.fs.fed.us/pnw/mdr/mapss/, Neilson, 1995) based on three GCM future scenarios.
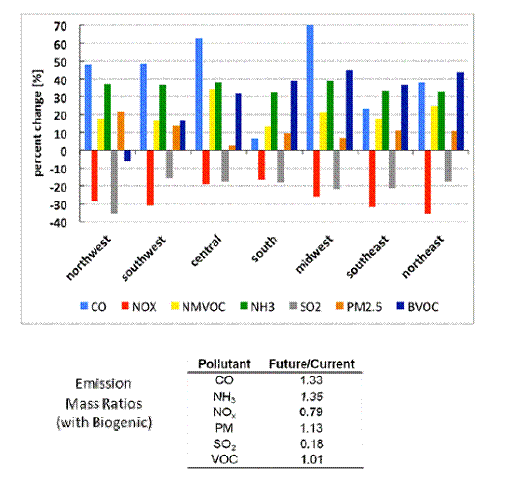
 
Figure 2
Figure 2. Summary of changes in U.S. anthropogenic emissions by region (upper panel) and the
ratio of the change in emitted species for the continental United States (lower panel).
 
 
Attribution of Global Change Effects upon Air Quality
With the downscaling modeling simulations, it is possible to examine future air quality in terms of both the cumulative effects of global change as well as the separate effects of climate, global emissions, local U.S. emissions, and land use/land cover changes. Separate model attribution simulations were completed as shown in the matrix of simulations in Table 1. By examining the results from these different simulations, it is possible to attribute the impacts of different components of global change upon projected U.S. air quality for the 2050s.
 
Projected changes in meteorology
To help understand the results from the various attribution runs, it is useful, first, to examine the projected changes in meteorology across the United States for the 2050 summers. Overall, except along the Pacific coast, summertime temperatures across the continental United States are projected to increase in a range between 0.5 and 4oC (see Figure 3, top left).
 
 
Table 1. Matrix of attribution simulations for current and future decade periods.
Case Climate Biogenic Emissions Anthropogenic Emissions
Climate Land Use US         Global
CD_Base Current Current Current Current Current
A1B_Met Future Current Current Current Current
A1B_M Future Future Current Current Current
A1B_M_LU Future Future Current

Current Current

A1B_US Current Current Current Future Current
A1B_BC Current Current Current Current Future
A1B_Base Future Future Future Future Future
 
 
Figure 3
Figure 3. Projected changes in 2 m surface temperature (left) and percent change in
precipitation (right).
 
Projected changes in precipitation across the United States vary depending on the geographical climate zone. With the exception of the Northwest and the Northcentral United States, precipitation is projected to decrease between 10 to 80%. The larger decrease is experienced in the Southwest region. These results are similar to those from other investigators.
 
Projected changes in ozone and PM2.5
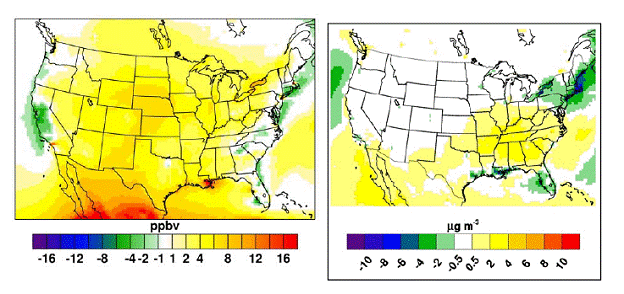
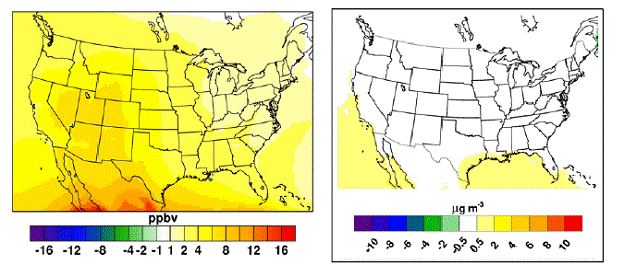
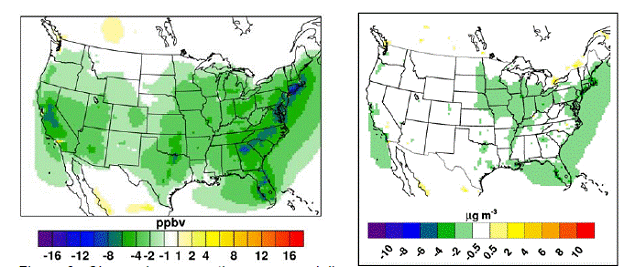
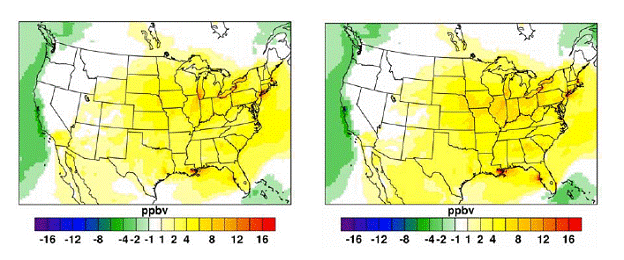
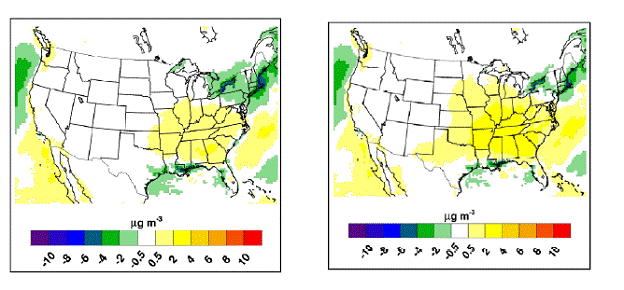
For the ECHAM5/A1B configuration, results for the summertime ozone and PM2.5 in terms of future minus current difference maps are shown in Figures 4-8. The difference maps correspond to the attribution simulations listed previously. A summary of the overall impact of these future changes upon ozone and PM2.5 is given in Table 2.
 
The table and maps show that overall for the A1B future case, the peak ozone (as represented by the 98th percentile by region) slightly increases in the West, but increases by more (up to 7 ppbv) in the central and eastern portion of the United States. These changes are the result of increases in ozone due to increasing chemical boundary conditions that are somewhat offset by decreases in ozone due to decreasing U.S. anthropogenic emissions and perturbed either up or down, depending on the region, by changes in climate, biogenic emissions, and landuse. In the Western United States, climatic effects (meteorology plus biogenic emissions) decrease, while these climatic effects are positive in other parts of the United States due to warmer temperatures and the associated effects on atmospheric reactions and biogenic emissions. Landuse effects associated with expanded croplands tend to slightly offset the increases associated with climate effects alone.
 
 
Table 2. Summary of changes (future case - current base case) in 98th percentile daily maximum 8 hr ozone (top) and 24 hr PM2.5 (without H2O) (bottom). The changes due to future conditions are shown in parenthesis. CD-Base is the ambient level at the 98th percentile for all sites in a region.
Regions CD_Base A1B_Base A1B_US A1B_BC A1B_Met A1B_M A1B_M_LU
Northwest 73 (43) 2 (1) 2 (0) 2 (3) -7 (-1) 1 (-1) 2 (-1)
Southwest 106 (62) -4 (0) -6 (-4) 3 (5) -3 (0) 0 (0) -3 (-1)
Central 80 (54) 5 (4) -5 (-2) 3 (5) 6 (3) 7 (2) 8 (2)
South 107 (60) 3 (6) -2 (-2) 1 (4) 1 (5) 5 (5) 4 (5)
Midwest 123 (72) 6 (4) -5 (-3) 1 (2) 8 (6) 13 (6) 10 (6)
Southeast 103 (66) -2 (1) -10 (-5) 1 (2) 7 (6) 7 (5) 8 (5)
Northeast 135 (75) 4 (2) =9 (-5) 1 (1) 7 (6) 16 (7) 15 (7)


Regions CD_Base A1B_Base A1B_US A1B_BC A1B_Met A1B_M A1B_M_LU
Northwest 12.2 (3.3) 0.0 (-0.1) -1.2 (-0.3) 0.0 (0.0) 0.9 (0.3) 1.1 (0.3) 1.1 (0.3)
Southwest 23.6 (6.6) 2.5 (0.4) 0.2 (-0.1) 0.3 (0.1) 1.6 (0.4) 1.8 (0.4) 1.8 (0.4)
Central 5.9 (1.8) 1.3 (0.0) -1.0 (-0.3) 0.0 (0.0) 0.0 (0.0) 0.5 (0.1) 2.2 (0.3)
South 13.3 (4.7) 3.9 (0.7) -1.7 (-0.4) 0.1 (0.1) -0.5 (-0.1) 1.9 (0.5) 5.2 (1.2)
Midwest 16.1 (6.3) 5.5 (0.7) -1.7 (-0.9) 0.0 (0.0) 0.3 (0.2) 2.5 (0.6) 6.6 (1.7)
Southeast 16.8 (6.9) 9.5 (1.9) -0.1 (-0.4) 0.0 (0.0) 0.1 (0.2) 4.8 (1.3) 9.4 (2.4)
Northeast 28.9 (8.7) -2.8 (-0.2) -7.5 (-1.3) 0.2 (0.0) -0.1 (0.1) 1.2 (0.5) 3.8 (1.2)


For PM2.5, the projections are somewhat different. On average, there is little change in future PM2.5 in the western half of the United States. In contrast, the eastern half of the United States experiences both slight increases (~2 μg m-3 over the central portion) as well as decreases along the Gulf Coast and the Northeast. Peak values show a larger change, with all regions except the Northwest (no change) and Northeast (decrease of 2.8 μg m-3) exhibiting an increase ranging from 1.3 μg m-3 in the Central to 9.5 μg m-3 in the Southeast. When changes in aerosol water content also are considered (not shown), all regions except the Northwest, Central, and Midwest show a decrease in peak concentrations, which is consistent with the simulated changes in humidity.
 
Unlike for ozone, changes in chemical boundary conditions have almost no impact on PM2.5 concentrations, because the majority of PM2.5 at the boundary is removed through deposition prior to reaching the United States. Similar to ozone, changes in future anthropogenic emissions results in a decrease in both average and peak PM2.5 concentrations, with the peak concentrations decreasing by as much as 7.5 μg m-3 in the Northeastern United States. Changes in climate alone lead to slight increases in peak PM2.5 in all regions except the South and Northeast, which experience slight decreases. When biogenic emissions are allowed to change along with the climate, all regions show an increase in peak concentrations, with the largest increases occurring in the Midwest (2.5 μg m-3) and Southeast (4.8 μg m-3). When future LULC is considered, this increase in peak concentrations is enhanced in all regions except the Northwest and Southwest due to expansion of cropland and the associated increases in monoterpene and sesquiterpene emissions, which lead to enhanced secondary organic aerosol (SOA) formation.
 
It should be recognized that the results presented here are for one modeling configuration and one IPCC future scenario. As illustrated in the synthesis provided by Weaver, et al. (2009), it is clear that different modeling systems and different scenarios can lead to quite different results. Thus, there is a need to continue to build an ensemble of modeling results for future conditions to account for both the uncertainty and diversity in modeling approaches as well as the range of possible trajectories for global change.
Figure 4
Figure 4. Change in summertime daily maximum 8 hr ozone levels (left) and 24 hr PM2.5
concentrations (right) for the A1B cumulative effects case minus the current decade base
case (A1B_Base – CD_Base).
 
Figure 5
Figure 5. Change in summertime average daily maximum 8 hr ozone levels and average 24
hr PM2.5 concentrations for the A1B chemical boundary conditions case minus the current
decade base case (A1B_BC – CD_Base).
Figure 6
Figure 6. Change in summertime average daily
maximum 8 hr ozone levels (left) and average 24 hr PM2.5 concentrations (right) for the A1B
US emissions case minus the current decade base case (A1B_US – CD Base)
 
Figure 7.
Figure 7. Change in summertime average daily maximum 8 hr ozone levels for the A1B
meteorology + biogenic emissions minus current decade base case (A1B_M – CD_Base)
(left panel) and for the A1B meteorology + biogenic emissions + landuse cases minus the
current decade base case (A1B_M_LU – CD_Base) (right panel)
 
Figure 8
Figure 8. Change in summertime average 24 hr PM2.5 concentrations for the A1B
meteorology + biogenic emissions minus current decade base case (A1B_M – CD_Base)
(left panel) and for the A1B meteorology + biogenic emissions + landuse cases minus the
current decade base case (A1B_M_LU – CD_Base) (right panel).
 
 
Consideration of Policy Needs—Relative Response Factor Analysis
There is growing recognition that current air quality management efforts need to account for potential climate change impacts. For ozone, where a warmer climate implies higher ozone concentrations, the impact of climate change has been discussed in terms of a climate penalty with regard to the level of controls needed to attain the ozone standard. In this section, we describe a method to incorporate the simulations presented above in terms useful for decision support related to ozone control strategies. For these cases, models are used in a relative sense, where the ratio of the future to baseline (current) simulated daily maximum 8 hr ozone is calculated instead of the absolute difference between the two simulations. The future and baseline simulations typically use the same meteorology, biogenic emissions, and chemical boundary conditions, and so only differ in the baseline and future control strategy anthropogenic emission inventories. The ratio of the simulated control case to baseline daily maximum 8 hr ozone at any monitor is termed a Relative Response Factor (RRF), and represents the model response to a specific change in emissions.
 
We define the RRF as follows:
Scientific formula
where Nexc is the number of days that exceed the 8 hr ozone NAAQS (75 ppb was used in this work) in the current emissions simulation, t is the day, and [O3] is the daily maximum 8 hr ozone for days in which the current emissions simulation exceeds the 8 hr ozone NAAQS. Modeled ozone for the current and future emissions cases come from the CD_Base and A1B_US simulations. Although this definition of the RRF does not exactly match how the RRF is defined in a SIP modeling demonstration, it is consistent in the sense that it represents the model response to a given set of emissions changes.
 
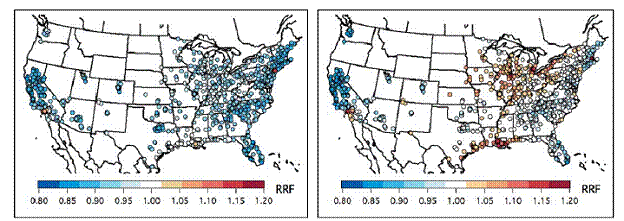
Figure 9 shows RRFs at 1135 ozone monitoring locations throughout the continental United States. RRFs less than 1 are shown in shades of blue and imply a reduction in ozone due to the projected anthropogenic emissions changes for 2050, while RRFs greater than 1 are shown in shades of red and imply an increase in ozone. Nearly all sites (97%) have an RRF less than 1, which means ozone is reduced in nearly all locations based on the projected 2050s U.S. anthropogenic emissions with current decade meteorology.
 
A key issue facing policy makers with regard to climate change and air quality is how potential climate change may impact the RRF. For example, assuming the RRF at a particular site is less than 1, if climate change causes the RRF to increase, then additional emission reductions will be necessary to achieve the same decrease in ozone that would have been obtained in the absence of climate change. We define a Climate Adjustment Factor (CAF) as follows:
Scientic formula
where, Nall is the number of simulation days, t is the day, and O3 is the daily maximum 8 hr ozone. The “current climate + future emissions” scenario corresponds to the A1B_US case, while the “future climate + future emissions” scenario corresponds to either the A1B_US_Met case (future anthropogenic emissions and future climate) or the A1B_US_M case (future anthropogenic emissions and future climate along with the associated change in biogenic emissions). A climate adjusted RRF (RRFclimate) is then defined as:
Scientific formula
where, RRF is defined in Equation 1 and CAF is defined in Equation 2. Results for the climate adjusted RRF are shown in Figure 9 (right panel).
 
Figure 9
Figure 9. Spatial map of the RRF (left panel) (CD_Base vs A1B_US) for the 1135 ozone
monitoring locations in which the CD_Base case had at least one day in which the daily
maximum 8 hr ozone exceeded 75 ppb. Values less than 1 imply a reduction in daily
maximum 8 hr ozone, while values greater than 1 imply an increase in daily maximum 8 hr
ozone . Right panel shows RRFs (2050 vs 2000) adjusted for climate change, where biogenic
emissions are allowed to change with the future climate.
 
 
In all regions, except the Northwest and Southwest, climate change increases the regional average RRF, the peak RRF, and the spatial variability (represented by the standard deviation) of the RRF. In the Southwest, the peak RRF and the spatial variability of the RRF both increase with future-climate conditions, while the average RRF is unchanged. In the South, Midwest, and Northeast, the increase in the average RRF due to climate change more than offsets the decrease in ozone achieved by the change in anthropogenic emissions (i.e., RRF is < 1, while RRFclimate is ≥ 1). In other regions, the increase in RRF due to climate change does not completely offset the decrease in ozone achieved by the projected anthropogenic emissions changes, but it does reduce the effect those changes have on ozone. In all regions but the Northwest, the number of sites having an RRF > 1 greatly increases under the future climate, with nearly half (45%) of all sites having a climate adjusted RRF > 1, compared to only 3% when climate change is not taken into account. These results are reported in more detail in Avise, et al. (2012).
 
Policy Relevant Background (PRB) Analysis
For ozone, there is a shrinking window within which air quality managers can operate between increasingly tighter air quality standards and increasing global background levels. This places an additional burden upon correctly specifying regional background levels both under current conditions and for conditions projected into the future. In recent years, the concept of Policy Relevant Background (PRB) has been introduced as one way to address the issue of ozone background levels. The PRB is defined as the ozone levels that occur within the United States in the absence of all North American anthropogenic emissions, but including the effects of long range transport of ozone and precursors from outside of North America and including continental biogenic emissions. PRB also can include the effects of NOx from lightning, ozone intrusions from the upper troposphere and lower stratosphere, and emissions from wildfires. In this sense, the PRB is purely a model construct and one that requires treatment of both Asian emissions and transport as well as continental biogenic emissions and chemistry.
 
For these PRB simulations, we employed our general modeling framework, but omitted all North American (Canada, United States, and Mexico) anthropogenic emissions. We also incorporated a new approach for treatment of NOx from lightning. However, for the PRB results reported here, we did not include the effects of emissions from wildfires. Intrusion of upper tropospheric ozone was only treated to the extent that elevated ozone introduced in the upper portion of the modeling domain through the chemical boundary conditions can be transported to the surface due to potential transport mechanisms captured with WRF.
 
PRB for current and future conditions
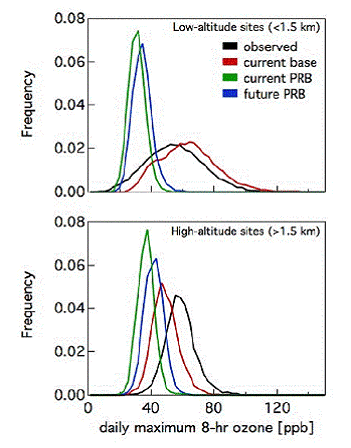
As a first step, it is worthwhile to compare the distribution of simulated ozone levels (including U.S. emissions) to the distribution of ozone measured at low and high altitude sites (Figure 10). The low altitude sites tend to be more in the Eastern United States and near urban zones and exhibit higher levels of ozone (top panel, Figure 10) with a broader range, while the high altitude sites occur more in the West and exhibit a much narrower range (bottom panel, Figure 10). These high altitude sites can be used to approximate natural background conditions. In comparison to the observations, our simulations slightly overestimate the peak in the distribution for low altitude sites and slightly underestimate the peak in the distribution for high altitude sites, but correctly capture the difference in distributions between low and high altitude locations. Figure 10 also includes the distribution of ozone for the PRB simulations for both current and future summertime conditions. In this case where there are no local anthropogenic emissions, there is much less difference in the shape of the distributions between low and high altitude locations and both show less ozone for current conditions compared to the observed ozone levels. The peak in the PRB ozone distribution for current conditions is slightly less than 40 ppb, and the peak is approximately 5 ppb higher at high altitude sites compared to low altitude sites.
Figure 10
Figure 10. Simulated and observed ozone distributions for low altitude and high altitude monitoring sites in the United States and the corresponding simulated PRB ozone distributions for both current and future summertime conditions.
 
 
For future conditions, the peak in the ozone distributions for PRB increases compared to current conditions, but only by a few ppb for low altitude sites and slightly more for high altitude sites. This is consistent with increasing emissions from Asia resulting in higher ozone concentrations, primarily in the Western United States.
 
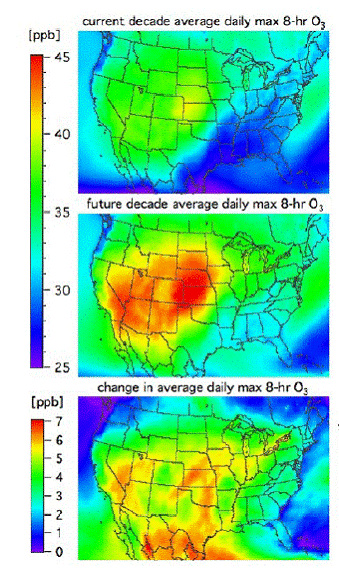
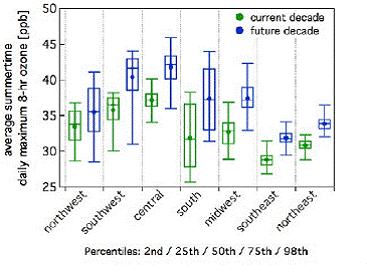
While the range of PRB ozone concentrations is less than current observations at low altitude sites, there are still considerable differences in PRB levels across different regions in the United States. This is shown in the maps in Figure 11 and in the summary graph in Figure 12.
 
Figure 11
Figure 11. Maps of PRB simulation results for daily maximum 8 hr ozone levels under current
(top) and future conditions (middle) and the difference between future and current results
(bottom).
 
Figure 12
Figure 12. Summary of PRB simulations for current and future summertime conditions by region across the United States.
 
 
The range of concentrations varies by region with higher levels in the Western and Central portions of the United States and lower ranges in the South and Eastern United States. At the 98th percentile, ozone levels vary from 32 ppb in the Southeast to 40 ppb in the Central United States (which includes portions of the Rocky Mountains). A summary of these changes is shown in Table 3.
 
 
Table 3. Summary of changes (future case - current base case) in daily maximum 8 hr average ozone [ppb]. The change in average daily maximum 8 hr average ozone is shown in parenthesis. CD-ICCG_PRB is the ambient ozone level at the 98th percentile for all sites in a region.
Regions CD_ICCO_PRB A1B_ICCO_PRB
Northwest 36 5
Southwest 37 5
Central 40 5
South 39 6
Midwest 37 6
Southeast 31 3
Northeast 32 4


Conclusions:

For summertime conditions during the decade centered on 2050, future climate conditions were obtained by downscaling from ECHAM5 with IPCC SRES A1B assumptions. Future U.S. anthropogenic emissions were from MARKAL projection with biogenic emissions from MEGAN and future land use distributions. The key findings from the work completed include the following:
  • Overall O3 increases by a few ppb across most of the United States.
  • Effects of climate, biogenic, land-use & global emission changes generally increase O3 and this increase is somewhat offset by reduction of U.S. anthropogenic emissions.
  • By increasing biogenic emissions, climate warming leads to an increase in SOA, which more than offsets the reduction in PM2.5 achieved through future emissions controls in the Southeast and parts of the Northeast. The increase in SOA is enhanced when future cropland expansion is considered.
  • A Relative Reduction Factor analysis documented the climate penalty associated with future ozone, and shows that in many cases projected emission changes are not sufficient to achieve a reduction in ozone concentrations under future climate conditions.
  • Analysis of Policy Relevant Background ozone concentrations yields levels that range from 30 to 45 ppb across the United States, and which are projected to increase by approximately 4 ppb in the 2050s with some regions experiencing an increase of as much as 6-7 ppb.

References:

Avise, J., J. Chen, B. Lamb, C. Wiedinmyer, A. Guenther, E. Salathé, and C. Mass, 2009. Attribution of projected changes in summertime US ozone and PM2.5 concentrations to global changes. Atmospheric Chemistry and Physics 9:1111-1124. SRef-ID: 1680-7324/acp/2009-9-1111.

Avise, J., R. G. Abraham, S. H. Chung, J. Chen, B. Lamb, E. P. Salathé, Y. X. Zhang, C. G. Nolte, D. H. Loughlin, A. Guenther, C. Wiedinmyer, and T. Duhl, 2012. Evaluating the effects of climate change on summertime ozone using a Relative Response Factor approach for policy makers. Journal of the Air & Waste Management Association, accepted for publication.

Bond, Tami C., D. G. Streets, K. F. Yarber, S. M. Nelson, J. H. Woo, and Z. Klimont, 2004. A technology-based global inventory of black and organic carbon emissions from combustion, Journal of Geophysical Research-Atmospheres 109:D14203, doi:10.1029/2003JD003697.

Chen, J., Avise, J., Lamb, B., Salathé, E., Mass, C., Guenther, A., Wiedinmyer, C., Lamarque, J.-F., O'Neill, S., McKenzie, D., and Larkin, N, 2009. The effects of global changes upon regional ozone pollution in the United States. Atmospheric Chemistry and Physics 9:1125-1141.

Chen, J. J. Avise, A. Guenther, C. Wiedinmyer, E. Salathe, R. Jackson, and B. Lamb, 2009. Future land use and land cover influences on regional biogenic emissions and air quality in the United States. Atmospheric Environment 43:5771-5780.

Guenther, A., T. Karl, P. Harley, C. Wiedinmyer, P. I. Palmer, and C. Geron, 2006. Estimates of global terrestrial isoprene emissions using MEGAN (Model of Emissions of Gases and Aerosols from Nature). Atmospheric Chemistry and Physics 6:3181-3210, doi:10.5194/acp-6-3181- 2006.

Granier, C., J. F. Lamarque, A. Mieville, J. F. Muller, J. Olivier, J. Orlando, J. Peters, G. Petron, G. Tyndall, and S. Wallens, 2005. POET, a database of surface emissions of ozone precursors. http://www.aero.jussieu.fr/project/ACCENT/POET.php (accessed April 8, 2012).

Loughlin, D. H., W. G. Benjey, and C. G. Nolte, 2011. ESP V1.0: Methodology for exploring emission Impacts of future scenarios in the United States. Geoscientific Model Development 4, 287-297.

Olivier, J. G. J. and J. J. M. Berdowski, 2001. Global emissions sources and sinks. In: Berdowski J., Guicherit, R. and B. J. Heij (eds.) “The Climate System”, Lisse, The Netherlands:  A.A. Balkema Publishers/Swets & Zeitlinger Publishers, pp. 33-78.  ISBN 90 5809 255 0.

Olivier J., J. Peters, C. Granier, G. Petron, J.F. Muller, and S. Wallens, 2003. Present and future surface emissions of atmospheric compounds, POET Report #2, EU project EVK2-1999-00011.

Weaver,C.P., X.-Z. Liang, J. Zhu, P. J. Adams, P. Amar, J. Avise, M. Caughey, J. Chen, R. C. Cohen, E. Cooter, J. P. Dawson, R. Gilliam, A. Gilliland, A. H. Goldstein, A. Grambsch, D. Grano, A. Guenther, W. I. Gustafson, R. A. Harley, S. He, B. Hemming, C. Hogrefe, H.-C. Huang, S. W. Hunt, D. J. Jacob, P. L. Kinney, K. Kunkel, J.-F. Lamarque, B. Lamb, N. K. Larkin, L. R. Leung, K.-J. Liao, J.-T. Lin, B. H. Lynn, K. Manomai phi boon, C. Mass, D. McKenzi e, L. J. Mickley, S. M. O’Neill , C. Nolte, S. N. Pandis, P. N. Racherla, C. Rosenzweig, A. G. Russell , E. Salathé, A. L. Steiner, E. Tagaris, Z. Tao, S. Tonse, C. Wiedinmyer, A. Williams, D. A. Winner, J.-H. Woo, S. Wu, and D. J. Wuebbles, 2009. A preliminary synthesis of modeled climate change impacts on U.S. regional ozone concentrations. Bulletin of the American Meteorological Society 90(12):1843-1863.


Journal Articles on this Report : 12 Displayed | Download in RIS Format

Publications Views
Other project views: All 16 publications 12 publications in selected types All 12 journal articles
Publications
Type Citation Project Document Sources
Journal Article Avise J, Chen J, Lamb B, Wiedinmyer C, Guenther A, Salathe E, Mass C. Attribution of projected changes in summertime US ozone and PM2.5 concentrations to global changes. Atmospheric Chemistry and Physics 2009;9(4):1111-1124. R833369 (2008)
R833369 (2009)
R833369 (2010)
R833369 (Final)
R830962 (Final)
  • Full-text: Atmospheric Chemistry and Physics-Full Text PDF
    Exit
  • Abstract: Atmospheric Chemistry and Physics-Abstract
    Exit
  • Journal Article Avise J, Abraham RG, Chung SH, Chen J, Lamb B, Salathe EP, Zhang Y, Nolte CG, Loughlin DH, Guenther A, Wiedinmyer C, Duhl T. Evaluating the effects of climate change on summertime ozone using a relative response factor approach for policymakers. Journal of the Air & Waste Management Association 2012;62(9):1061-1074. R833369 (Final)
    R830962 (Final)
  • Abstract from PubMed
  • Full-text: Taylor & Francis-Full Text PDF
    Exit
  • Abstract: Taylor & Francis-Abstract
    Exit
  • Journal Article Chen J, Avise J, Lamb B, Salathe E, Mass C, Guenther A, Wiedinmyer C, Lamarque J-F, O'Neill S, McKenzie D, Larkin N. The effects of global changes upon regional ozone pollution in the United States. Atmospheric Chemistry and Physics 2009;9(4):1125-1141. R833369 (2008)
    R833369 (2009)
    R833369 (2010)
    R833369 (Final)
    R830962 (Final)
  • Full-text: Atmospheric Chemistry and Physics-Full Text PDF
    Exit
  • Abstract: Atmospheric Chemistry and Physics-Abstract
    Exit
  • Journal Article Chen J, Avise J, Guenther A, Wiedinmyer C, Salathe E, Jackson RB, Lamb B. Future land use and land cover influences on regional biogenic emissions and air quality in the United States. Atmospheric Environment 2009;43(36):5771-5780. R833369 (2009)
    R833369 (2010)
    R833369 (Final)
    R830962 (Final)
  • Full-text: Science Direct-Full Text HTML
    Exit
  • Abstract: Science Direct-Abstract
    Exit
  • Other: Science Direct-Full Text PDF
    Exit
  • Journal Article Duliere V, Zhang Y, Salathe Jr. EP. Extreme precipitation and temperature over the U.S. Pacific Northwest:a comparison between observations, reanalysis data, and regional models. Journal of Climate 2011;24(7):1950-1964. R833369 (2009)
    R833369 (2010)
    R833369 (Final)
  • Full-text: University Corporation for Atmospheric Research-Full Text PDF
    Exit
  • Abstract: AMS-Abstract
    Exit
  • Other: AMS-Full Text PDF
    Exit
  • Journal Article Duliere V, Zhang YX, Salathe EP. Changes in twentieth-century extreme temperature and precipitation over the western United States based on observations and regional climate model simulations. Journal of Climate 2013;26(21):8556-8575. R833369 (Final)
  • Full-text: AMS-Full Text HTML
    Exit
  • Abstract: AMS-Abstract
    Exit
  • Other: AMS-Full Text PDF
    Exit
  • Journal Article Gonzalez-Abraham R, Chung SH, Avise J, Lamb B, Salathe Jr. EP, Nolte CG, Loughlin D, Guenther A, Wiedinmyer C, Duhl T, Zhang Y, Streets DG. The effects of global change upon United States air quality. Atmospheric Chemistry and Physics 2015;15(21):12645-12665. R833369 (Final)
  • Full-text: AC&P-Full-text PDF
    Exit
  • Abstract: AC&P-Abstract HTML
    Exit
  • Journal Article Salathe Jr. EP, Leung LR, Qian Y, Zhang Y. Regional climate model projections for the State of Washington. Climatic Change 2010;102(1-2):51-75. R833369 (2009)
    R833369 (2010)
    R833369 (Final)
  • Full-text: SpringerLink-Full Text PDF
    Exit
  • Abstract: SpringerLink-Abstract
    Exit
  • Other: University of Washington-Full Text PDF
    Exit
  • Journal Article Salathe Jr. EP, Steed R, Mass CF, Zahn PH. A high-resolution climate model for the U.S. Pacific Northwest: mesoscale feedbacks and local responses to climate change. Journal of Climate 2008;21(21):5708-5726. R833369 (2009)
    R833369 (2010)
    R833369 (Final)
  • Full-text: AMS-Full Text HTML
    Exit
  • Abstract: AMS-Abstract
    Exit
  • Other: AMS-Full Text PDF
    Exit
  • Journal Article Weaver CP, Liang X-Z, Zhu J, Adams PJ, Amar P, Avise J, Caughey M, Chen J, Cohen RC, Cooter E, Dawson JP, Gilliam R, Gilliland A, Goldstein AH, Grambsch A, Grano D, Guenther A, Gustafson WI, Harley RA, He S, Hemming B, Hogrefe C, Huang H-C, Hunt SW, Jacob DJ, Kinney PL, Kunkel K, Lamarque J-F, Lamb B, Larkin NK, Leung LR, Liao K-J, Lin J-T, Lynn BH, Manomaiphiboon K, Mass C, McKenzie D, Mickley LJ, O'neill SM, Nolte C, Pandis SN, Racherla PN, Rosenzweig C, Russell AG, Salathe E, Steiner AL, Tagaris E, Tao Z, Tonse S, Wiedinmyer C, Williams A, Winner DA, Woo J-H, Wu S, Wuebbles DJ. A preliminary synthesis of modeled climate change impacts on U.S. regional ozone concentrations. Bulletin of the American Meteorological Society 2009;90(12):1843-1863. R833369 (Final)
    R830960 (Final)
    R830964 (Final)
    R833370 (Final)
    R833373 (Final)
    R833374 (Final)
  • Full-text: AMS-Full Text PDF
    Exit
  • Abstract: AMS-Abstract
    Exit
  • Journal Article Zhang Y, Duliere V, Mote PW, Salathe Jr. EP. Evaluation of WRF and HadRM mesoscale climate simulations over the U.S. Pacific Northwest. Journal of Climate 2009;22(20):5511-5526. R833369 (2009)
    R833369 (2010)
    R833369 (Final)
  • Full-text: Journal of Climate-Full Text HTML
    Exit
  • Abstract: Journal of Climate-Abstract
    Exit
  • Other: Journal of Climate-Full Text PDF
    Exit
  • Journal Article Zhang Y, Qian Y, Duliere V, Salathe Jr. EP, Leung LR. ENSO anomalies over the Western United States: present and future patterns in regional climate simulations. Climatic Change 2012;110(1-2):315-346. R833369 (2009)
    R833369 (2010)
    R833369 (Final)
  • Full-text: University of Washington-Full Text PDF
    Exit
  • Abstract: SpringerLink-Abstract
    Exit
  • Supplemental Keywords:

    RFA, Scientific Discipline, Air, climate change, Air Pollution Effects, Environmental Monitoring, Ecological Risk Assessment, Atmosphere, air quality modeling, global change, Baysian analysis, climate models, atmospheric models

    Progress and Final Reports:

    Original Abstract
  • 2007
  • 2008 Progress Report
  • 2009 Progress Report
  • 2010 Progress Report
  • Top of Page

    The perspectives, information and conclusions conveyed in research project abstracts, progress reports, final reports, journal abstracts and journal publications convey the viewpoints of the principal investigator and may not represent the views and policies of ORD and EPA. Conclusions drawn by the principal investigators have not been reviewed by the Agency.

    Project Research Results

    • 2010 Progress Report
    • 2009 Progress Report
    • 2008 Progress Report
    • 2007
    • Original Abstract
    16 publications for this project
    12 journal articles for this project

    Site Navigation

    • Grantee Research Project Results Home
    • Grantee Research Project Results Basic Search
    • Grantee Research Project Results Advanced Search
    • Grantee Research Project Results Fielded Search
    • Publication search
    • EPA Regional Search

    Related Information

    • Search Help
    • About our data collection
    • Research Grants
    • P3: Student Design Competition
    • Research Fellowships
    • Small Business Innovation Research (SBIR)
    Contact Us to ask a question, provide feedback, or report a problem.
    Last updated April 28, 2023
    United States Environmental Protection Agency

    Discover.

    • Accessibility
    • Budget & Performance
    • Contracting
    • EPA www Web Snapshot
    • Grants
    • No FEAR Act Data
    • Plain Writing
    • Privacy
    • Privacy and Security Notice

    Connect.

    • Data.gov
    • Inspector General
    • Jobs
    • Newsroom
    • Open Government
    • Regulations.gov
    • Subscribe
    • USA.gov
    • White House

    Ask.

    • Contact EPA
    • EPA Disclaimers
    • Hotlines
    • FOIA Requests
    • Frequent Questions

    Follow.