
Grantee Research Project Results
2010 Progress Report: Transport/Fate/Ecological Effects of Steroids from Poultry Litter & Evaluations of Existing/Novel Management Strategies
EPA Grant Number: R833418Title: Transport/Fate/Ecological Effects of Steroids from Poultry Litter & Evaluations of Existing/Novel Management Strategies
Investigators: Fisher, Daniel J. , Kane, Andrew S. , Staver, Kenneth , Yonkos, Lance T. , VanVeld, Peter , Klauda, Ronald J.
Institution: Wye Research and Education Center , Maryland Department of Natural Resources , Virginia Institute of Marine Science , School of Medicine at the University of Maryland
EPA Project Officer: Aja, Hayley
Project Period: August 1, 2007 through June 30, 2010 (Extended to July 31, 2012)
Project Period Covered by this Report: December 1, 2008 through December 1,2010
Project Amount: $694,736
RFA: Fate and Effects of Hormones in Waste from Concentrated Animal Feeding Operations (CAFOS) (2006) RFA Text | Recipients Lists
Research Category: Endocrine Disruptors , Human Health , Safer Chemicals
Objective:
The award was converted to a cooperative agreement to allow participation of US EPA scientists who are currently working on endocrine disruption issues. Dr. Steve Hutchins and his group at the USEPA National Risk Management Research Laboratory in Ada, OK analyzed aqueous samples for steroids using his GC-MS method. Drs. Jim Lazorchak and Tirumuru Reddy at the USEPA Molecular Indicator Research Branch in Cincinnati, OH analyzed fish livers for vitellogenin (Vtg) using a new Vtg mRNA gene expression assay. Dr. Vickie Wilson of the USEPA, NHEERL, Reproductive Toxicology Division in Research Triangle Park, NC analyzed aqueous samples for estrogenicity (EEQ) using a novel in-vitro estrogen-inducible reporter-gene assay.
The work is proceeding as outlined in the original award.
Progress Summary:
Results and Discussion: During 2008 and 2009 the field managed under TT practices generated substantially less N and P in runoff than the field managed using NT (Figure 1). Initial post- application rains in 2008 caused runoff from the NT field but not the TT field due to the ability of the TT field to absorb more water. Subsequent rains produced similar volumes of runoff from both fields. In general, N tends to be more soluble while P tends to sorb more strongly to sediments. Therefore, vulnerable N leaches more rapidly from litter and surface sediments during initial rains than does P. This explains N loads being much greater in early 2008 runoff from the NT field compared to the TT field but being similar from both fields during later runoff events. Because P is slower to leach from sediments, loads in runoff from the NT field remained above those from the TT field for the entire 2008 season. During 2009 litter application did not occur until the end of May so concentrations of N and P in May runoff reflect residuals from previous field activities. Post application rain events (June) produced higher N and P loads from NT runoff than from TT runoff. Overall N and P loads were lower than the previous year reflecting the impact of multiple small rain events that did not produce runoff. This result was even more dramatic in 2010 where no post-application runoff occurred until July. By this point most N and P had leached below the sediment surface which had smoothed and compacted minimizing nutrient loads in runoff.
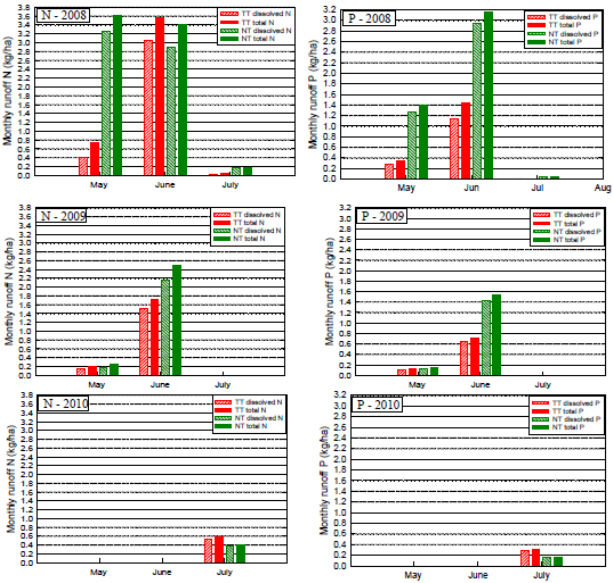
Figure 1. Monthly nutrent runoff loads from NT and TT watersheds (2008, 2009 and 2010).
| Year and Rain Event # | No-till watershet | Turbo-till Watershed | |
|---|---|---|---|
| Endpoint | Concentration (ng/L) | Concentration (ng/L) | |
| 2008 | |||
| 1 | E2 | 9.2 | No runoff |
| E1 | 32.0 | ||
| EEQ | 2.6 | ||
| 2 | E1 | ND | ND |
| E2 | 9.2 | 3.9 | |
| EEQ | 3.5 | 1.2 | |
| 2009 | |||
| 1 | E2 | 0.034 | No runoff |
| E1 | 4.3 | ||
| EEQ | 2.4 | ||
| 2 | E2 | mdl | mdl |
| E1 | 1.9 | 1.4 | |
| EEQ | 1.8 | 0.5 | |
| 3 | E2 | 0.49 | Sample lost |
| E1 | 2.85 | ||
| EEQ | 1.5 | 0.5 | |
| 2010 | |||
| E2 | 0.64 | 0.51 | |
| E1 | 4.26 | 2.44 | |
| EEQ | No analyzed yet | Not analyzed yet | |
| Drount - only one runoff event through summer/early fall | |||
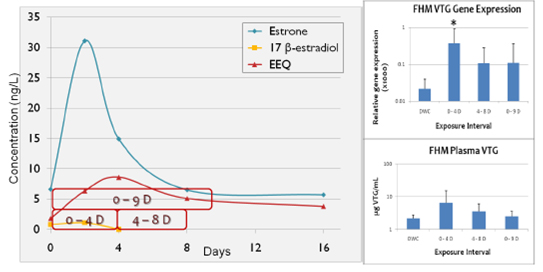
Figure 2. 2008 NT flume mesocosm changes in estrogens, estrogenicity, and fathead minnow
Vtg over time. Red borders indicate fathead minnow exposure perids.
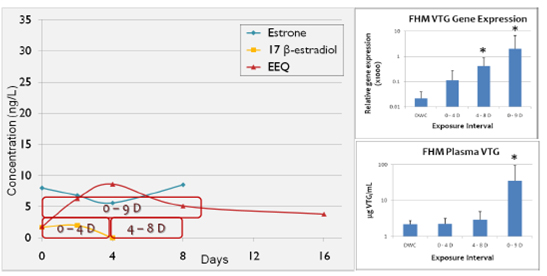
Figure 3. 2008 NT retention pond mesocosm changes in estrogens, estrogenicity, and fathead
minnow Vtg over time. Red borders indicate fathead minnow exposure periods.
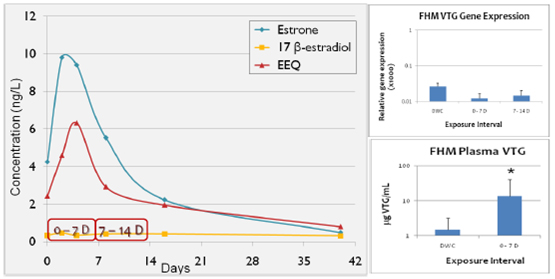
Figure 4. 2009 NT flume mesocosm changes in estrogens, estrogenicity, and fathead minnow VTG
over time. Red borders indicater fathead minnow exposure periods.
| Lake/Pond | Occurrence | Mean (Range) # oocytes/fish1 | |
|---|---|---|---|
| Smithville Lake, MD | 5/10 | 50% | 1.2 (0 - 4) |
| Tuckahoe Lake, MD | 4/12 | 33% | 3.7 (0 - 34) |
| Williston Lake, MD | 8/10 | 80% | 1.9 (0 - 5) |
| Hearns Pond, DE | 8/8 | 100% | 3.6 (1-8) |
| Moores Lake, DE | 6/10 | 60% | 3.1 (0 - 10) |
| McColley Pond, DE | 6/9 | 63% | 2.7 (0 - 32) |
| Total | 37/59 | 63% | `2.7 (0 - 32) |
1 Mean includes fish with no oocytes
| Lake/River | Occurrance | Mean (Range)# oocytes/fish1 | ||||
|---|---|---|---|---|---|---|
| May | August | Total | ||||
| Tuckahoe Lake, MD | 0/10 | 0% | 3/9 | 33% | 16% | 0.5(0 - 4) |
| Pocomoke River, MD | 2/10 | 20% | 1/5 | 20% | 20% | 0.5(0 - 4) |
| Total | 2/810 | 10% | 4/14 | 39% | 18% | 0.5(0 - 4) |
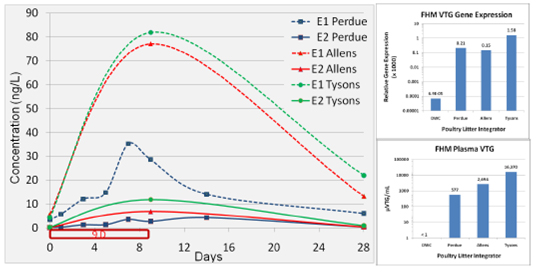
Figure 5. 2010 changes in estrogen (GC/MS) and fathead minnow Vtg (blood plasma and Vtg
mRNA) over time in laboratory experiments with different poultry litters. Red border indicates
fathead minnow exposure over time.
Future Activities:
All activities proposed in the original cooperative agreement have been completed. In addition, additional CAFO steroid work proposed in conjunction with the new Harry R. Hughes Center for Agro-Ecology, Inc. (USDA) antibiotics project funded in 2010 has been mostly completed. Estrogen samples from these 2010 experiments are currently being analyzed by LC/MS/MS and RIA for comparison with the GC/MS analyses already completed. Estrogenicity (EEQ) samples are currently being analyzed using an in-vitro estrogen-inducible reporter-gene assay. These EEQ samples will be compared to the estrogen analyses to determine relationships between the change in estrone and 17-β estradiol concentrations over time and estrogenicity. Estrogenicity in fish as measured by Vtg induction will be compared to the EEQ results to determine the relationship between an aquatic endpoint and a human cell line endpoint.
References:
Journal Articles:
No journal articles submitted with this report: View all 9 publications for this projectProgress and Final Reports:
Original AbstractThe perspectives, information and conclusions conveyed in research project abstracts, progress reports, final reports, journal abstracts and journal publications convey the viewpoints of the principal investigator and may not represent the views and policies of ORD and EPA. Conclusions drawn by the principal investigators have not been reviewed by the Agency.