
Grantee Research Project Results
2009 Progress Report: Effects of Clouds and Tropospheric Air Quality on Surface UV at 6 UV Research Sites
EPA Grant Number: R833224Title: Effects of Clouds and Tropospheric Air Quality on Surface UV at 6 UV Research Sites
Investigators: Lantz, Kathleen O. , Petropavlovskikh, Irina , Kiedron, Peter
Institution: Cooperative Institute for Research in Environmental Sciences
EPA Project Officer: Chung, Serena
Project Period: October 1, 2006 through September 30, 2010
Project Period Covered by this Report: October 1, 2008 through September 30,2009
Project Amount: $299,988
RFA: Implications of Tropospheric Air Pollution for Surface UV Exposures (2005) RFA Text | Recipients Lists
Research Category: Air Quality and Air Toxics , Air , Climate Change
Objective:
Six locations across the continental United States will be used to evaluate the impacts of tropospheric air quality on surface UV irradiance measurements. These six sites are the re-established EPA UV Network and include Table Mountain near Boulder, CO; Rocky Mountain Research Station at Niwot Ridge, CO; Bondville, IL; Fort Peck, MT; Raleigh, NC; and Houston, TX. Our goals will be to evaluate UV-B irradiance from the six locations under a variety of atmospheric conditions.
The specific goals include the following: (1) QA/QC procedures will be developed and implemented on the UV measurements and ancillary data. Procedures include comparing solar irradiance from the Brewer spectrophotometer to measurements from other co-located instruments (i.e., UV broadband radiometers and UV filter radiometers). (2) An algorithm will be developed for determining ozone profiles from Brewer Umkehr measurements and inferring the tropospheric ozone column. (3) Cloud and aerosol properties will be collected from a suite of co-located instruments as part of the SURFRAD Network within the Surface Radiation Research Branch (SRRB), Earth System Research Laboratory, NOAA, and the USDA UV monitoring program. (4) Using the direct-to-diffuse ratio from the UV-MFRSR combined with a UV radiative transfer code, the aerosol single scattering albedo will be estimated for clear-sky conditions at the six sites. (5) The atmospheric conditions will be characterized for total ozone, cloud properties, and atmospheric pollutants. (6) We will provide a comprehensive evaluation of the impact of total ozone and air quality on the tropospheric UV-B transmission. The database provided by NEUBrew, the Central UV Calibration Facility, the Surface Radiation and Research Branch of ESRL/NOAA, and the USDA UV Monitoring Program provides a unique and valuable data set that will help identify the impacts of variable conditions of tropospheric air quality and cloud cover on UV irradiances.
Progress Summary:
This document describes results and progress during the third year under the objectives of the EPA STAR funded proposal “Effects of Clouds and Tropospheric Pollution on Surface UV at six EPA UV Research Sites.” The project’s primary focus is the study of changes in surface UV levels caused by atmospheric pollutants, including aerosols and tropospheric ozone. The re-established NOAA/EPA UV Network at six locations across the United States is currently measuring UV radiation and automated direct sun and zenith sky ozone measurements from which daily ozone profiles are derived.
Database and QA/QC procedures: The Brewer spectrophotometers were originally designed for total ozone measurements. For the ozone measurements, the count rates are corrected for the temperature-dependent band-pass of the various filters and components inside the assembly, and therefore the instruments are not typically temperature stabilized. Because total ozone calculations rely on ratios, the temperature dependence is not as critical as long as the temperature dependence is wavelength independent. However, this is not the case for UV solar irradiance measurements, where temperature changes can cause a significant error. The instrument is not temperature stabilized but is heated, giving internal temperatures typically between 0 and 40 deg Celsius for the NEUBrew sites. Given temperature changes of 40 deg, responsivities and hence solar irradiance can change as much as 20% for the instruments in NEUBrew.
The percent change per degree in the responsivities of the Brewer spectrophotometer was investigated previously by Weatherhead et al., 2001, and was found to be instrument dependent. Several Brewer spectrophotometers used in the previous study are part of the NEUBrew network; however, two instruments were not part of the earlier study, i.e., those in Houston, TX, and Raleigh, NC. The question arises as to whether the temperature coefficients have changed from the earlier work as well as the need to generate temperature coefficients for the two additional instruments. We generated spectral temperature coefficients using external and internal lamp measurements. Temperature coefficients developed here were comparable to the previous studies within the uncertainties [Weatherhead et al., 2001], giving confidence to the temperature coefficients (Figure 1).
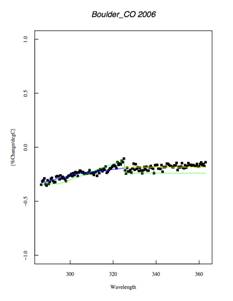
Figure 1: Temperature coefficients for the spectral responsivity in percent change per degree as a function of temperature for a Brewer spectophotometer at the Boulder, CO, NEUBrew site. The black dots are the current studies compared to the green line from earlier work by Weatherhead et al. [2001].
Procedures were developed and implemented for generating higher-level spectral solar irradiance that is temperature corrected (level 212) both as web-generated graphs and ftp ascii files. Both files and plots are available from the NEUBrew website, http://www.esrl.noaa.gov/gmd/grad/neubrew. A document describing the determination of the temperature coefficients and how they are applied to the data is available under the documents link on the NEUBrew website [Lantz et al., 2009a]. In addition, a document describing the angular response corrections to the Brewer solar irradiance measurements is available from the NEUBrew website [Lantz et al., 2009b].
Total Ozone: For improvements in measurements of total ozone, a Langley regression based method was explored to monitor the extraterrestrial constant (ETC) that would be independent of measurements with the internal lamp. This method could effectively reduce the frequency for external Brewer calibrations such as the one performed by Environment Canada. At the Biennial Brewer’s meeting, Peter Kiedron presented and gave an overview of the use of the Langley regression method for improving total ozone measurements within the NEUBrew Network [Kiedron et al., 2009]. Equations were presented for the correction of the total ozone measurements using the Langley-derived correction to the ETC. Issues included non-constant aerosols and pressure. Three data levels of total ozone were calculated and are given: Level 101 uses ETC from calibration, Level 200 uses ETC from Brewer R6 measurements, and Level 300 uses ETC from Langley regressions. Level 300 total ozone data are available from the NEUBrew web-page.
Ozone profiles: The improvement of the Brewer ozone profile retrieval algorithm has continued in the last year of the project. Results of the research have been presented at the WMO ozone cross-section meeting in Geneva in May 2009 [Petropavlovskikh et al., 2009a] and at 12th Biennial WMO-GAW Brewer Users Group Meeting at Aosta, Italy, 20-26 September 2009 [Petropavlovskikh et al., 2009b].
Results for the annual cycle and variance (RMSD) in the retrieved ozone profile are compared against the climatological data for several altitude layers (Figure 3). Several ozone climatologies are available for remote sensing ozone retrievals. The LLM is the compilation of ozone mixing ratio measurements by ozone sounding and SAGE II satellite between 1988 and 2002, and is described in the paper by McPeters et al. [2007]. In addition, validation of the Brewer retrievals was performed against the 4-D climatology developed by P.K. Bhartia and Ch. Wellmeyer (NASA/Goddard, private communications). In the 4-D climatology, ozone variability is presented as a function of the atmospheric pressure, total ozone, latitude, and month. This 4-D climatology is currently used in the TOMS V8 (and OMI) total ozone algorithms. The Umkehr ozone retrieval is based on the a priori, which is a fit to the LLM climatology [Petropavlovskikh et al., 2005]. An important result is the assessment of the zenith sky measurement noise of the Brewer measurements. Results suggested that Brewer Mark IV zenith sky measurement noise is comparable to the Dobson Umkehr measurements, which are a revision from previous measurements at Arosa station in Switzerland between 1996 and 2004 that estimated that the measurement noise in the single Brewer spectrophotometer was twice as small as in Dobson instruments. Therefore, the retrieval algorithm settings have to be adjusted for the measurement noise matrix.
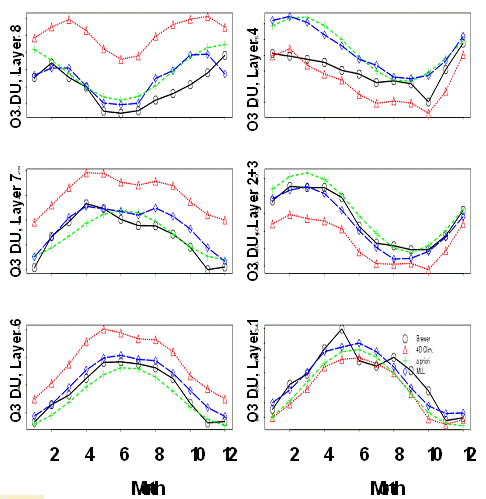
Figure 3. Annual cycle in Brewer retrieved ozone is shown in several Umkehr layers (layer 1 - surface to 250 hPA, layer 2+3 – 250 to 63 hPa, layer 4 – 63 to 32 hPa, layer 5 – 32 to16 hPa, layer 6 - 16 to 8 hPa, layer 7 – 8 to 4 hPa, layer 8 – 4 to 2 hPa). Monthly averaged ozone is shown as derived from Brewer #141 (Boulder, CO) between September 2006 and August 2009 (black), interpolated to the Boulder location from MLL climatology (blue), Umkehr a priori climatology (green), and 4-D climatology (red).
The Brewer Umkehr retrieval algorithm was assessed for sensitivity to effects of changes in ozone x-section, stray light correction, and the atmospheric temperature variability. The matching of the retrieved ozone profile to the measured Umkehr curve is based on the radiative transfer model (or forward model) that is designed to simulate the zenith sky radiance at the surface under conditions matching those during observations. The spectrally resolved radiance is calculated as downward UV radiation emitted by the sun from the nominal SZA. From this, the amount of radiation attenuated by molecular scattering and ozone absorption under similar climatological conditions is used as the first guess. The ozone absorption coefficients and their sensitivity to temperature (second degree polynomial fit) are determined from laboratory measurements by Bass and Paur [BP, 1985] or Daumont [DM, 1992]. Since zenith sky radiation measured by the Brewer is integrated over the band-pass, accurate knowledge of the band-pass spectral shape and position are important for the simulation of zenith-sky conditions. The research addresses the effect of the uncertainties in the ozone absorption spectrum and its temperature dependence on results of the forward model simulations for Brewer Umkehr measurements, and thus their retrieved ozone profile.
Figure 4 shows averaged results of comparisons of Brewer Umkehr ozone profiles. The data are derived from the single Brewer (MK II) measurements taken by Environment Canada at MLO station in Hawaii from 1998 until 2005, but are similar to the NEUBrew network Mark IV data. Percent ozone differences are calculated relative to the operational ozone profile data product (i.e., the BP ozone x-section dataset, no stray light correction, and climatological stratospheric temperature correction). Results are fairly similar in magnitude and vertical distribution to the results of the Dobson Umkehr retrievals in magnitude and vertical distribution (compare to Figure 3). The changes in the Brewer Umkehr ozone profile that are caused by the choice of ozone x-section dataset are limited to +/- 2% (shown in red). These changes are comparable to the accuracy of Brewer Umkehr ozone profiles retrieved in the stratosphere, while in the troposphere they become less significant as compared to the tropospheric ozone retrieval accuracy of ~10%. The effect of the seasonal variability of temperature profiles on retrieved ozone is given in the figure by the vertical bars (blue). It shows that tropospheric ozone (layer 0+1 or between surface and 250 hPa pressure) can have zero to 5% effect, depending on the season. The OOB corrections for single Brewer Umkehr retrievals are chosen to be similar in magnitude to the Dobson’s measured effect. The OOB correction produces similar results on the Brewer Umkehr retrievals. It appears to increase ozone in layers 6, 7, and 8 (between ~30 and ~45 km) by more than 5%, while tropospheric and low stratospheric ozone is reduced by more than 5%. Some differences in the vertical distribution of changes can be related to the geo-location of Boulder and MLO stations that are affected by different dynamical and long-range transport processes, and latitude-dependent difference in the vertical ozone distribution.
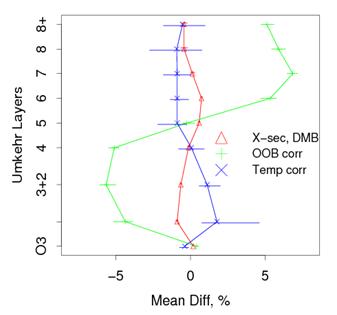
Figure 4. Ozone profile changes (% relative to the standard retrieval) retrieved from the Environment Canada Brewer Umkehr time series collected at MLO, Hawaii, between 1998 and 2005. The range of data is shown with horizontal lines. Changes in the Umkehr ozone profile are due to the use of the DM cross-section in place of BP (red), neglect of the stray light contribution (green), and temperature variability in climatological temperature dataset (dark blue).
The changes in the total ozone column data (level 200) were described in the previous report. Level 200 total ozone data were implemented due to changes in the throughput of the filters that cause changes in the effective extraterrestrial constant. The level 200 ozone column significantly improved correlation with OMI data for the few Brewers that experienced drift due to solar blind filter instability. Recently, the new level 300 total ozone data became available, which represent the total ozone corrected with the Langley derived extra-terrestrial constant (ETC). The level 300 data sets were made available for Umkehr ozone profile retrievals. The software was changed to accommodate corrections to the total ozone values with respect to the ETC corrections. The Umkehr retrievals were repeated, and changes in retrieved profiles were assessed. It was found that the largest effect (about 5%) was seen in the lower most tropospheric layers, which reduced the previously found bias with respect to the co-located ozone-sounding data.
Tropospheric ozone: The variability in tropospheric ozone comes from hydrocarbons from plants, transport from the stratosphere, pollution, UV/sunlight-initiated chemistry, etc. The reason we monitor tropospheric ozone is that it is harmful to humans and the environment, and it is considered a greenhouse gas. The tropopsheric ozone product is used to access how it modulates UV solar radiation as described in the next section.
The tropospheric ozone column is determined from the Umkehr ozone profiles. The validation of the Brewer measured Umkehr ozone profiles in Boulder, CO, was performed against the co-located ozone sounding data. While ozone sondes provide more detailed information on ozone in the troposphere, they are not available in many places and are expensive to operate. At the same time, Umkehr measurements are automated and less expensive. Therefore, we use the Umkehr to monitor tropospheric ozone variability in places where there are no balloon observations. Umkehr can retrieve free tropospheric ozone in single layer 1 (surface to ~250 mb).
The issue of comparing ozone-sonde measurements and Umkehr ozone is that ozone values are in different units and resolutions, while measurements are often done on different days. It would be best to compare same-day values. Therefore, we compare Umkehr measurements 1 day apart. We also filter data using meteorological regimes, tropopause heights/troposphere thicknesses, and back trajectories.
The same day ozone-sonde and Umkehr data in Boulder between 1978 and 2007 provide a correlation of 52%, and the slope of the scatter plot is ~0.56. Comparisons of Umkehr data taken 1 day apart are investigated, and the correlation is found to be as low as 34%. The reason for the low correlation is high variability in the tropopsheric ozone due to transport and local pollution sources. Our best possibility then is to see comparisons as good as this situation. Following the method of Follette-Cook et al (2007, Hudson et al., 2003; Hudson et al., 2006), we find that the correlation can be improved from 17 to 36% when measurements are taken on different days but are in the same meteorological regime (defined by location of subtropical and polar jets).
UV variability due to total ozone and tropospheric ozone: Level 211 UV solar irradiance from the Brewer spectrophotometers was investigated against total ozone and tropospheric ozone for the six sites. Tropospheric ozone determined from the Umkehr ozone profiles of the Brewer spectrophotometers and level 200 total ozone from the Brewer spectrophotometer was used in the analysis. Total ozone and the tropospheric ozone column derived from the Brewer spectrophotometers were used as inputs to the TUV radiative transfer code [Madronich et al., 1993]. Results for the initial analysis of measured UV solar irradiance versus tropospheric ozone were inconclusive and statistically insignificant. However, the temperature dependence of the Brewer spectrophotometer measurements could likely mask the effect.
NOAA Hollings Scholars: Two NOAA Hollings scholarship recipients were mentored in the summer of 2009 to study the effects of air quality on UV, and to compare ozone sondes with Brewer ozone profiles.
Future Activities:
QA/QC: The majority of the QA/QC procedures have been implemented. For UV solar irradiance measurements, if time permits we will improve the correction of the angular response error in the Brewer spectrophotometer data using the diffuse and direct solar irradiance from the UV-MFRSR radiometers using the methodology developed in earlier in the project.
Tropospheric ozone column: Results from the comparisons of ozone sondes and Umkehr-derived ozone profiles from the improved algorithm will be described in a publication.
UV radiation and air quality: The work on UV variability with tropospheric ozone will be further investigated using the temperature-corrected level 212 UV solar irradiance. Factors affecting UV from the Brewer spectrophotometer will be further investigated using derived properties from SURFRAD and the USDA Monitoring Networks.
References:
Journal Articles on this Report : 1 Displayed | Download in RIS Format
| Other project views: | All 35 publications | 13 publications in selected types | All 6 journal articles |
|---|
| Type | Citation | ||
|---|---|---|---|
|
|
Petropavlovskikh I, Evans R, McConville G, Miyagawa K, Oltmans S. Effect of the out-of-band stray light on the retrieval of the Umkehr Dobson ozone profiles. International Journal of Remote Sensing 2009;30(24):6461-6482. |
R833224 (2009) R833224 (Final) |
Exit Exit |
Supplemental Keywords:
Stratospheric Ozone, Tropospheric Ozone, Air Quality, Aerosol Optical Depth, Multi-Filter Rotating Shadowband Radiometer, Brewer Spectrophotometer, Ultraviolet, TUV Radiative Transfer Model,, RFA, Air, Atmosphere, Air Pollution Effects, climate changeRelevant Websites:
http://www.esrl.noaa.gov/gmd/grad/neubrewProgress and Final Reports:
Original AbstractThe perspectives, information and conclusions conveyed in research project abstracts, progress reports, final reports, journal abstracts and journal publications convey the viewpoints of the principal investigator and may not represent the views and policies of ORD and EPA. Conclusions drawn by the principal investigators have not been reviewed by the Agency.