
Grantee Research Project Results
2008 Progress Report: Rapid and Quantitative Detection of Helicobacter Pylori and E. Coli O157 in Well Water Using a Nano-Wired Biosensor and QPCR
EPA Grant Number: R833005Title: Rapid and Quantitative Detection of Helicobacter Pylori and E. Coli O157 in Well Water Using a Nano-Wired Biosensor and QPCR
Investigators: Alocilja, Evangelyn C. , Rose, Joan B. , Dreelin, Erin
Institution: Michigan State University
EPA Project Officer: Packard, Benjamin H
Project Period: November 1, 2006 through October 31, 2009 (Extended to October 31, 2011)
Project Period Covered by this Report: November 1, 2007 through October 31,2008
Project Amount: $600,000
RFA: Development and Evaluation of Innovative Approaches for the Quantitative Assessment of Pathogens in Drinking Water (2005) RFA Text | Recipients Lists
Research Category: Drinking Water , Water
Objective:
Objective 1: Develop a protocol for processing water samples for the biosensor and QPCR
Objective 2: Assess the performance of the biosensor and qPCR for sensitivity, specificity, recovery, and false positives/negatives of detection and enumeration for E. coli O157:H7 and H. pylori in groundwater samples from the field.
Objective 3: Develop a method for detecting and enumerating E. coli O157:H7 and H. pylori by QPCR using bacteria isolated and screened by the biosensor system.
Objective 4: Validate a method for testing viability of E. coli O157:H7
Progress Summary:
Status of Objective 1: Develop a protocol for processing water samples for the biosensor and QPCR
The protocol reported in our 2007 progress report continues to be used in the water sampling for the biosensor and qPCR experiments.
Status of Objective 2: Assess the performance of the biosensor and qPCR for sensitivity, specificity, recovery, and false positives/negatives of detection and enumeration for E. coli O157:H7 and H. pylori in groundwater samples from the field
qPCR:
Key results and findings of the qPCR development: (1) Rapid qPCR methods have been developed for two fecal indicators E.coli and Enterococci and two pathogens Helicobacter and E.coli 0157H7; (2) qPCR has been used to detect Helicobacter in sewage and detects what is likely the viable non-cultivatible state (previous report and publication); and (3) qPCR is highly correlated to E.coli and Enterococci in sewage but this same assay does not detect all of the species present in manure, either due to interferences or more likely due to specificity of the primers. A detailed report is presented in Appendix 1.
Biosensor:
For biosensor development, we have optimized the sample volume that will result in the most signal. We have also conducted studies on viability, specificity, and sensitivity evaluations. The biosensor has been initially tested using seeded environmental water collected from various sites in Michigan. Major findings include the following: (1) The optimal volume for testing was 100 μl; (2) The optimal ratio of sample to water was 3 ml of sample mixed with 2 ml of sterile water; (3) The biosensor cannot differentiate between viable and non-viable bacteria in samples; (4) The biosensor was specific for E. coli O157:H7 when tested against Staphyloccus Aureus, Enterococcus sp., Enterobacteriaceae sp., Salmonella sp., Pseudomonas sp., and Shigella sp.; (5) The biosensor sensitivity 3x10³ cfu/ml; and (6) Initial testing in seeded water showed that the biosensor was effective in more complex environmental water samples. A detailed report is presented in Appendix 2.
Status of Objective 3: Develop a method for detecting and enumerating E. coli O157:H7 and H. pylori by QPCR using bacteria isolated and screened by the biosensor system. After optimizing some more parameters and testing in seeded and natural water samples, we will then go into the integration of the qPCR and biosensor.
Status of Objective 4: Validate a method for testing viability of E. coli O157:H7
The viability assay was optimized and tested for specificity. The assay was initially tested using environmental water samples collected from various sites in Michigan. Key results include the following: (1) samples collected on July 28, 2008 and stored until August 5, 2008 showed a marked decrease in measurable viability when compared to samples collected on August 4, 2008 and tested within 24 hours; (2) The greatest diagnostic value of the assay was noted when the gold standard cutoff was set to approximately 600 cfu/mL; the area under the curve achieved here was approximately 0.76; and (2) When tested for specificity against the following bacteria: Staphyloccus Aureus, Enterococcus sp., Enterobacteriaceae sp., Salmonella sp., Pseudomonas sp., Shigella sp., Klebsiella sp., and Citerobacter sp., all showed marked levels of crossreactivity with the developed assay. Four of the species tested, Staphyloccus Aureus, Enterobacteriaceae, Salmonella, and Pseudomonas, displayed higher reactivity than Escherichia coli to developed assay. The high level of cross-reactivity of developed assay to species of bacteria other than the target is most likely a result of the currently employed antibody’s lack of binding specificity for Escherichia coli. A detailed report is presented in Appendix 3
Appendix 1: qPCR component
Key Results and Findings
1. Rapid qPCR methods have been developed for two fecal indicators E.coli and Enterococci and two pathogens Helicobacter and E.coli 0157H7.
2. qPCR has been used to detect Helicobacter in sewage and detects what is likely the viable non-cultivatible state (previous report and publication).
3. qPCR is highly correlated to E.coli and Enterococci in sewage but this same assay does not detect all of the species present in manure, either due to interferences or more likely due to specificity of the primers.
Future Efforts
We are currently preparing a publication on the qPCR indicator studies. We will also begin characterizing the occurrence of 0157 in sewage and manure along with E.coli and Enterococci as indicators with qPCR.
1) Development of a real-time PCR to detect E.coli O157, E.coli and enterococci from environmental samples:
E.coli O157, one among the several serotypes of enterohaemorrhagic E.coli is known to cause serious diarrheal disease in humans that may develop into chronic hemolytic uremic syndrome or HUS, especially in young children and elderly. Several food borne and waterborne outbreaks have been reported due to this pathogen (Doyle et al, 2001). Traditionally, sorbitol-MacConkey agar is used as a culture medium as E.coliO157:H7 does not ferment sorbitol rapidly. The colorless colonies are then assayed for the O157 antigen with the antiserum (Boyce, 1995). Even though this method is inexpensive, it is time consuming and organisms that are sorbiol-negative could be identified as E.coliO157, thus giving false-positive results. Moreover, studies have indicated that this pathogen can enter into a viable-non culturable (VNBC) state and still can be pathogenic to humans in many stressed conditions (Juhna et al 2007, Kolling GL & Matthews KR 2001, Mizunoe et al 1999). Molecular methods such as Polymerase Chain Reaction (PCR) or Real-time PCR methods can overcome this problem and are being applied in the diagnosis of several infectious diseases (Fredricks and Relman, 1999). The absence of GUDphenotype is characteristic of E. ColiO157 which is being utilized for detection of the pathogen in cultivation based methods. This phenotype has been suggested to be due to a guanosine (G) dinucleotide insertion in the uidA gene that alters the codons causing the translation process to terminate due to the frameshift mutation (Monday, 2001). Except for the wild type O157 phenotypes that were GUD+ and Sor+, all other strains isolated from various O157 outbreaks have been found to have this GG insertion which could be utilized in the molecular identification of E.coliO157 (Manning, 2008)
We have designed a qPCR assay for E.coli O157 that aims at this GG insertion in the uidA gene at +686 position. We have summarized method development here and more extensive evaluation will be done to test the specificity of the assay to detect O157. In addition, we also developed qPCR assay for E.coli in general targeting uidA gene and also standardized a qPCR assay that detects 23SrDNA from enterococci. The idea is to have a parallel molecular detection method for the fecal indicator organisms, E.coli and enterococci which are being used as standards to monitor water quality.
Materials & Methods:
Cultures and DNA extraction: Escherichia coli O157 ATCC strain 43895, Escherichia coli ATCC strain 15597 and Enterococcus faecalis ATCC strain 19433 were used in this method development. The frozen bacterial cultures were revived in 5ml of Trypticase Soy Broth and incubated at 37oC for 18-24h. DNA extraction was done from this bacterial culture by using the QIAmp DNA mini kit (Valencia, CA, USA) according to the manufacturer’s instructions.
Conventional PCR:
a) E.coli and E.coli O157: The uidA gene of both E.coli and E.coli O157 were amplified separately using the forward primer 5’-GCAGTCTTACTTCCATGATTTCTTTA-3’ and the reverse primer 5’- ATGCGAGGTACGGTAGG-3.These primers were developed using the Roche Light Cycler Primer Design Software. Polymerase chain reaction (PCR) was performed in a 25μl total reaction mix which contained 14 μl Hotstart DNA Polymerase Mastermix, 0.4μM of each primer, 3 μl of the template DNA and molecular graded water (QIAgen, Valencia,CA, USA) to make up the final volume of 25 μl. The PCR was initiated with 10min at 95oC followed by 35 cycles of 30 sec at 95oC; 30 sec at 57oC and 60 sec at 72oC and a cycle of final extension at 72oC for 8 min. Negative controls (reaction mix with molecular graded water instead of DNA) were included in the PCR runs. The products were visualized in 1.2% agarose gel stained with Gel-red by means of UV-trans illumination and a 100-bp DNA ladder (Promega, Madison, USA) was used as a marker.
b) Enterococcus faecalis:
The 23SrDNA gene was amplified using the forward primer 5’ATCTACCCATGTCCAGGTTGAAG3’ and reverse primer 5’CCATCTCGGGTTACCGAATTCAG3’. These primers were developed using the Roche Light Cycler Primer Design Software. Polymerase chain reaction (PCR) was performed in a 25μl total reaction mix which contained 15 μl Hotstart DNA Polymerase Mastermix, 0.4μM of each primer, 2 μl of the template DNA and molecular graded water (QIAgen, Valencia,CA, USA) to make up the final volume of 25 μl. The PCR was initiated with 10min at 95oC followed by 35 cycles of 30 sec at 94oC; 30 sec at 60oC and 30 sec at 72oC and a cycle of final extension at 72oC for 10 min. Negative controls (reaction mix with molecular graded water instead of DNA) were included in the PCR runs. The products were visualized in 1.2% agarose gel stained with Gel-red by means of UV-trans illumination and a 100-bp DNA ladder (Promega, Madison, USA) was used as a marker.
Preparation of qPCR standards:
The amplified PCR products were cloned into TOPO PCR 2.1 and transformed with the TOPO10 F’ competent cells (Invitrogen Inc., Carlsbad,CA, USA), according to the protocol provided by the manufacturer and the transformants were carefully picked, and inoculated in Luria–Bertani broth plus ampicillin (50mg/ml) for 12-16 h in a shaker incubator set at 200rpm at 37oC. Plasmids were extracted using the QIAGEN spin kit and were sequenced at the Research Technology Support Facility (RTSF) that confirmed the insertion of target inside the vector. The concentration of the plasmids was measured on a nano-spectrophotometer several times and the mean value was calculated. These were then serially diluted ten-fold to construct qPCR standard curves.
Primers and Probes:
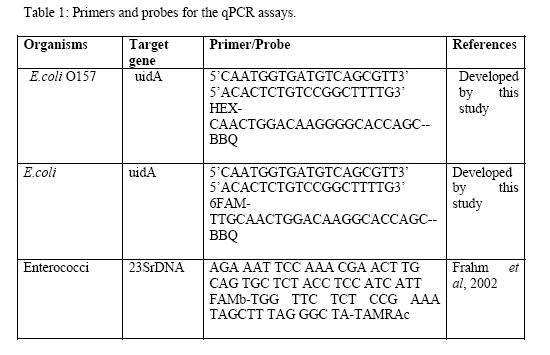
Primers were designed to decrease the size of the amplicon to suit the size of the qPCR detection. The primers and the probe for the region of E.coli O157 uidA gene that carries the G-G dinucleotide insertion sequence were designed by TIB Molbiol, Freehold, NJ USA. The primers were not specific to E.coli O157 but the probe was designed in such a way that it would be able to detect specifically the uidA gene with G-G dinucleotide insertion sequence. Another probe was also designed for the same region that does not carry the G-G dinucleotide insertion sequence to detect generic E.coli. These two probes were designed with the idea of multiplexing the assay for the indicators and the pathogen E.coli O157 using the same set of primers. The sequences for primers and the probe for the Enterococcus faecalis 23SrDNA were obtained from a published article (Frahm & Obst, 2003)
The sequences of these primers and probes are summarized in Table 1:
qPCR assay:
a) E.coli and E.coli O157:
The quantification of uidA gene for E.coli and E.coli O157 were optimized separately by using the primers and probes described in Table 1. Ten-fold dilutions of corresponding plasmids were prepared ranging from 1.2x10⁶ to 1.2x10 and were used as template to prepare the standard curve. The reaction mix for amplification of uidA gene consisted of 2μl of the Fast Start Light Cycler Mastermix (Roche, Indianapolis, IN), 0.5 μM of each of forward and reverse primers, 0.2 μM of the probe A (Table 1), 3.2 μM MgCl2 and nuclease free water to make up the final volume to 20 μl. The assay was carried out in LightCycler® (Roche, Indianapolis, IN) through the following temperature profiles; 10min at 95oC followed by 35 cycles of denaturation for 30 sec at 94oC; annealing for 30 sec at 60oC and extension at 72oC for 8 sec. Triplicate analysis was done for each dilution and negative controls. Threshold cycle temperature (Ct) was measured during each amplification and was analyzed by absolute quantification method. Efficiency of amplification (E) was also estimated from standard curve by applying the formula, E= (10-1/slope)-1 . A slope of -3.32 is theoretically generated by a 100% efficient reaction.
b) E.faecalis:
The quantification of 23SrDNA gene for enterococci was also performed in a similar way as described above by using the primers and probes described in Table 1. A ten-fold dilution of corresponding plasmids was prepared ranging from 3x10⁶ to 3.2x10 and was used as template to prepare the standard curve. The reaction mix for qPCR consisted of 4μl of Taqman Light Cycler Mastermix (Roche, Indianapolis, IN), 0.5 μM of each of forward and reverse primers, 0.4 μM of the probe A (Table 1), 5 μl of plasmid DNA and nuclease free water to make up the final volume to 20 μl. The assay was carried out in LightCycler® (Roche, Indianapolis, IN) through the following temperature profiles; 10min at 95oC followed by 35 cycles of denaturation for 30 sec at 94oC; annealing for 30 sec at 60oC and extension at 72oC for 8 sec. Triplicate analysis was done for each dilution and negative controls. Threshold cycle temperature (Ct) was measured during each amplification and was analyzed by absolute quantification method.
Results:
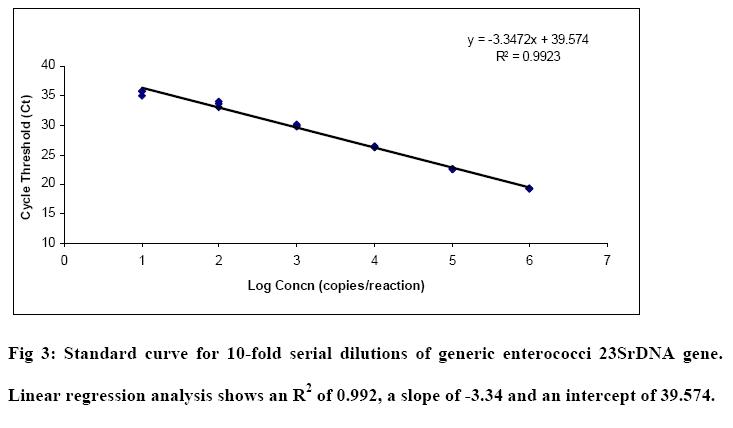
The qPCR standards were generated for generic E.coli, E.coli O157 and enterococci. The amplification curves and standard curves for each assay are shown in Fig1, Fig2 and Fig 3 respectively. A linear relationship was observed between the log concentration and the threshold cycles. The amplification efficiency calculated for the uid gene (generic E.coli, E.coli O157) and 23SrDNA (enterococci) assays based on the slopes of the curves -3.22, -3.39 and -3.34 were 104%, 97%, 99% respectively.
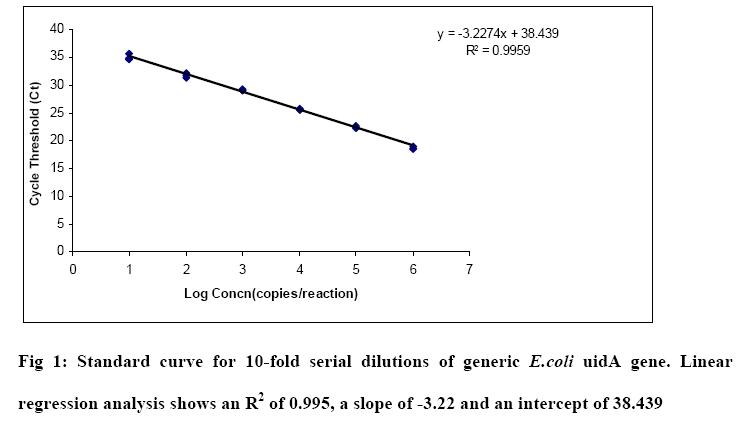

Further evaluation such as specificity and sensitivity testing, recovery of the targets from surface and groundwater samples will be performed for the E.coli and E.coli O157 assays.
2) Comparison of E.coli and enterococci concentrations in various sources of fecal contamination by cultivation and qPCR based methods:
Monitoring water quality is becoming an important issue and requires fast results in order to contain the use of contaminated water use. Current cultivation methods require atleast 18-24 hours to obtain the results and also have the risks of not detecting the non-cultivable forms of E.coli and enterococci. Molecular methods such as qPCR not only give quick results but also can detect the non-cultivable forms of organisms. Inorder to evaluate the applicability of qPCR in detecting fecal indicator organisms or pathogens, a comparison with standard methods such as cultivation is needed. Such comparisons of methods have been made on recreational waters using the fecal indicator organism, enterococci (Haughland, 2005). Our objective is to compare the qPCR method with cultivation methods by quantifying E.coli and enterococci in various sources of fecal contamination such as raw sewage, animal feces, septages and also from surface waters. In this report, we have summarized the results obtained so far for raw sewage and cow fecal samples.
Samples:
a) Raw sewage samples (50ml) in duplicates were collected from Waste Water Treatment Plant (WWTP) at East Lansing, MI once a month for a period of one year by following the aseptic techniques. One set of sample was used for microbiological analyses of E.coli and enterococci and another set was used for qPCR analyses. For microbiological analyses, EPA method 1603 and 1600 which is the Membrane Filtration method for enumerating viable E.coli and Enterococci were used. Serial dilutions of the raw sewage (10-1 through 10-5) were made and one ml from these dilutions was filtered through 47-mm diameter, 0.45 mm pore size, membrane filters. The filters were placed on mTEC agar and mEI agar plates. The mTEC agar plates were incubated for 2 hours at 37oC, followed by incubation in water bath at 44oC for 18-24 h and mEI plates were incubated for 24 h at 41oC following which colonies were counted. The concentrations of E.coli and enterococci were reported as colony forming units (cfu) per 100ml. Another set of sample was processed for qPCR analyses. The sample was centrifuged at 5000rpm for 20 minutes and DNA extraction was then carried out using the QIAmp DNA mini kit (Valencia, CA, USA). Final extracted DNA volume was 200 μl.
b) Fecal samples were collected from individual cows from a cattle dairy farm at Michigan State University. One milligram of feces was weighed and serially diluted (10-1 through 10-5) and the membrane filtration was performed following the same method as described for raw sewage samples. The final concentration of E.coli and enterococci was reported as cfu/gram of wet feces. From each fecal sample collected, 200mg of the feces was weighed in microfuge tubes and DNA was extracted directly by using QIAamp DNA Stool Mini Kit. Protocol for isolation of DNA from Stool for Pathogen Detection was followed for extraction and the final extracted DNA volume was 200 μl. DNA samples were stored at -20oC until further analysis by qPCR.
E.coli and enterococci qPCR for samples:
DNA samples extracted from raw sewage and cow feces were analyzed by qPCR for E.coli and enterococci. QPCR analysis for samples was performed using the same reaction mix components and cycling conditions as used for the plasmid standard curves. Five micolitres of sample DNA was used as the template. The reaction was performed in duplicates for samples and negative controls were included. The copies of uidA gene and 23SrDNA genes present in the sample were quantified from the standard curves obtained earlier. The copies of the corresponding genes were converted to cell equivalents; incase of E.coli, since only one copy of uidA gene is present in a cell, one copy number corresponds to one cell. But in case of enterococci, there are four copies of 23SrDNA present in a cell, therefore four copies in enterococci qPCR assay corresponds to one cell. All the final concentrations for qPCR analyses were reported as cells/100ml for raw sewage and cells/gram for fecal samples after conversion of copy numbers to cells (AppliedBiosystems, 1997).
Results:
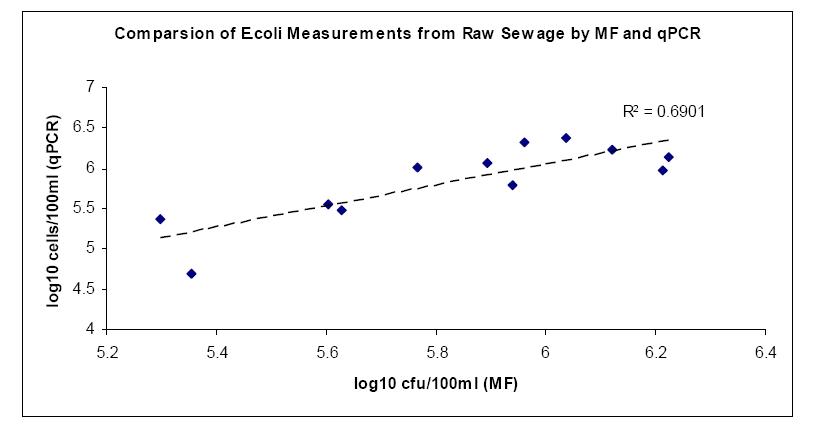
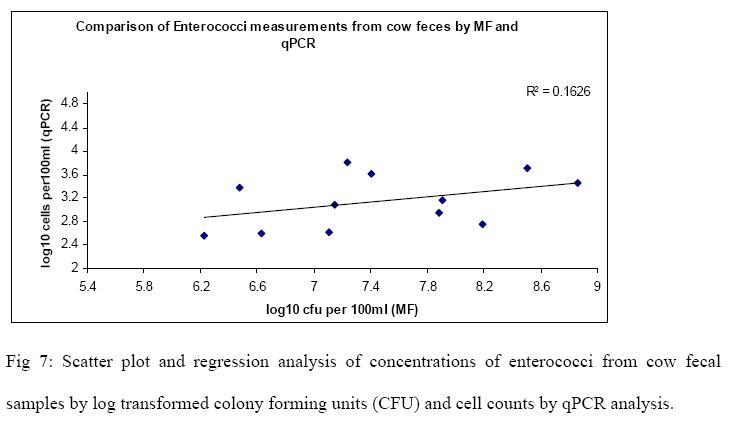
Raw sewage and cow fecal samples were analyzed for E.coli and enterococci by cultivation and qPCR methods. The mean and standard deviations for the log concentrations of indicators for both methods on two samples are summarized in Table 2. Scatter-plot and regression analysis of the results are shown in Fig 4, 5, 6 & 7. A strong correlation was observed between membranefiltration and qPCR methods for E.coli concentrations in raw sewage with r=0.83 (P < 0.05) and not much difference was observed between their means. For enterococci concentrations in rawsewage, there was 0.4 log difference between the concentrations obtained by MF and qPCR and a correlation was observed between the two methods with r=0.65 (P < 0.05). On the other hand, there was a 2.3 log difference between mean concentrations of E.coli cow fecal samples by both methods. But the correlation was found to be strong between the two detection methods with r=0.81(P < 0.05). However, in cow fecal samples the mean log concentration of enterococci by membrane filtration was 4.3 log higher than that of qPCR method and there was a weak correlation between the two methods with r=0.40 (P > 0.05).
Table 2: Mean and Standard Deviations for the log10 transformed concentrations of E. Coli and Entercocci


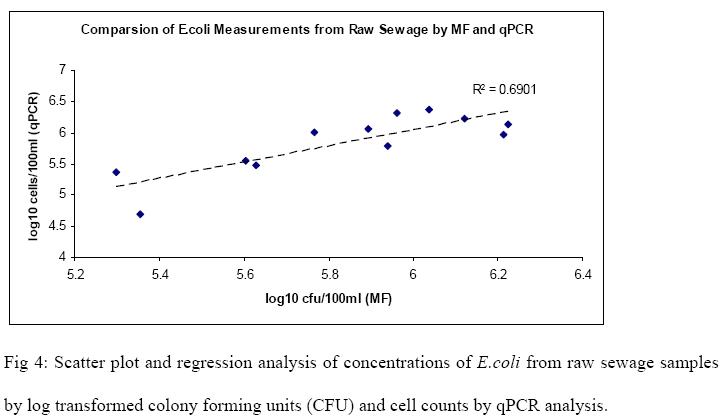
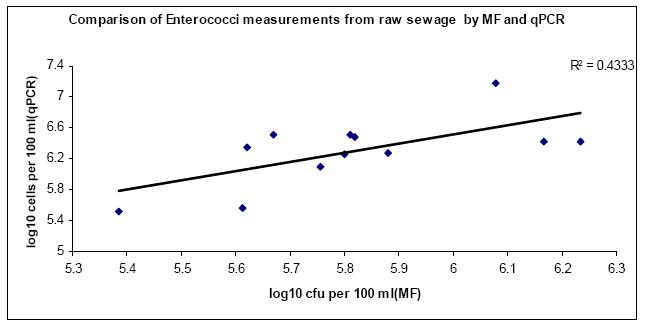
Fig 5: Scatter plot and regression analysis of concentrations of Enterococci from raw sewage samples by log transformed colony forming units (CFU) and cell counts by qPCR analysis

The results indicate that there is a need to evaluate our qPCR assays as well as the DNA extraction procedure especially from cow fecal samples in order to address the large difference in the qPCR concentrations as compared to the cultivation methods. There is also a possibility of large amount of inhibitors in these samples. Another reason could be reduced recovery during the extraction process. These will be evaluated further and comparisons of cultivation and qPCR methods will be carried out with other sources of fecal contamination as well as water samples.
Appendix 2: Biosensor Component
Nano-Wired Biosensor for E. coli in Surface Water
The objective of this section of the project is to assess the performance of the biosensor for sensitivity, specificity, recovery, and false positives/negatives of detection and enumeration for E. coli O157:H7 and H. pylori in groundwater samples from the field. Optimization of the testing protocol for the sensor was completed as well as viability, specificity, and sensitivity testing. Testing using seeded environmental samples was started.
A water-soluble polyaniline is synthesized by following a standard procedure of oxidative polymerization of aniline monomer in the presence of ammonium persulfate(Sergeyeva 1996). Magnetic nanoparticles made of Fe2O3 are formed (Pal, 2008) and coated in polyaniline and 150 g/ml concentration of monoclonal antibodies in order to bind and concentrate bacteria in samples before they are applied to the test strip. After the bacteria binds to the particles and the supernatant is discarded, the antibody-magnetic particle-bacteria complex is diluted in a small volume of buffer in order to make the complex fluid enough to flow through the biosensor strips. A concentration of 500 g/ml of the purified polyclonal (secondary) antibody is immobilized on a nitrocellulose (NC) capture pad. The cellulose membrane for the absorption and application pads are washed with distilled water three times to remove dirt and surface residues, then left to dry and stored inside a Petri dish to maintain a clean surface. All prepared pads are arranged and attached onto an etched copper wafer using double-sided tape. The etched copper wafer serves as the platform to connect the biosensor to a multimeter. The multimeter is used for measuring and recording the resistance drop across the electrodes. Before applying the sample onto the application pad, the resistance is noted. Measurements are taken every 2 minutes over a 6 minute time period after sample application. The relationship between the antigen concentration and the resistance drop is then analyzed. A cutoff value was established for determining a positive reading. A sample was considered positive if the average for that sample was a 30% reduction from the average for a reading of the negative control. The presence of antigen is confirmed by the standard plating or isolation method. The readings are then normalized to determine the signal to noise ratio, with the negative control being equal to 1.0.
1) Protocol Optimization
Optimization testing was conducted on the volume of solution run through the biosensor as well as the concentration of sample in the final tested solution. Tests were run using the same sample solution with a volume of 100 and 150 μl. It was observed that at 150 μl the sample overflowed on the application membrane preventing the required lateral flow through the sensor. Previous testing had shown that volumes of less than 100 μl resulted in the solution not completing its flow through the sensor. Results from optimal volume testing can be seen in Figures 1 and 2. The optimal volume for testing was found to be at 100 μl.
Testing was conducted where varying ratios of sample and water were combined with the polyaniline nanoparticles to determine the optimum concentration of sample in the tested solution. The tested ratios were 1 ml sample: 4 ml sterile water, 3 ml sample: 2 ml sterile water, and 5 ml sample. The results can be seen in Figures 3 and 4. The optimal ratio of sample to water was found to be the combination of 3 ml of sample mixed with 2 ml of sterile water.
2) Viability Testing
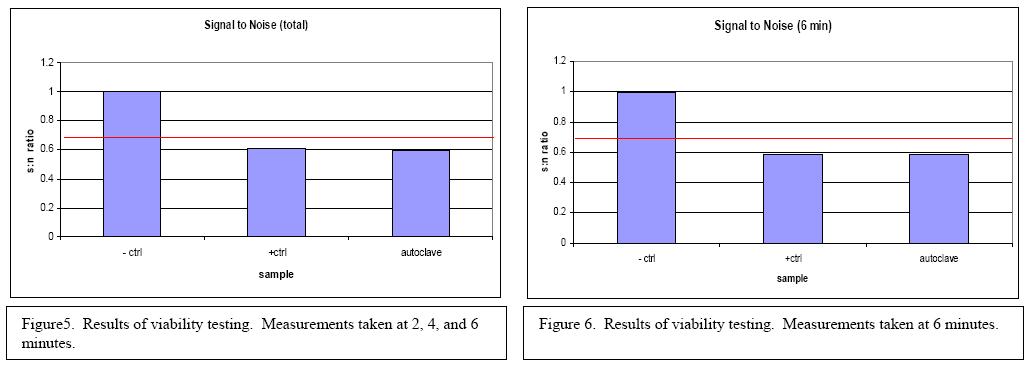
Experiments were performed to determine if the sensor could differentiate between living (viable) and dead (non-viable) E. coli O157:H7. A negative control sample of sterilized water, a positive control of bacteria in growth media, and a sample of bacteria in growth media that had been killed in the autoclave were tested. The results can be seen in Figures 5 and 6. Based on the results it was determined that the biosensor can not differentiate between viable and nonviable bacteria in samples.
3) Specificity Testing
Testing was conducted to see if the biosensor is specific for only E. coli O157:H7. The sensor was tested with pure culture of 6 different types of bacteria: Staphyloccus Aureus, Enterococcus sp., Enterobacteriaceae sp., Salmonella sp., Pseudomonas sp., and Shigella sp. The results can be seen in Figures 7 and 8. None of the bacterial pure cultures tested positive using the biosensor. The biosensor therefore can be considered specific for E. coli O157:H7.
4) Sensitivity Testing
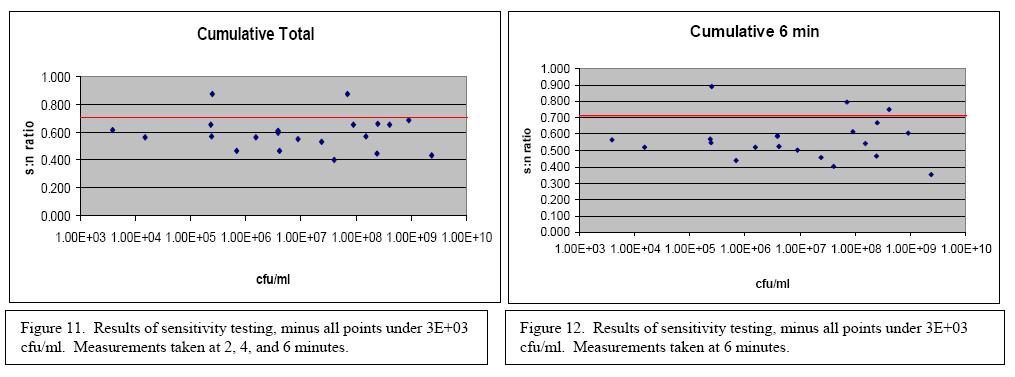
Testing was conducted to determine the sensitivity of the biosensor with bacteria in pure culture. The results can be seen in Figures 9 and 10. Out of 31 tested concentrations at 2 minutes, 4 minutes, and 6 minutes the biosensor produced a positive result 71% percent of the time. Looking at the readings from only at the 6 minute mark, out of 31 samples 67.7% tested positive. If all of the data points corresponding to a concentration of less than 3x10³ cfu/ml are removed then the percent positive at 2, 4, and 6 minutes becomes 90.9% and at only 6 minutes becomes 86.4%. These results can be seen in Figures 11 and 12. Based on this information the biosensor has been determined to have a sensitivity of 3x10³ cfu/ml.
5) Seeded and Environmental Sample Testing
Testing has begun on seeded water samples. One liter environmental water samples that were negative for E. coli O157:H7 were seeded with stock culture of the bacteria. These samples were then processed and tested using the biosensor. The results of these initial tests can be seen in Figures 13 and 14. In this initial test all three positive samples tested positive. This indicates that the biosensor will be effective in the more complex matrix of environmental waters, however more testing is necessary.
Future Activities:
1. Complete more tests with seeded environmental water samples.
2. Complete tests using environmental water samples.
3. Optimize biosensor using a new, more stable electrode with a longer shelf life.


Appendix 3: Viability Assay Component
Rapid Detection System for Viable E. coli in Surface Water
Initial testing has been completed to optimize a commercially available assay for bacterial viability with very promising results. Testing to assess effectiveness of developed viability assay in predicition of contamination in surface water samples was completed. Currently employed viability testing methods had greater numbers of positive results when compared to the standard methods; likely due to the fact that the new assay is not specific for Escherichia coli, but is believed to be indicative of live fecal coliform contamination in samples. Because originally developed viability testing methods are not specific for Escherichia coli; therefore we have begun a second phase to assess methods to isolate E. coli O157:H7 from other bacterial contaminants via antibody binding prior to viability testing. Testing to assess developed viability assay’s cross-reactivity and specicifity for Escherichia coli was also completed.
Pure culture of E. coli C3000 (ATCC #15597), a non-pathogenic surrogate strain for E. coli O157:H7, was grown in Mueller Hinton (MH) Broth II (BD Cat# 297963) over a 24-hour period to ensure maximal growth potential. Culture samples were centrifuged after 24 hours and resuspended in sterile peptone water. A concentration step via centrifugation was introduced to increase initial bacterial counts prior to antibody separation.
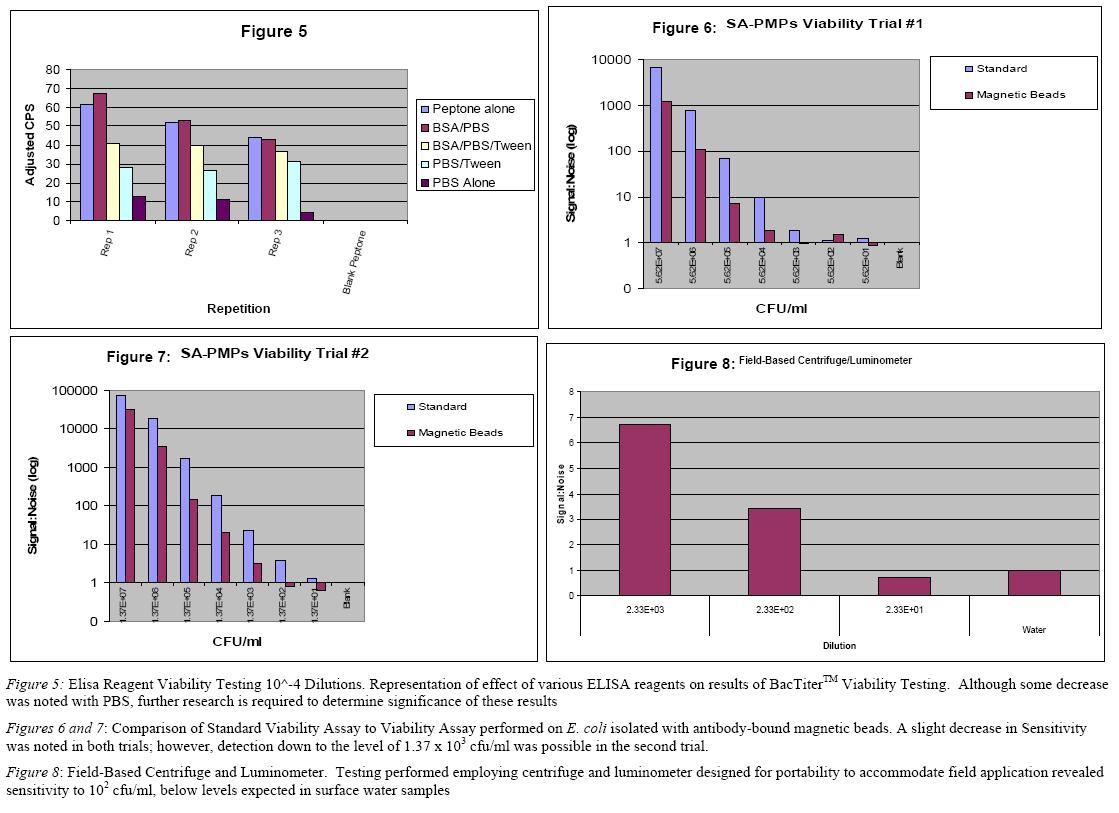
The BacTiterTM Microbial Cell Viability Assayi (Promega Cat#C8230) was optimized and performed on serial dilutions to estimate detection efficacy of viability detection of small concentrations of bacteria. Optimization focused on comparison of luminescent readers, serial dilution methods and incubation times. The Berthold Sirius Single Tube Luminometer was compared to the Perkin Elmer VictorTM Plate Reader. Because the VictorTM has a 96 sample capacity and allows the user to program incubation on the instrument, it was employed for all later testing. Ease of use, electronic data collection, and reliability were also considerations. Serial dilutions with Trypticase soy broth (TSB, BD Cat# 211825), MH Broth, and peptone water were compared to minimize background luminescence, thereby increasing assay sensitivity (Figures 1 and 2). Dilution with peptone water and MH broth provided comparable results and peptone water was chosen for further experiments based on financial considerations. Incubation times of 5, 10, and 15 minutes were compared to determine if sensitivity or specificity were significantly affected by time (Figure 3). Although the differences were significant, 5 min was used for additional studies based on the slight decrease in sensitivity over time. Plate counts of the serial dilutions compared with viability assay results revealed a reproducible sensitivity of 101-102 cfu/ml via the BacTiterTM assay (Figure 4).
A simple, antibody based, isolation method has been optimized to separate E. coli and related enterobacteriae from other bacterial contaminants in surface water prior to viability testing. A goat-derived, polyclonal, biotinylated antibody (Meridian Life Sciences, Cat# B65109B) raised against a mixture of E. coli serotypes was incubated for thirty minutes with Magna-Sphere streptavidin-coated magnetic beads (Promega Cat # Z5481), allowing the exploitation of a natural and strong association between biotin and streptavidin to create a complex. The antibody-magnetic bead mixture was then incubated for ten minutes to allow bacterial binding. Bound bacteria were then separated from the water matrix with a powerful magnet and rinsed with type I reagent water prior to viability testing. Although this step increased specificity, a decrease in sensitivity was also noted (Figures 6 and 7), although this decrease is not expected to hinder results from the field. This method will also be combined with an antibody specific for E. coli 0157:H7 to develop a strain-specific test with lesser crossreactivity.
A portable centrifuge and luminometer were acquired and tested in the laboratory setting to mimic instrumentation conditions expected in the field. Results revealed sensitivity levels inthe range of the low 102 cfu/ml (Figure 9).
Samples collected from identical sites one week apart, July 28, 2008 (week 1) and August 4, 2008 (week 2), were tested in parallel to compare effects of storage at 4oC for a period of one week. Samples collected on July 28, 2008 and stored until August 5, 2008 showed a marked decrease in measurable viability when compared to samples collected on August 4, 2008 and tested within 24 hours. Signal:noise readings for week 2 approximated cfu/ml levels for each sample; readings were much lower for week 1 (Figures 10 and 11). Both sample cohorts were cultured immediately after collection.
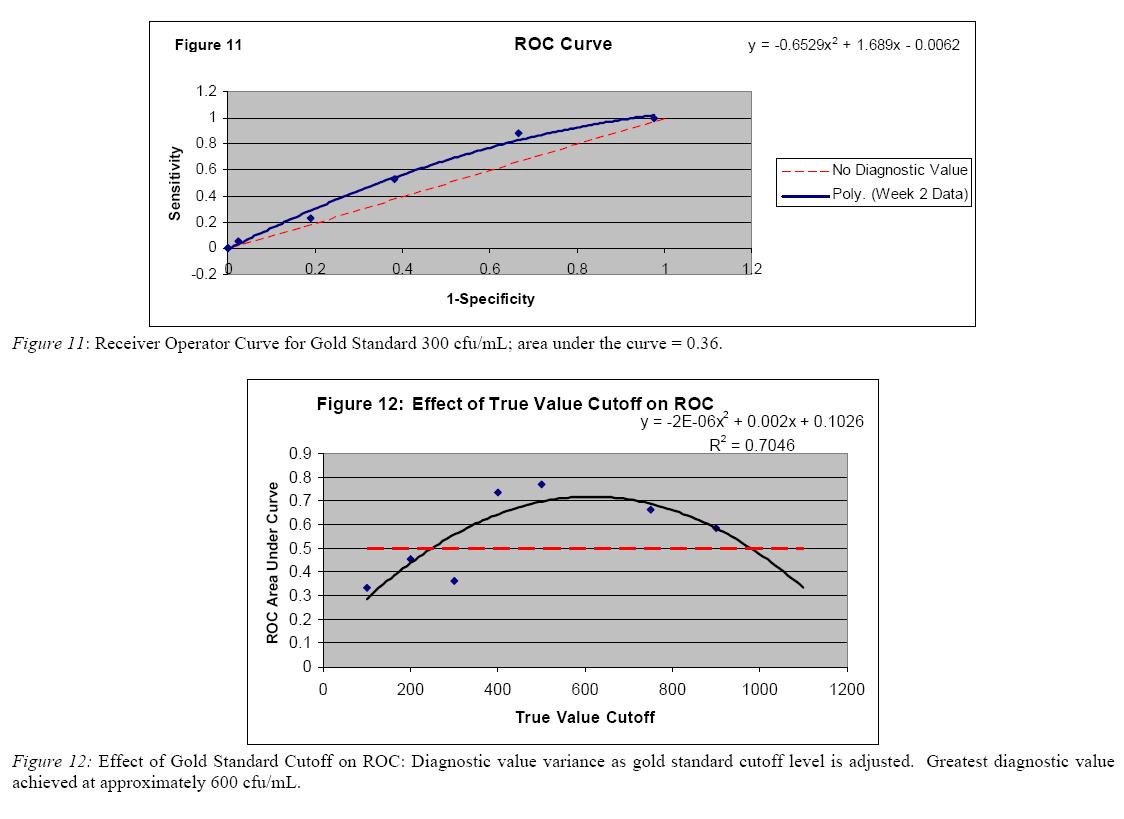
Sixty river surface water samples obtained from Ingham County Health Department were analyzed to assess the diagnostic value of the viability assay. A receiver operator curve (ROC) analysis was performed using the gold standard as determined by Ingham County Health Department Data. Here, for the gold standard, samples less than 300 cfu/mL were considered negative and those equal to or greater than 300 were positive. The resulting ROC curve found the little value in the viability assay, as the area under the curve was only 0.36 (figure 12). Further analysis was performed to determine the diagnostic value of the viability assay in determining positivity indicated by greater or lesser cutoffs of cfu/mL. The greatest diagnostic value of the assay was noted when the gold standard cutoff was set to approximately 600 cfu/mL; the area under the curve achieved here was approximately 0.76 (figure 13). Additional assessment also noted that the cutoff level of 300 cfu/mL resulted in 6 sampling sites with contradicting results depending on sampling location (left, center or right) (figure 14). If a 600 cfu/mL cutoff were applied, the number of contradicting site would be reduced to one; however, as expected, a number of previously positive results would be reported as negative.
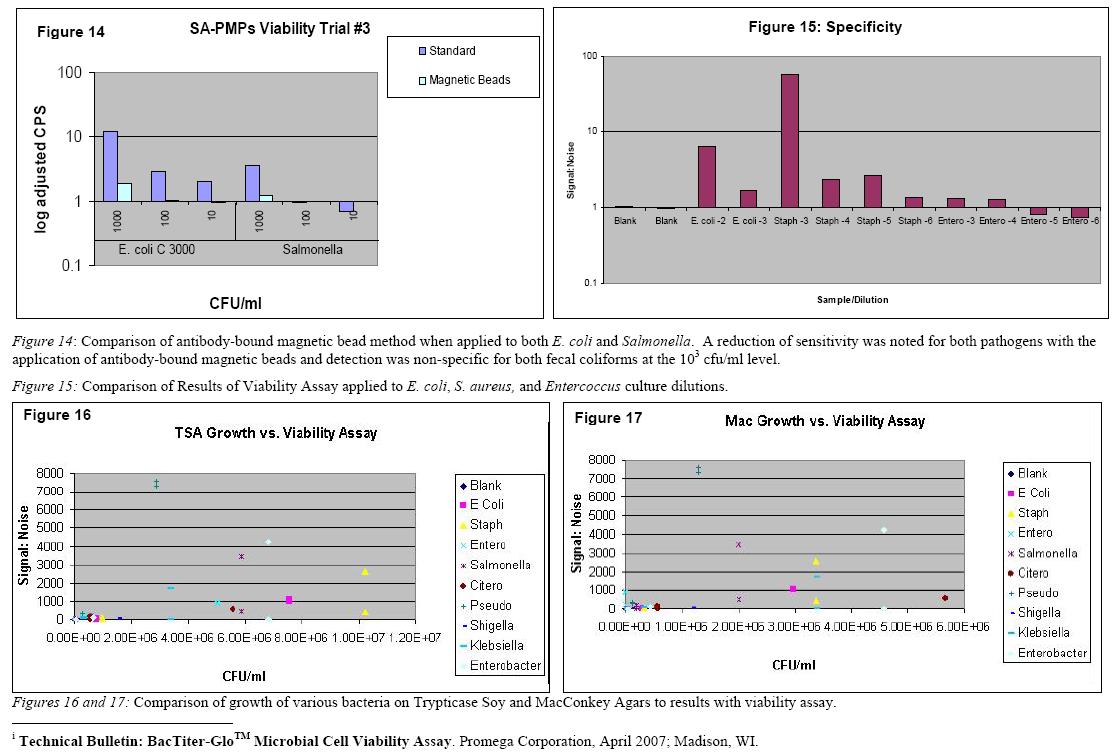
A total of eight known bacterial species, ranging in degree of similarity to target species, were tested using developed viability assay’s previously tested protocol. Although use of magnetic beads for separation improved specificity of the assay when tested with Salmonella, a decrease in sensitivity for E. coli was also noted (Figure 14). These tested species included Staphyloccus Aureus, Enterococcus sp., Enterobacteriaceae sp., Salmonella sp., Pseudomonas sp., Shigella sp., Klebsiella sp., and Citerobacter sp.. All of the eight species showed marked levels of cross-reactivity with developed assay (Figures 15, 16 and 17). Four of the species tested, Staphyloccus Aureus, Enterobacteriaceae, Salmonella, and Pseudomonas, displayed higher reactivity than Escherichia coli to developed assay. The high level of cross-reactivity of developed assay to species of bacteria other than the target is most likely a result of the currently employed antibody’s lack of binding specificity for Escherichia coli.


Future Activities:
qPCR:
We are currently preparing a publication on the qPCR indicator studies. We will also begin characterizing the occurrence of 0157 in sewage and manure along with E.coli and Enterococci as indicators with qPCR.
Biosensor:
1. Complete more tests with seeded environmental water samples.
2. Complete tests using environmental water samples.
3. Optimize biosensor using a new, more stable electrode with a longer shelf life.
Viability assay:
1. Continued investigation into the replacement of currently employed biotinylated antibody with a more effective method of isolating E. coli from other bacterial contaminants prior to viability testing, in order to decrease cross-reactivity of developed assay.
2. Optimization of the sensitivity and specificity determination of a strain-specific assay to detect viable E. coli O157:H7 in surface water samples combining previously tested protocol with monoclonal antibodies.
3. Optimization of strain-specific assay in surface water samples and statistical comparison of results to those from diagnostic gold standard, pure culture.
References:
Applied Biosystems, 1997. User Bulletin #2. ABI PRISM 7700 Sequence Detection System. Applied Biosystems Corporation, Foster City, CA.
Boyce, T. G., D. L. Swerdlow, and P. M. Griffin. 1995. Current concepts: Escherichia coli O157:H7 and the hemolytic-uremic syndrome. N. Engl. J. Med. 333:364-368 Doyle MP, Beuchat LR, Montville TJ. Food Microbiology: Fundamentals and Frontiers. 2nd ed. pp. 171-191, ASM Press, Washington DC, 2001
Fredricks, D. N., and D. A. Relman. 1999. Application of polymerase chain reaction to the diagnosis of infectious diseases. Clin. Infect. Dis. 29:475–486.
Haugland, RA; Siefring, SC; Wymer, LJ; Brenner, KP; Dufour, AP. 2005. Comparison of Enterococcus measurements in freshwater at two recreational beaches by quantitative polymerase chain reaction and membrane filter culture analysis. Water Res. ;39(4):559–568.
Juhna, T., D. Birzniece, and J. Rubulis. 2007. Effect of phosphorus on survival of Escherichia coli in drinking water biofilms. Appl. Environ. Microbiol. 73: 3755–3758.
Kolling, G. L., and K. R. Matthews. 2001. Examination of recovery in vitro and in vivo of nonculturable Escherichia coli O157:H7. Appl. Environ. Microbiol. 67: 3928–3933.
Manning, S. D., A. S. Motiwala, A. C. Springman, W. Qi, D. W. Lacher, L. M. Ouellette, J. M.Mladonicky, P. Somsel, J. T. Rudrik, S. D. Dietrich, W. Zhang, D. Alland, and T. S. Whittam. 2008. Variation in virulence among clades of Escherichia coli O157:H7 associated with disease outbreaks. Proc. Natl. Acad. Sci. USA 105:4868-4873
Mizunoe, Y., S. N. Wai, A. Takade, and S.Yoshida. 1999. Restoration of culturability of starvation-stressed and low-temperature-stressed Escherichia coli O157 cells by using H2O2- degrading compounds. Arch. Microbiol. 172:63–67.
Monday, S.R., T.S. Whittam and P.C.H. Feng. 2001 Genetic and evolutionary analysis of mutations in the gusA gene that cause the absence of β-Glucuronidase activity in Escherichia coli O157:H7. J Infect Dis 184, pp. 918–921
Pal, S., Ying, W., Alocilja, E.C., Downes, F.P. Sensitivity and specificity performance of a direct-charge transfer biosensor for detecting Bacillus cereus in selected food matrices. Biosystems Engineering 2008; 99 461-468.
Sergeyeva TA, Piletskii SA, Rachkov AE, El’Skaya AV. Polyaniline label-based conductometric sensor for IgG detection. Sensors and Actuators 1996; B 34:283-288
Journal Articles on this Report : 3 Displayed | Download in RIS Format
| Other project views: | All 11 publications | 4 publications in selected types | All 3 journal articles |
|---|
| Type | Citation | ||
|---|---|---|---|
|
|
Liu, Y., Charrabartty, S. Alocilja, A. (2007). "Fundamental Building Blocks for Molecular Bioware Based Forward error-correcting Biosensors." Nanotechnology:424017. |
R833005 (2008) |
not available |
|
|
Nayak AK, Rose JB. Detection of Helicobacter pylori in sewage and water using a new quantitative PCR method with SYBR green. Journal of Applied Microbiology 2007;103(5):1931-1941. |
R833005 (2007) R833005 (2008) |
|
|
|
Yuk JS, Jin J-H, Alocilja EC, Rose JB. Performance enhancement of polyaniline-based polymeric wire biosensor. Biosensors and Bioelectronics 2009;24(5):1348-1352. |
R833005 (2008) |
Exit Exit |
Supplemental Keywords:
Sustainable Industry/Business, RFA, Scientific Discipline, INTERNATIONAL COOPERATION, TREATMENT/CONTROL, Water, POLLUTANTS/TOXICS, Technology for Sustainable Environment, Sustainable Environment, Microorganisms, Drinking Water, Environmental Engineering, Environmental Monitoring, Technology, biosensors, E. Coli, Helicobacter pylori, biotechnology, biosensor, pathogens, nanotechnology, drinking water monitoringProgress and Final Reports:
Original AbstractThe perspectives, information and conclusions conveyed in research project abstracts, progress reports, final reports, journal abstracts and journal publications convey the viewpoints of the principal investigator and may not represent the views and policies of ORD and EPA. Conclusions drawn by the principal investigators have not been reviewed by the Agency.