
Grantee Research Project Results
2007 Progress Report: Robust Piezoelectric-Excited Millimeter-sized Cantilever Sensors for Detecting Pathogens in Drinking Water at 1 cell/Liter
EPA Grant Number: R833007Title: Robust Piezoelectric-Excited Millimeter-sized Cantilever Sensors for Detecting Pathogens in Drinking Water at 1 cell/Liter
Investigators: Mutharasan, R.
Institution: Drexel University
EPA Project Officer: Aja, Hayley
Project Period: October 1, 2006 through September 30, 2009 (Extended to August 31, 2011)
Project Period Covered by this Report: October 1, 2006 through September 30,2007
Project Amount: $562,215
RFA: Development and Evaluation of Innovative Approaches for the Quantitative Assessment of Pathogens in Drinking Water (2005) RFA Text | Recipients Lists
Research Category: Nanotechnology , Drinking Water , Water
Objective:
The goal of proposed research is to develop antibody-immobilized piezoelectric-excited millimeter-sized mechanically robust cantilever sensors (PEMC) for detecting pathogenic agents (PA) Cryptosporidium and Giardia in drinking water and source waters without a concentration or filtration step. The project has three main objectives. These are: (1) Explore and establish experimentally piezoelectric-actuated millimeter-sized cantilever sensor suitable for detecting one pathogen in one liter of water using new cantilever oscillation and measurement modalities. The goal is to obtain higher resonance frequencies so that sensitive detection can be made (2) Develop flow cell- PEMC sensor detection assembly for testing sample volumes of 10-100 liters. The goal is to contact large-volume samples directly with the sensor instead of filtering and then testing. Characterize response of sensor to samples containing known number of Cryptosporidium and Giardia cells. Use E. coli O157:H7 as surrogate pathogen in methods development. (3) Develop PEMC sensor for confirming pathogen identity by its DNA signature. Immobilize known 38-mer oligo (Gene Bank: L16997) and use DNA extracted from PEMC collected cells to verify the identity of pathogen (Cryptosporidium). The goal is to augment the primary antibody-based detection with DNA-based confirmation so that false readings could be reduced or eliminated. The following fourth objective was added (3/30/2006) in response to review panel comments. (4) Evaluate detection method developed in objectives 2 and 3 in real matrix, river or source water.
Progress Summary:
1.0 Interim Results
During the Year I of the project centered on Objective 1 (sensor) and the large volume samples (Objective 2). Preliminary work was initiated on Objectives 3 and 4.
Key results achieved to date are:
- A number of sensor designs were fabricated and tested. Certain designs exhibited resonance modes at high frequencies (~ 1 MHz) that show sensitivity at femtogram levels in liquid samples. Sensor design parameters were determined using finite element simulation. Our modeling work confirming earlier experimental finding of high sensitivity of the first two resonance modes was recently submitted to Sensors and Actuators B1.
- Initial tests with E. coli O157:H7 with the new sensor design with one liter samples containing 1 pathogen/mL concentration gave successful results which were recently reported in Environmental Science & Technology2. We also determined the behavior of various resonance modes in this publication. Importantly, a new measurement method - high flow rate followed by stoppage of flow for sensor measurement - yielded excellent detection response. We expect to use this approach for the 10-100 liter samples.
- Initial experiments with small volume samples of Cryptosporidium parvum oocysts show good sensitivity at 100 per mL. Response indicates that one /mL would be detectable. A manuscript has been submitted to Biosensors and Bioelectronics and is under review3.
- In addressing Objective 4, we have initiated tests with river water samples (Schuylkill River; source of drinking water for one-third of the city of Philadelphia) to scope out experimental logistics for large sample volumes (10- 100 liters) and for design of experiments Year 2.
- Method of conducting DNA-based detection was initiated in preparation for Objective 3. Successful tests with synthetic DNA strands have been conducted that show sensitivity of detecting 1 femtomolar of a 10-base sequence. We recently reported our initial work in this area in Analytical Chemistry4.
2.0 Summary of Progress on Objective 1. [Key Result #1]
In the current investigation, the cantilever free end has PZT dimensions of 1 x 1 x 0.127 mm (length x width x thickness) and the glass layer was 2.5 x 1 x 0.160 mm. Since the PZT layer was bonded to the base glass layer only 1.5 mm length of glass was available for immobilization. To prevent short circuit upon submerging the PEMC sensor into liquid the exposed PZT layer (1mm long) was coated with a thin layer of polyurethane (~ 15 μm). Resonance characteristics of PEMC sensor design can be seen in Figure 1 as a plot of phase angle versus excitation frequency.
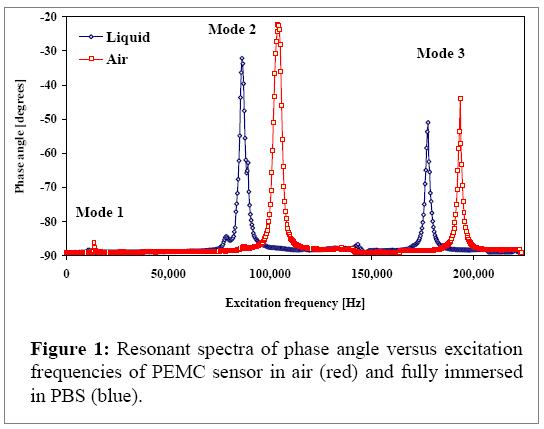
At resonance, there is a shape change as PZT becomes more resistive as increased charge accumulation occurs due to higher than normal mechanical stress. Of note is the achievement of resonance modes beyond 100 kHz. (The goal of Objective 1 as stated in the original proposal was to achieve 250 kHz.) The fundamental mode, second, and third harmonic resonant frequencies in air were 13.5, 104.3, and 193.5 kHz, respectively. Upon submerging the sensor in PBS, the resonant frequencies decreased to 11.3, 86.3, and 177.8 kHz, respectively. The sharpness of the peak is indicated by the quality factor (Q). The Qfactor for the first, second, and third modes were, respectively, 36, 23, and 86 in air, and 30, 26, and 67 in PBS. Note that the Q-value decreases by about 20% upon liquid immersion, as the peak phase angle decreases.
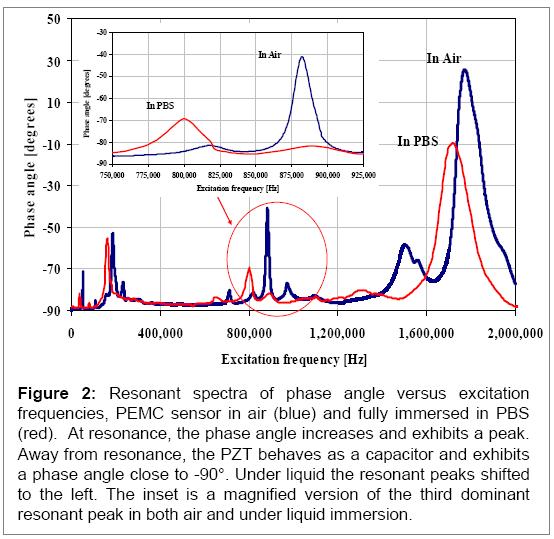
As one notes in Figure 2, there is almost no shape change of the phase angle behavior near resonance. This is an important advantage with PEMC sensors as high Qvalues are obtained in liquids. We used the third mode at 177.8 kHz for detection experiments, as the quality factor remained high (67) under liquid immersion. This is in contrast to our previous work that were obtained at less than 100 kHz5, 6.
Second set of designs were made in which the PZT layer was anchored and the glass layer was not. This gave rise to even higher modes that were quite dominant. An example spectrum is shown in Figure 2. We have examined the mass change sensitivity of the mode near 1 MHz using dilute wax additions and find it to show sensitivity for detecting 1 to 50 femtograms (one femtogram is 1E-15 g). Since an E. coli cell weighs ~1 picogram (1E-12 g), binding of a single cell should be detectable by the PEMC sensor. Cryptosporidium and Giardia are larger and thus their attachment should induce large responses. We first show detection characteristics for E. coli O157:H7, and then for Cryptosporidium. Giardia experiments are on going.
3.0 Summary of Progress on Objective 2. [Key Results #2 and #3]
3.1. Initial results with Cryptosporidium parvum oocysts. [Key Result #3]
In this initial study prior to examining large volume (>1 liter) samples, fabricated PEMC sensors that were immobilized with antibody (IgM) against Cryptosporidium parvum oocysts were exposed to samples containing the oocysts at concentrations of 100, 1000 and 10,000 oocysts/mL. Sample result (Figure 3) shows the entire frequency response of a typical detection experiment.
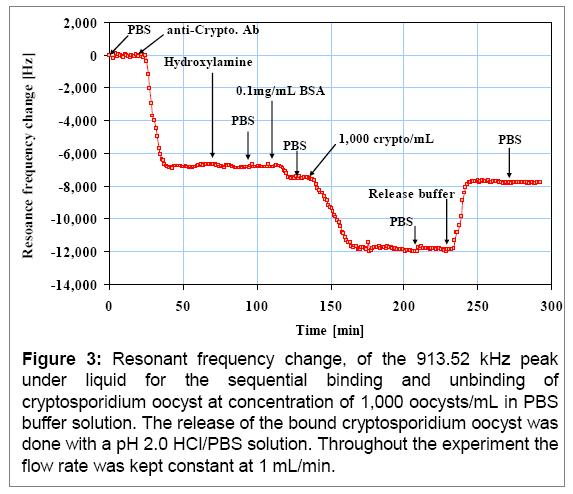
Each detection experiment was repeated at least thrice. Referring to Figure 3, upon stabilization of the aminofunctionalized sensor (running buffer PBS at 1 mL/min) anti-Cryptosporidium parvum oocysts IgM (0.01 mg/mL) was introduced for immobilization. Immobilization took ~45 minutes and a total frequency change of 6,840 Hz is observed. After recovering activated carboxylic groups with hydroxylamine, bovine serum albumin (BSA) was introduced as a blocking agent which caused a 720 Hz response. BSA is a small protein (~67 kD) compared to IgM (750 kD) that can fill the empty spaces between neighboring antibody molecules and thus, prevent and/or minimize nonspecific binding on sensor surface. Subsequent exposure to Cryptosporidium oocyst at 1,000 oocysts/mL resulted in a rapid decrease in the resonance frequency (4,420 Hz ) followed by a slower approach to steady state. Because the sensor had a stable response prior to the Cryptosporidium oocyst exposure, we conclude that the frequency change observed was due to the attached mass of the Cryptosporidium as they were bound to the antibody on the sensor surface. The PBS rinse that follows showed no change in resonance frequency value indicating any weak binding of any Cryptosporidium to sensor surface was absent. In each experiment, after the completion of Cryptosporidium detection the system was rinsed with PBS buffer followed by introducing a pH 2.0 release solution, and finally PBS was re-introduced to return the sensor to the same liquid environment that was present prior to the Cryptosporidium parvum oocyst introduction. The return to original resonance frequency is a measure of quality of the sensor and the experiment. In Fig 3, upon introducing the release solution, sensor responded immediately by a rapid increase in resonance frequency of 4,210 Hz which is ~ 210 Hz less than that of the detection response. The difference of 210 Hz compared to the detection response of 4420 Hz is ~5 % and is just at the outer end of recovery observed in 12 other experiments which ranged 1 to 4%. We show the release of the bound Cryptosporidium as a confirmation step of detection. In recent experiments we have also used microscopic examination of the sensor post-detection to verify that the sensor response is indeed due to attachments of the target oocysts. We have analyzed several samples and the following is a summary of PEMC sensor response. In the table we also include overall kinetics of sensor response that will be used in flow cell design (Objective 2).
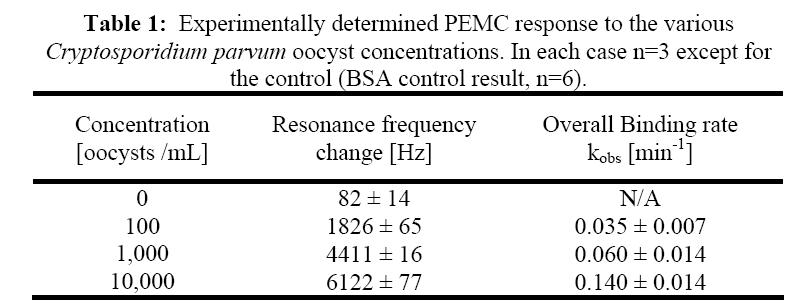
In the current project we are interested in the presence or absence of the target parasite. Thus as long as the sensor response is more than 2 to 3 times the observed noise in measurement, one can infer the presence of Cryptosporidium. Thus, in the current apparatus, the noise level is ~50 Hz, and a frequency decrease of 150 Hz could be conservatively be interpreted as a positive detection of the parasite. Although experiments have not yet been conducted to test the lower detection limit, the responses summarized in Table 1 suggest that the presence of 1 to 10 oocysts would be measurable. The relationship of sensor response to concentration of Cryptosporidium can be used to determine quantitatively the minimum detection limit. Since the sensor response is given as (-Δf) = A + ln (C0), limit of detection (C0min) can be estimated from the expression exp((3N-A)/B)), where N is the noise level and a detection signal of signal-to-noise ratio of 3 is assumed. For the specific sensor used in this study, C0min is ~ 10 /mL. In the on going experimental study, we will verify this estimate both in clean and river water samples. With regard to dynamic range of the sensor, one can estimate it from the available sensor surface area. Given that an average oocyst is 3 μm, the 1 mm2 sensor would accommodate a maximum of 10 million oocysts, and realistically ~ 1 million if we consider 10% packing density. If capture efficiency of the sensor is ~ 10%, target concentration that would be measurable is ~ 105 per mL with a one mL sample. Therefore, the dynamic range is likely to be 1 to 105 per mL.
We also note that the target oocysts are brought to the sensor surface by the fluid flow and binding to the immobilized IgM occurs subsequently. Thus both flow rate and the relative position of the sensor in the flow field influence sensor response (proposed Objective 2). For example, in a previous study we showed flow rate strongly influences both the kinetics and the steady state response of the sensor7. In the current study these parameters have not been optimized. A higher flow rate of 2 to10 mL/min may lead to a lower detection limit and is currently under study.
3.2. Initial results with large volume samples. [Key Result #2]
We summarize in this section, our first effort of detecting a target pathogen in a one-liter sample, and the response of various resonance modes (Fig 2) to pathogen attachment to the sensor.
Detection experiments with PEMC sensor exhibiting a dominant resonance mode at 800 kHz was freshly prepared with a polyclonal antibody against E. coli O157:H7 (EC) and then was exposed to a 1 L sample of EC at 1 cell/mL at various flow rates (1.5, 2.5, and 3 mL/min) with continuous measurement and at 17 mL/min in flow-stop-measure mode.
The rate of EC binding and the total resonant frequency change Resonant frequency change [Hz] increased with increasing flow rate. The steady state frequency changes for the binding of EC (1 cell/mL) at 1.5, 2.5, and 3 mL/min were 2,230 ± 11, 3,069 ± 47, and 4,686 ± 97 Hz, respectively. The standard deviation indicated is the variation in resonant frequency at steady state over a period of 10 minutes. We note that the time to reach steady state is a weak function of the flow rates used. The steady state frequencies at 1.5, 2.5, and 3 mL/min were achieved in 192, 230, and 290 minutes, respectively. Although this time period seems long, sufficient signal (response-to-noise ratio > 3) was obtained in the first 30 minutes. For example for these three cases, at 30 minutes the responses were -210, -440 and -1020 Hz which are interpreted as positive detection signal as the typical noise level was ~50 Hz at the flow rate used. Since the number of EC cells in each of the sample was the same, we conclude that the increased flow rate improved contact of EC to the sensor. At each flow rate a control experiment was also carried out. The control was an antibody functionalized cantilever exposed to PBS buffer at a flow rate that was the same as in the detection experiment. The control response showed a frequency decrease of 77 ± 81 Hz, which for practical purposes is within the noise level we observed with cantilevers of this design. The change is also insignificant when compared to the frequency response due to EC binding, which is on the order of 1,000 Hz. The results suggest that PEMC sensors have the sensitivity to detect EC at 1 EC/mL in the flow configuration used.
To confirm that the observed sensor response was indeed due to the binding of EC, in each experiment, after completion of the detection segment the flow circuit was rinsed with PBS followed by exposing the sensor to a pH 2.02 solution, and finally PBS was reintroduced to return the sensor to the environment that was present prior to EC attachment.
The flow-stop-measure modality was investigated so that we could examine higher flow rate applications and larger volume samples (10-100 liters). The sensor noise level increases beyond 3 to 4 mL/minute in the apparatus and flow cell we currently use. A new flow cell design (to be completed in Year 2) is likely to enable us to operate at a higher flow rate with low noise.
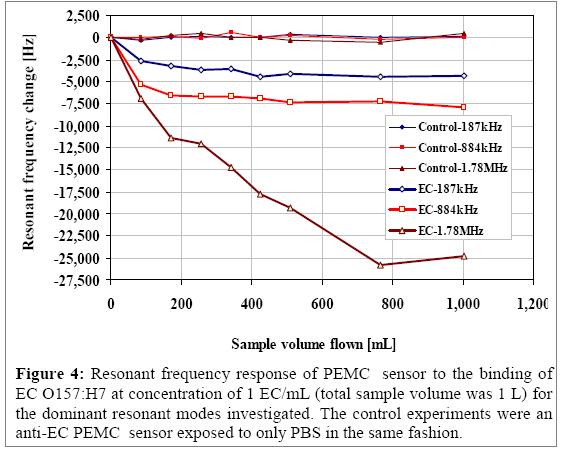
We show the use of multiple resonant peaks in the detection of the pathogen in one liter samples. We note that the sample volume was 1 liter and the EC sample (1 cell/mL) flow rate was at 17 mL/min. We also measured the behavior of the sensor’s three higher-order resonant modes by a constant mass. The primary motivation is that the frequency response will give a measure of the sensitivity of the various peaks. In addition, a non-flow condition ensures that the measured resonant frequency changes were not due to flow effects, and only mass changes caused by EC attachment. In Figure 4 the 162.5, 800.0, and 1,725.5 kHz resonant peaks, under liquid immersion, were used in detection. The plot shows the frequency response of the sensor versus the sample volume that flowed through the flow cell prior to resonant frequency measurement. The sample was flowed for 5 minutes, stopped, and then the resonant frequencies of the three modes were monitored individually until they stabilized, which typically took place in 5 to 10 minutes. This step was repeated until the sample volume was completely pumped through the flow cell. As shown in the figure, the resonant frequencies of the different modes decreased rapidly after the initial 5 minutes of sample flow (sample volume of 85 mL) and ultimately reached a steady state frequency change of 4,340 ± 49, 7,188 ± 52, and 25,850 ± 63 Hz corresponding to the 162.5, 800.0, and 1725.5 kHz resonant modes. The significance of these results is that for the same mass change the various resonant modes responded to different extent. Given that the noise levels were similar, the 1,725.5 kHz mode exhibited the highest sensitivity of the modes examined. Along with each detection experiment a control experiment was also conducted in the same fashion. The control experiment conducted with an antibody-functionalized sensor exposed to PBS buffer yielded resonant frequency values that fluctuated at 56 ± 154, 97 ± 225, and 21 ± 328 Hz for the 162.5, 800.0, and 1,725.5 kHz modes, respectively. If we compare the frequency response presented in Figure 4, for the 800 kHz mode, a larger change in frequency is observed at 17 mL/min, which further confirms that higher flow rate enhances EC attachment. These results suggest that the cantilever is mechanically robust and at the same time very sensitive.
3.3. Initial results with Schuylkill River water samples [Key Result #4]
We have run five one liter raw samples of Schuylkill River samples taken in August 2007. Published reports of Philadelphia Water Co indicate that average Cryptosporidium concentration in the river (measured at their intake) is of the order of 0.5 per liter and is somewhat seasonal. Although details of the measured species were unavailable, we examined the response of the PEMC sensor immobilized with the IgM antibody to Cryptosporidium parvum oocysts to examine if any in the sample would bind. Experiments were run at 3.5 mL/min so that the sensor response could be continuously monitored. No significant response was obtained in the five samples. We have collected another 20 liter samples in September and they are currently being tested. They will be used in preparing spiked samples for detection experiments. In order to examine larger volume samples, experimental design is underway so that the experiment (detection) could be done in situ along the river bank (Year 2).
3.4. Initial results with DNA- detection [Key Result #5]
The following investigation was pursued so that a method is developed prior to examining DNA extracts of Cryptosporidium. Gold-coated PEMC sensors immobilized with 15-mer single stranded DNA (ssDNA; 15-mer oligonucleotide from 16S-rRNA sequence, HS-C6H12-5’-GGAAGAAGCTTGCTT-3’) via the thiol group attachment. Then, 10-mer target of random and unknown sequence the complementary 10-mer target 5’-AAGCAAGCTT-3’ at concentrations of 1 fM, 1 pM and 1 μM, both separately and sequentially at 0.6 mL/min in a sample flow cell housing the sensor. Decrease in resonance frequency occurred as complementary strands hybridized to the immobilized probe DNA on the sensor surface. For example the three concentrations produced a sensor response of 240, 470 and 1140 Hz. Hybridization in two background matrixes – buffer and buffer containing 10,000-times higher concentration of non complementary strands - were successfully tested. Sensor hybridization response to 1 fM, 1 pM and 1 μM complementary strand were nearly the same in magnitude in presence of non complementary strands, but the hybridization rates were different. In each case, the sensor detected the presence of 2 attomoles (2 mL of 1 fM; 1.2 million molecules) of complementary 10-mer strand. The initial findings suggest ssDNA can be detected at 2 attomoles without a sample preparation step and without the use of labeled reagents. The results reporting on these findings was recently published4.
Future Activities:
Our plans for Year 2 activities are as follows:
- Examine limit of detection of Cryptosporidium parvum oocysts in buffer and river water, and in presence of E. coli and/or Giardia. Establish if detection selectivity is affected by the presence of contaminating entities. (Objective 2)
- Fabricate beam sensor and evaluate performance for high flow rate sensing (Objective 1)
- Evaluate performance with reference sensor (Objective 2)
- Examine if antibody immobilization is needed for high flow rate detection (Objective 2)
- Design flow cell for large volume samples. The size should accommodate larger flow rate of 1 to 4 liters/min. (Objective 3)
- If the current sensor is found to be ineffective for the high flow rate, design a capture sensor for use at 1 – 4 liters/min. Test and proof it in laboratory setting in time for summer (2008) sampling of Schuylkill River. (Objective 4)
- Initiate initial DNA-based detection of the model pathogen E. coli O157:H7 and Cryptosporidium parvum oocysts. Use both signature DNA sequences and 16S-rRNA sequence. (Objective 3)
- Examine the detection performance of the PEMC sensors in different background matrixes; river water, buffers containing proteins (milk as an example medium), samples containing known concentrations of particulate matter
Quality Assurance
The main instrument used in the various experiments is the Agilent impedance analyzer. It was calibrated last summer and is not due for another until June 2008. Every experiment is repeated at least three times to assure repeatability. Since the sensor is manually fabricated, we maintain a record of each sensor that is used in experiment. The record consists of its resonance spectrum, date of fabrication and a history of its use. Most sensors are examined for possible defects by the stability of the resonance peak in running PBS (0.5 mL/min) for a minimum of one hour. Record keeping of all experiments is in laboratory notebooks.
References
- Maraldo, D.; Mutharasan, R. Mass Change Sensitivity of Piezoelectric-Excited Millimeter-Sized Cantilever (PEMC) sensors: Model and Experiments Sensors and Actuators B: Chemical 2007, under review.
- Campbell, G. A.; Mutharasan, R. A Method of Measuring Escherichia Coli O157:H7 at 1 Cell/mL in 1 Liter Sample Using Antibody Functionalized Piezoelectric-Excited Millimeter-Sized Cantilever Sensor Environ. Sci. Technol. 2007, 41 (5), 1668 - 1674.
- Campbell, G. A.; Mutharasan, R. Near real-time detection of Cryptosporidium parvum oocyst by IgM-functionalized Piezoelectric-Excited Millimeter-Sized Cantilever Biosensor Biosensors and Bioelectronics 2007, under review.
- Rijal, K.; Mutharasan, R. PEMC-based Method of Measuring DNA Hybridization at Femtomolar Concentration Directly in Human Serum and in the Presence of Copious Noncomplementary Strands Analytical Chemistry 2007, 79 (19), 73927400.
- Campbell, G. A., Mutharasan, R. Detection of Pathogen Escherichia coli 0157:H7 Using Self-Excited PZT- Glass Microcantilevers Biosensors and Bioelectronics 2005, 21 (3), 462-473.
- Campbell, G. A., Mutharasan, R. Detection of Bacillus anthracis spores and a model protein using PEMC sensors in a flow cell at 1 mL/min Biosensors and Bioelectronics 2006, 22 (1), 78-85.
- Campbell, G. A.; Mutharasan, R. A method of measuring Escherichia coli O157:H7 at 1 cell/mL in 1 liter sample using antibody-functionalized piezoelectric-excited millimeter-sized cantilever sensor Environmental Science & Technology 2007, 41 (5), 1668-1674.
Journal Articles on this Report : 6 Displayed | Download in RIS Format
| Other project views: | All 10 publications | 10 publications in selected types | All 10 journal articles |
|---|
| Type | Citation | ||
|---|---|---|---|
|
|
Campbell GA, Mutharasan R. Detection of Bacillus anthracis spores and a model protein using PEMC sensors in a flow cell at 1 mL/min. Biosensors & Bioelectronics 2006;22(1):78-85 |
R833007 (2007) |
not available |
|
|
Campbell GA, Mutharasan R. A method of measuring Escherichia coli O157:H7 at 1 cell/mL in 1 liter sample using antibody functionalized piezoelectric-excited millimeter-sized cantilever sensor. Environmental Science & Technology 2007;41(5):1668-1674. |
R833007 (2007) R833007 (2009) |
Exit |
|
|
Campbell GA, Mutharasan R. Near real-time detection of Cryptosporidium parvum oocyst by IgM-functionalized piezoelectric-excited millimeter-sized cantilever biosensor. Biosensors and Bioelectronics 2008;23(7):1039-1045. |
R833007 (2007) R833007 (2009) |
Exit |
|
|
Maraldo D, Mutharasan R. Optimization of antibody immobilization for sensing using piezoelectrically excited-millimeter-sized cantilever (PEMC) sensors. Sensors and Actuators B: Chemical 2007;123(1):474-479. |
R833007 (2007) |
Exit Exit Exit |
|
|
Maraldo D, Mutharasan R. Mass-change sensitivity of piezoelectric-excited millimeter-sized cantilever (PEMC) sensors: model and experiments. Sensors and Actuators B: Chemical 2008;132(1):140-148. |
R833007 (2007) |
Exit Exit Exit |
|
|
Rijal K, Mutharasan R. PEMC-based method of measuring DNA hybridization at femtomolar concentration directly in human serum and in the presence of copious noncomplementary strands. Analytical Chemistry 2007;79(19):7392-7400. |
R833007 (2007) R833007 (2009) |
Exit Exit |
Supplemental Keywords:
, RFA, Scientific Discipline, INTERNATIONAL COOPERATION, Water, Drinking Water, Environmental Monitoring, measurement method, sensors, piezoelectric microcantilevers, DNA, monitoring, pathogensProgress and Final Reports:
Original AbstractThe perspectives, information and conclusions conveyed in research project abstracts, progress reports, final reports, journal abstracts and journal publications convey the viewpoints of the principal investigator and may not represent the views and policies of ORD and EPA. Conclusions drawn by the principal investigators have not been reviewed by the Agency.