
Grantee Research Project Results
2008 Progress Report: Effect of Sea Level Rise and Climate Variability on Ecosystem Services of Tidal Marshes
EPA Grant Number: R832220Title: Effect of Sea Level Rise and Climate Variability on Ecosystem Services of Tidal Marshes
Investigators: Craft, C. B. , Ehman, Jeffrey , Park, Richard , Joye, Samantha , Pennings, Steven
Institution: Indiana University - Bloomington , Pangaea Information Technologies, Ltd. , Eco Modeling , University of Georgia , University of Houston
Current Institution: Indiana University - Bloomington , Eco Modeling , Pangaea Information Technologies, Ltd. , University of Georgia , University of Houston
EPA Project Officer: Packard, Benjamin H
Project Period: April 1, 2005 through June 30, 2009
Project Period Covered by this Report: April 1, 2007 through March 31,2008
Project Amount: $749,974
RFA: Effects of Climate Change on Ecosystem Services Provided by Coral Reefs and Tidal Marshes (2004) RFA Text | Recipients Lists
Research Category: Aquatic Ecosystems , Ecological Indicators/Assessment/Restoration , Watersheds , Water , Climate Change
Objective:
Development of a conceptual model that describes how tidal marsh ecosystem services vary along the salinity gradient and a simulation model of how sea level rise and climate variability will affect the delivery of ecosystem services.
Progress Summary:
Field sampling and lab analyses of vegetation and soils are complete. For these aspects of the project, two manuscripts are in review and two are in preparation (see Publications). Field and lab measurements of trace gases (CO2, CH4, denitrification) are underway and will continue through the summer. We received a one-year, no-cost extension beginning April 1 2008 to complete this work because of difficulties with graduate student retention associated with this part of the project. We anticipate that the data collected for this part of the project will be completed by summer’s end and one or more manuscripts will be finalized by the end of the one year extension, March 31 2009.
Model simulations of IPCC prediction of sea level rise (SLR) (Mean, max, 1 m) for the Georgia and South Carolina coast have been completed and preliminary impacts to ecosystem services have been estimated. We recently received word that our manuscript demonstrating our field-lab-GIS-modeling-based approach will be published as a Research Communication in the journal, Frontiers in Ecology and the Environment (see Publications).
Another exciting milestone is the development of a web site at Indiana University that shows the results of our model simulation. SLAMM-View, as it is called, allows viewers to see how different model simulations of SLR affect (wet)land cover along the Georgia-South Carolina coast at various spatial scales. SLAMM-View is accessed through our EPA website (www.spea.indiana.edu/wetlandsandclimatechange). For more information about SLAMM-View, see the section on Web Site Activities.
Emergent Vegetation
Few studies have compared ecosystem functions of tidal fresh, brackish and salt marshes, despite speculation by Odum (1988) that these functions might vary across the salinity gradient within an estuary. We examined patterns of habitat function (plant diversity), productivity (plant biomass, total C) and nutrient stocks (N, P in aboveground plant biomass) in tidal marshes of the Satilla (Sa), Altamaha (A) and Ogeechee (O) Rivers in Georgia.
Between the 10th and 26th of July 2006 we conducted a preliminary species richness survey of plant communities in tidal marshes of Ogeechee, Altamaha and Satilla rivers (Figure 1). On each river, 6 sites were established (2 replicates of each estuarine region), with 50 plots located in a transect from the water’s edge to the mid-marsh at each site. Species richness was measured in each plot (1m2 quadrat).
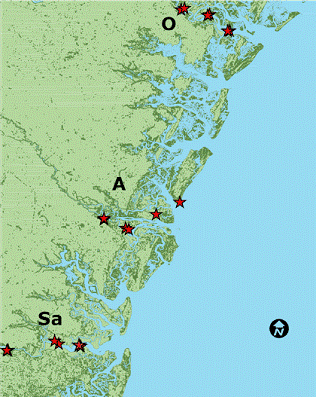
Map of the study areas.
Between the 15th and 24th of October 2006 a survey of biomass and species richness was conducted at the same sites. We located 12 plots at each site, 3 in the creekbank zone, 6 along the creekbank – midmarsh transect, and 3 in the midmarsh. Species richness was measured within each plot inside of a 0.25m2 quadrat. Standing biomass was harvested, dried and weighed.
At the same time, we collected leaf samples for C, N and P analysis. Leaves were collected from plants adjacent to the plots used for the diversity-biomass survey. An entire leaf was clipped from each of three individuals of a single dominant species. For grasses, the intermediate-aged leaves (in between new and yellow) were chosen; for Juncus, fully-green leaves were chosen. Clipped leaves were stored on ice in the field and frozen in the laboratory. In December 2006 the samples were transported on ice to UH where all the material was freeze-dried (LABCONCO freeze drier, collector temperature -48C, 60h per sample). Freeze dried leaves with a total area less than ca 20 cm2 per sample were pulverized in toto, bigger samples were cut with scissors into pieces (ca 2-3 cm2) and a random sub-sample of ca 20 cm2 was pulverized (SPEX mill, 5 min per each sample) and transferred into eppendorf vials. C, N and P content of leaves was determined by the Craft laboratory at Indiana University.
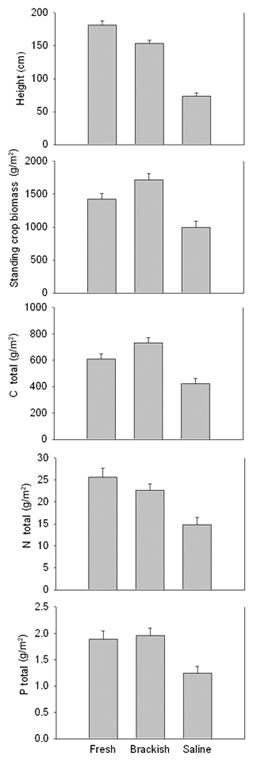
Figure 2. Ecosystem patterns of vegetation in three salinity zones of the study areas.
Vegetation was tallest at fresh sites dominated by Zizaniopsis and shortest at salt marsh sites dominated by Spartina (Figure 2). Standing biomass was greatest at brackish sites (Figure 2) and in both brackish and fresh sites tended to decrease away from the creekbank, whereas in the salt marsh sites biomass was greatest in the midmarsh zones dominated by Juncus roemerianus (data not shown).
Standing stocks of C, N and P were estimated based on total biomass, the relative abundance of different plant species, and the elemental composition of each plant species. Total Carbon stocks paralleled patterns of biomass in that they were greatest at the brackish sites and lowest at the salt marsh sites (Figure 2). Nitrogen stocks decreased across sites as salinity increased (Figure 2) and were greatest in the creekbank zone. Phosphorus stocks did not differ between fresh and brackish sites, but were lower at saline sites (Figure 2).
Our results generally support Odum’s (1988) speculations, and emphasize that ecosystem function in tidal wetlands changes sharply across the relatively short horizontal distance of the estuary. In particular, tidal fresh and brackish marshes support taller, more diverse vegetation with a higher biomass and higher elemental stocks than the better-studied salt marshes. Changes in plant distribution patterns driven by sea level rise or fresh water withdrawal are likely to have strong impacts on a variety of wetland functions because the functional value of fresh and brackish marshes is quite different than the value of salt marshes.
Biogeochemical Processes
Porewater and sediment cores were collected at the same sites as for emergent vegetation (Figure 1) for laboratory assays to determine denitrification and methanogenesis rates (not shown). For each sample site, triplicate live samples were run alongside one “killed” control. For potential denitrification and methanogenesis incubations, sediment was slurried with site specific artificial pore water (made based on measurements of pore water chemistry at a particular site).
Potential denitrification incubations were performed under anaerobic conditions. The artifical pore water was amended with glucose (200μM) and nitrate (100μM) so that denitrification activity was not substrate limited. The acetylene block technique was used to halt the conversion of nitrous oxide to dinitrogen gas and nitrous oxide production was measured using a gas chromatograph.
Denitrication rates were highest in the Altamaha, intermediate in the Satilla, and the lowest in the Ogeechee (Figure 3). Generally, the freshwater sites showed highest denitrification rates in all three rivers.
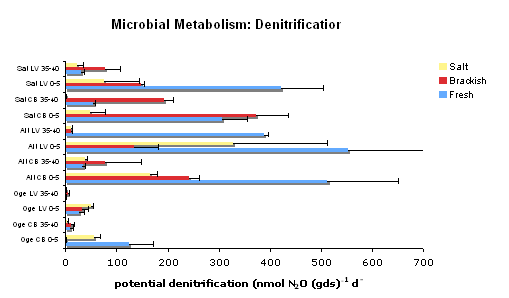
Figure 3. Denitrification rates across rivers, habitats and depth: Ogeechee (Oge), Altamaha (Alt) and Satilla (Sat) in May 2007 at specific depths and locations and 3 different salinity regimes: CB (Creek bank/marsh) sediment and LV (levee) at 0-5 cm and 35-40 cm deep; fresh water (blue), brackish (red) and salt (yellow).
Web Site Activities
We developed a web-mapping application named “SLAMM-View” to enable the public to visualize how different scenarios of SLR affect coastal wetlands (and uplands) at varying spatial scales along the GA-SC coast. SLAMM-View portrays pairs of simulation results in conjunction with other thematic (land cover) layers which provide context. SLAMM-View allows the user to choose one of the 45 output pairs in a dual “live” map display: either from the same year (e.g., 2100) but from different scenarios (e.g., a 0.5 m SLR and a 1 m SLR), or from different years within the same scenario (e.g., base year 2000, and year 2100 under a 1 m SLR). The zooming and panning tools allow the user to focus the inquiry on their particular locality of interest, be it a large region encompassing both Georgia and South Carolina, or a small barrier island. One unique aspect of this web-mapping tool, vital to facilitating a comparison between the selected pair of simulation results, is that the dual maps are geographically-linked: zooming or panning in one map causes an identical action in the other map (see Figure 4).
SLAMM-View is a browser-based application utilizes a combination of server and client software (Java and Java-script) based on Image Matters userSmarts® technology. The ACSII formatted output was converted to PNG (Portable Network Graphics), an extensible file format for the lossless, portable, well-compressed storage of raster images. This provides for fast rendering of the large gridded maps over the Internet without any reduction in the detail when viewed at local scales. The application accesses contextual layers such as state and county boundaries, roads, and NWI wetlands via web mapping services (OGC WMS), with adjustable layer transparency and a Layer control view that allows users to order and turn these ancillary layers on and off. SLAMM-View was developed to support Firefox, as well as both Internet Explorer 6 and 7 browsers. Server side software was installed, with support from Anna Radue and her colleagues at University Information Technology Services, at Indiana University. SLAMM-View can be accessed at: http://www.spea.indiana.edu/wetlandsandclimatechange/.
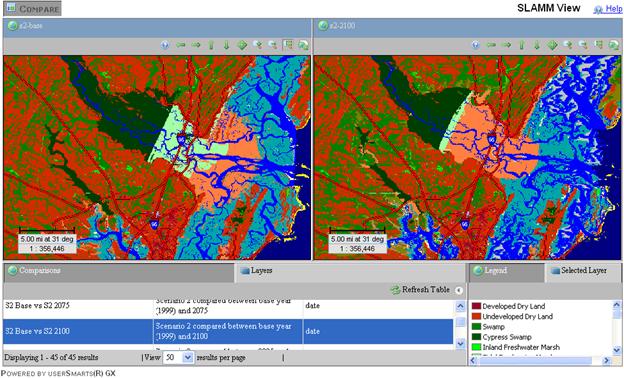
Figure 4. A screenshot of the SLAMM-View application showing the Altamaha estuary at baseline (left), and conditions at year 2100 under the A1B Maximum sea level rise (SLR) scenario.
Future Activities:
Except for the biogeochemistry work, where field and lab measurements will continue through the summer, all other aspects of the data collection, GIS and simulation modeling are complete. Our efforts now are directed to writing manuscripts and, in general, disseminating our research findings. We hope to have four manuscripts (see publications) published by the end of the one-year extension as well as several more that will be in review, including one that presents advances and improvements to the Sea Level Affects Marshes Model, SLAMM. A major synthesis manuscript that integrates the entirety of our work will be completed by this time next year with the goal of publishing it in a highly rated journal such as Climate Change Biology.
References:
Odum WE. 1988. Comparative ecology of tidal freshwater and salt marshes. Annual Review of Ecology and Systematics 19: 147-176.
Journal Articles on this Report : 1 Displayed | Download in RIS Format
| Other project views: | All 51 publications | 15 publications in selected types | All 12 journal articles |
|---|
| Type | Citation | ||
|---|---|---|---|
|
|
Craft C, Clough J, Ehman J, Joye S, Park R, Pennings S, Guo H, Machmuller M. Forecasting the effects of accelerated sea-level rise on tidal marsh ecosystem services. Frontiers in Ecology and the Environment 2009;7(2):73-78. |
R832220 (2008) R832220 (Final) |
Exit Exit |
Supplemental Keywords:
Estuary, ecological effects, ecosystem, scaling, regionalization, modeling, climate models, Atlantic coast, Georgia-GA, South Carolina-SC, Region 4, RFA, Air, Scientific Discipline, Ecosystem Protection/Environmental Exposure & Risk, Aquatic Ecosystem, Aquatic Ecosystems & Estuarine Research, Ecological Risk Assessment, Chemistry, Atmosphere, Monitoring/Modeling, Air Pollution Effects, climate change, global ciruclation model, South Atlantic Coast, Global Climate Change, global climate models, climate model, atmospheric chemistry, environmental monitoring, coastal ecosystems, global change, ecological models, climate variability, environmental measurement, ecosystem indicators, climate models, habitat preservation, environmental stress, ecosystem stress, meteorology, aquatic ecosystems, climatic influence, coral reef communities, climate, tidal marshRelevant Websites:
http://www.spea.indiana.edu/wetlandsandclimatechange ![]()
Progress and Final Reports:
Original AbstractThe perspectives, information and conclusions conveyed in research project abstracts, progress reports, final reports, journal abstracts and journal publications convey the viewpoints of the principal investigator and may not represent the views and policies of ORD and EPA. Conclusions drawn by the principal investigators have not been reviewed by the Agency.