
Grantee Research Project Results
2005 Progress Report: Adaptive Implementation Modeling and Monitoring for TMDL Refinement
EPA Grant Number: R830883Title: Adaptive Implementation Modeling and Monitoring for TMDL Refinement
Investigators: Reckhow, Kenneth H. , Stow, Craig A. , Shabman, Leonard A. , Arhonditsis, George B. , Borsuk, Mark E. , Qian, Song S. , Roessler, Chris , McMahon, Gerard
Current Investigators: Reckhow, Kenneth H. , Stow, Craig A. , Shabman, Leonard A. , Borsuk, Mark E. , Roessler, Chris , McMahon, Gerard
Institution: Duke University , United States Geological Survey , Swiss Federal Institute for Environmental Science & Technology (EAWAG) , North Carolina Division of Water Quality (DWQ) , Resources for the Future , University of South Carolina at Columbia
Current Institution: Duke University , Resources for the Future , United States Geological Survey
EPA Project Officer: Packard, Benjamin H
Project Period: June 1, 2003 through May 31, 2006 (Extended to October 30, 2007)
Project Period Covered by this Report: June 1, 2005 through May 31,2006
Project Amount: $660,171
RFA: Developing Regional-Scale Stressor-Response Models for Use in Environmental Decision-making (2002) RFA Text | Recipients Lists
Research Category: Aquatic Ecosystems , Ecological Indicators/Assessment/Restoration
Objective:
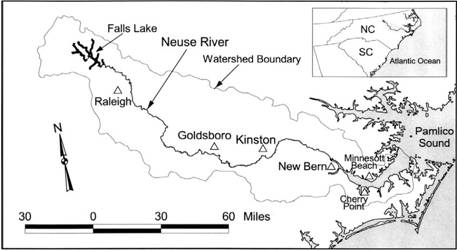
The basic objective of the project is to develop an adaptive implementation modeling and monitoring strategy (AIMMS) for TMDL improvement. AIMMS will allow us to analytically integrate TMDL modeling with post-implementation monitoring to refine and improve the TMDL over time. Two probabilistic models with the ability to support error propagation, i.e., the NeuBERN Bayes network estuary model and the USGS Neuse SPARROW model, will be linked in AIMMS. The case study for application and evaluation of AIMMS would be the Neuse Estuary nitrogen TMDL in North Carolina (Figure 1). This evaluation will be accomplished through two sub-objectives: a) assessment of the value of information (value of additional monitoring) for TMDL compliance evaluation using the linked models in AIMMS, b) design and evaluation of additional monitoring to update the TMDL forecast using AIMMS. Another objective of the study is to develop and test a process for engaging stakeholder decision makers in refining the format of the model outputs and endpoints. The anticipated result from the last objective is to assure the model’s utility and credibility as an adaptive management decision support tool. In a general sense, this project should have broad applicability as a framework to update and improve model forecasts (and management actions) over time. In a specific sense, the Neuse application of AIMMS will provide an informative and useful case study, which will serve as a basis for the required 2006 NC DWQ re-evaluation of designated use support in the Neuse Estuary.
Figure 1: The Neuse River Estuary watershed
Progress Summary:
After the completion of the Bayesian analysis of SPARROW (Qian et al, 2005), we focused on two fronts. One was to address the mismatch of temporal scales between the SPARROW model and the NeuBERN (Borsuk et al. 2004a,b) model. The other was a water quality model with increased mechanistic representation of model algal response to changes in nitrogen loading. As described in our last progress report, we proposed to use a probabilistic framework (Box 1 of the 2004 progress report). The proposed framework is, however, problematic. This is because the temporal scale mismatch is not the only problem in integrating the two models. The SPARROW model for the watershed was fit using 1991-1992 data. Changes in the watershed since then are not reflected in the estimated nutrient loadings. As a result, even with the temporal scale mismatch resolved, we are unable to integrate the watershed model and the estuary water quality model to evaluate changes in water quality over time in response to the reduced nitrogen loading due to the implementation of a TMDL program (as well as a state-mandated pre-TMDL program). With this discovery, we moved our focus on how to use limited nitrogen loading data in the watershed since 1992 to provide updated estimates on nitrogen loading changes over time. We have worked in two different areas. First, we started a series of studies on the use of a simple Bayesian approach for updating nutrient loadings and nutrient concentrations. Second, we started to use the Neuse River Digital Watershed (NSF CUASHI project) to provide annual nutrient loading data and revised our Bayesian SPARROW model to update model parameters as well as estimated nitrogen loadings using data from subsequent years. In this report, we describe progress made in these two areas, as well as a general description of the water quality model.
Bayesian updating using conjugate family of prior distributions: Information synthesis is often the motivation for employing a Bayesian approach. However, the conventional application of a Bayesian approach emphasizes the combination of prior information and a single set of data. Although it is shown in Bayesian statistics texts that sequential updating using the posterior from the previous step as prior is equivalent to updating using all of the data together, sequential updating provides a means to investigate possible temporal patterns in the data, which is attractive for our proposed adaptive implementation for the TMDL. In the past year, we have developed a series of sequential updating procedures, including procedures for updating our estimates of nutrient and chlorophyll a concentrations, and updating parameters of an estuary algal biomass model.
Small sample sizes often characterize water quality data. Model estimated concentrations are often less reliable than measurements because of the uncertainty associated with the model and model parameter estimates. Thus, using monitoring data to supplement model predictions can be a prudent strategy. In addition, because model parameters are often estimated based on historical data, predictions of water quality concentrations can be irrelevant to current or future conditions. For example, when a model is used for TMDL planning, the model’s parameters are inevitably estimated based on pre-TMDL data. Once the TMDL program is implemented, changes in waste generation and delivery processes may require a modified model or modified model parameters. As a result, updating a model’s prediction using monitoring data may be essential to understand the effectiveness of a TMDL program.
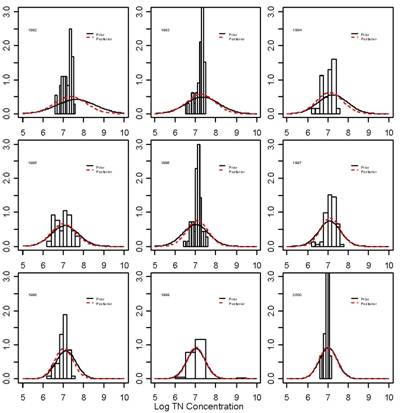
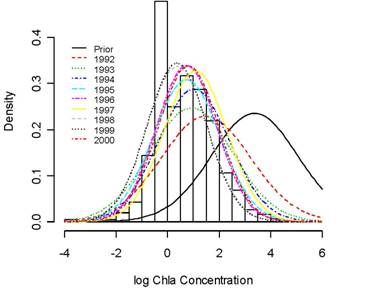
We developed a series of computer programs to automate the process of updating water quality concentration estimation from model predictions and subsequent monitoring data. These programs use Bayesian statistics results for (log) normal random variables, and the conjugate family of prior distributions. The process has three steps. First, a number of procedures were developed for converting model predictions of water quality concentrations to a prior distribution of the underlying concentration distribution parameters (the “true” mean and variance). Second, we developed a program to produce the posterior distribution of the underlying concentration distribution parameters and the posterior predictive distribution of future observations. Third, the posterior distribution of the underlying concentration distribution parameters is converted to a prior distribution of the same parameters for the next time period, and the process repeats when new data are available. With this process, the Bayesian SPARROW model-predicted 1992 nitrogen concentration distribution for the Neuse River Estuary was used to develop a prior distribution of the mean and variance of log nitrogen concentrations, and the sequentially updated posterior predictive distributions for each subsequent year are presented (Figures 2 and 3). The same process was repeated for the chlorophyll a concentration distribution in the Neuse River Estuary (Figure 4). The prior distribution for chlorophyll a was developed using the empirical model (Borsuk et al., 2004) and the results from the SPARROW model. Although our prior distribution over-estimated the chlorophyll a concentration, the sequentially updated posterior predictive distributions quickly converged to a distribution similar to the observed chlorophyll a concentration data (Figure 4).
Figure 2. Sequentially updated predictive distribution of nitrogen concentration in the Neuse River Estuary. The Solid black lines are the prior distribution used for each year, the red dashed lines are the resulting posterior predictive distributions for the same year, and the data are shown in histograms.
A model is a summary of our understanding about the system under study. As a result, a model should be able to be updated as we accumulate more knowledge about the system. This knowledge accumulation when reflected in the model may be represented in terms of refined model parameter estimates, additional modules, or a new model all together. However, in practice, a mathematical model is rarely updated once it is “calibrated.” In this document, we describe the process of refining model parameter estimates using newly obtained data.
Figure 3. Sequentially updated posterior predictive distribution of log nitrogen concentrations in the Neuse River Estuary. The histogram shows the combined nitrogen monitoring data collected from 1992 to 2000.

Figure 4. Sequentially updated posterior predictive distribution of log chlorophyll a concentrations in the Neuse River Estuary. The histogram show the combined chlorophyll a monitoring data collected from 1992 to 2000.
We used a non-linear threshold regression model to model the chlorophyll a concentration as a function of flow, temperature, and nitrogen concentration. The model was originally developed by Borsuk et al. (2004a, 2004b) for the Neuse River estuary. The original model used a fixed flow threshold. We recently modified this model such that the flow threshold value is used as a free parameter estimated (and updated) from the data. The chlorophyll a model is of the form:

where β2, β3 are positive and Fthreshold is the flow threshold, below which chlorophyll concentration increases as flow from the Neuse River increases (due to increased input of nutrients) and the chlorophyll concentration decreases when flow increases beyond the threshold (due to the flushing effect). Because the model is fully defined by coefficients β1 to β4 and Fthreshold, any changes in the system could be reflected in the estimated model coefficient vales. As suggested by Beck (1987), trajectories of the estimated model coefficients estimated along a time series of data can be used as indicators of changes in the system or inadequacy of the model. Beck (1987) recommended use of the Kalman filter, a simplified dynamic linear modeling (DLM) approach (West and Harrison, 1997). Ideally, a DLM is most suitable for updating model coefficients. Because the DLM is mostly limited to linear models, implementing our threshold regression model under a DLM framework is computationally challenging. We present a simple Bayesian updating process, which begins with a set of prior distributions for the five model coefficients, parameter θ, and model error variance σ2 defined using previous model results. The initial priors are combined with data from 1992 to estimate the posterior distributions. The 1992 posterior distributions of the seven unknown parameters are used as the prior distributions for year 1993, and the process is repeated for each year we have data (1992-1999).
The updating results are presented in two parts. First, the changes in the posterior distributions of the seven unknown parameters are presented (Fig. 5). Second, model predicted chlorophyll a concentrations under a hypothetical future flow-nitrogen concentration condition is compared using the updated model for each of the 8 years we have data (Fig. 6). This predicted chlorophyll concentration distribution represents our knowledge of future chlorophyll a concentration after observing nitrogen and chlorophyll a concentrations to date.
The seven unknown model parameters underwent some changes as more data were accumulated. Notable changes are in the flow threshold (a smaller threshold is established in the last two years) and β3 (a higher value is reached in the last two years). These two changes may indicate reduced algae productivity in the estuary.
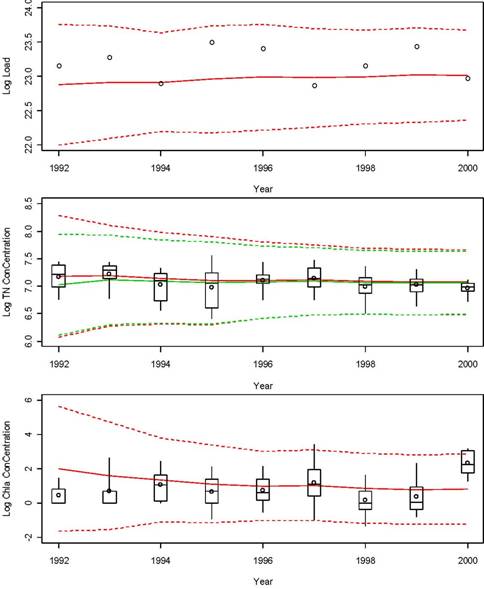
Despite a relatively stable nitrogen loading to the estuary, and stable observed in-estuary chlorophyll a concentrations in recent years (Fig. 7), we predicted lower chlorophyll a concentrations for a hypothetical flow condition than we would have predicted before 1996. A change in the chlorophyll a concentration - flow relationship may indicate a change in nutrient conditions in the estuary.
Figure 5. Sequentially updated posterior distributions of model parameters.
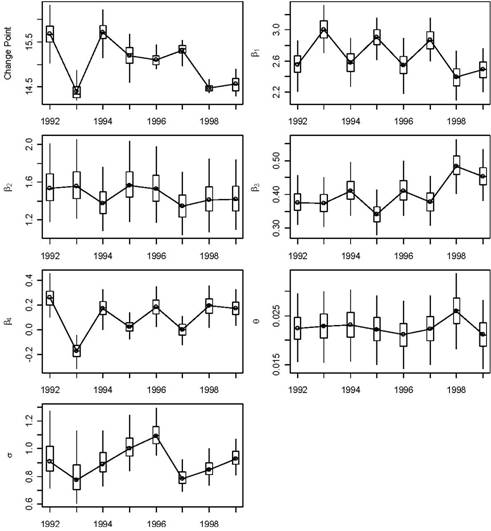
Figure 6. Model predicted log chlorophyll a concentration distributions for a hypothetical flow condition using the annually updated model.
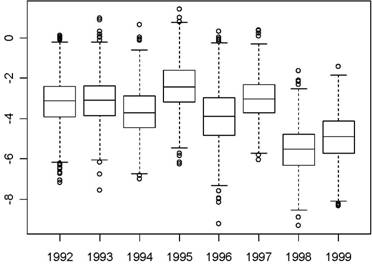
Figure 7. Observed nitrogen loadings, nitrogen concentrations, and chlorophyll a concentrations.
Water quality model. In the last (2004) progress report, we described a model with a strong theoretical basis and yet mathematically simple enough to be parameterized using available data and to allow a complete uncertainty analysis. In the past year, we focused on how the proposed model can be fit into the Bayesian updating process described above. We have completed a preliminary study on the use of Markov chain Monte Carlo simulation for sequential model parameter updating. This process is implemented under the newly available WinBUGS development software which allows us to construct a moderately complex model (represented by a set of partial differential equations) and yet easily make use of the MCMC methods implemented under WinBUGS. We tested an algal growth model for the Neuse River Estuary. The model is structured as a sequence of five completely mixed stirred tank reactors (CSTRs). Within each compartment, two partial differential equations are used to describe (1) the process of algal growth as a function of nutrient supply and sedimentation, and (2) changes in nitrogen concentration as a function of loading from upstream, plus consumption and sedimentation within the compartment. By implementing our water quality modeling work in WinBUGS, instead of AQUASIM and UNCSIM as reported in the 2004 progress report, we unify the modeling platform and enable advanced Bayesian model parameter updating.
Future Activities:
After careful research, we believe that the optimal method for linking the watershed and estuarine models is the use of the digital watershed developed under the CUASHI project. CUASHI is an NSF funded project to foster advancements in the hydrologic sciences. A prototype digital watershed was developed through CUAHSI using data from the Neuse River basin. We experimented with the ways to link a GIS based data retrieval system and the Bayesian SPARROW model using a Python script. From the Python script, we are able to pass the data collected by the GIS system to R and from R to WinBUGS. Once WinBUGS finishes updating the SPARROW model, results are passed back to R, then to Python, and then back to GIS. This system combines the sophisticated statistical modeling and advanced spatial presentation of GIS. Once this combined GIS-WinBUGS system is completed, we will be able to produce updated annual prediction of summer nitrogen loading to the estuary. As a result, it is then possible to link the watershed nitrogen loading model to the water quality model for the estuary. Once the models are linked, the integrated watershed-waterbody response model will be updated with the use of our extensive historic database (covering both TMDL pre- and post-implementation periods). Using data from the post-implementation period will allow us to assess the TMDL effectiveness and make refinements in order to attain the criterion (chlorophyll) and meet designated uses. Furthermore, we intend to use the linked model as a means for optimizing the sampling network and identifying needs for additional monitoring in the Neuse drainage network and the Neuse Estuary. Based on this assessment of the value of information (value of additional monitoring), we will design a sampling network that focuses on sites where the greatest forecast uncertainty occurs but also minimizes sample redundancy caused by spatial or temporal correlation. The collection of this additional information (if necessary) will allow us to update the linked model, update the TMDL forecast and re-assess the TMDL effectiveness. Also important for refining model’s credibility would be the role of decision makers and stakeholders. We expect that their suggestions will help us to extend the tools of analysis to better characterize the certainty and uncertainties about stressor- response relationships (and stressor reduction – response) relationships for complex water bodies. Finally, the stakeholder contribution would be vital in selecting meaningful water quality (and modeling) end points, and thus one of our future objectives would be the use our modeling framework for supporting decisions on water quality standard setting by stakeholders.
Acknowledgments:
This research has been supported by a grant from U.S. Environmental Protection Agency’s Science to Achieve Results (STAR) program. Although the research described in the report has been funded in part by the U.S. Environmental Protection Agency’s STAR program through grant (R830883), it has not been subjected to any EPA review and therefore does not necessarily reflect the views of the Agency, and no official endorsement should be inferred.
References:
Borsuk, M. E., C. A. Stow, and K. H. Reckhow. 2003. An integrated approach to TMDL development for the Neuse River Estuary using a Bayesian probability network model (Neu-BERN). Journal of Water Resources Planning and Management 129:271-282.
Borsuk, M.E., Stow C.A., and Reckhow K.H. 2004a. A Bayesian network of eutrophication models for synthesis, prediction, and uncertainty analysis. Ecological Modelling, 173: 219-239.
Borsuk, M.E., Stow C.A., and Reckhow K.H. 2004b. The confounding effect of flow on estuarine response to nitrogen loading. J. Environ. Eng. 130, 605-614.
McMahon, G., Alexander R.B., and Qian S. 2003. Support of Total Maximum Daily Load Programs Using Spatially Referenced Regression Models. Journal of Water Resources Planning and Management, 129: 315-329.
Qian, S.S., Reckhow K.H., Zhai J., and McMahon G. (2005). Nonlinear regression modeling of nutrient loads in streams: A Bayesian approach. Water Resources Research. July, 2005.
Journal Articles on this Report : 1 Displayed | Download in RIS Format
| Other project views: | All 9 publications | 6 publications in selected types | All 5 journal articles |
|---|
| Type | Citation | ||
|---|---|---|---|
|
|
Qian SS, Reckhow KH, Zhai J, McMahon G. Nonlinear regression modeling of nutrient loads in streams: a Bayesian approach. Water Resources Research 2005;41;W07012, doi:10.1029/2005WR003986. |
R830883 (2004) R830883 (2005) |
Exit |
Supplemental Keywords:
water, watersheds, risk, integrated assessment, ecological effects, Bayesian, modeling, southeast, GIS,, RFA, Ecosystem Protection/Environmental Exposure & Risk, Scientific Discipline, Water, Economic, Social, & Behavioral Science Research Program, Economics & Decision Making, Watersheds, decision-making, Regional/Scaling, Monitoring/Modeling, Water & Watershed, Ecology and Ecosystems, Environmental Monitoring, ecological variation, ecology, ecosystem assessment, adaptive implementation modeling, water quality, Bayesian approach, watershed assessment, risk assessment, ecological models, aquatic ecosystem, environmental decision making, TMDL, water monitoring, Bayesian classifiers, ecosystem stress, assessment endpoint mechanistic research, decision analysis, ecological indicators, ecology assessment models, decision support tool, decision making, environmental risk assessment, watershed, regional scale impactsProgress and Final Reports:
Original AbstractThe perspectives, information and conclusions conveyed in research project abstracts, progress reports, final reports, journal abstracts and journal publications convey the viewpoints of the principal investigator and may not represent the views and policies of ORD and EPA. Conclusions drawn by the principal investigators have not been reviewed by the Agency.