
Grantee Research Project Results
2020 Progress Report: Machine Learning Calibrated Low-Cost Sensing (MLCS)
EPA Grant Number: SU839965Title: Machine Learning Calibrated Low-Cost Sensing (MLCS)
Investigators: Lary, David J , Dowdy, Chris , Kiv, Daniel , Wijerante, Lakitha , Kim, Julia Boah , Hoang, Giakhanh Huu , Aker, Adam , Balagopal, Gokul , Waczak, John , Wijeratne, Lakitha
Current Investigators: Lary, David J , Simmons, Christopher W , Dowdy, Chris , Kiv, Daniel , Wijerante, Lakitha , Kim, Julia Boah , Hoang, Giakhanh Huu , Aker, Adam , Balagopal, Gokul , Waczak, John , Shofner, Berkley , Harindha Wijeratne, Lakitha Omal , Lary, Matthew , Yu, Xiaohe , Jerome, Sol , Pervez, Jaynal , Noorbakhsh, Kameron , Steele, Nicholas , Nair, Nikhil , Schroder, Jake , Hogan, Benjamin
Institution: The University of Texas at Dallas , Paul Quinn College
EPA Project Officer: Callan, Richard
Phase: I
Project Period: October 1, 2019 through September 30, 2020 (Extended to September 30, 2021)
Project Period Covered by this Report: October 1, 2019 through September 30,2020
Project Amount: $25,000
RFA: P3 Awards: A National Student Design Competition Focusing on People, Prosperity and the Planet (2019) RFA Text | Recipients Lists
Research Category: P3 Awards , P3 Challenge Area - Air Quality
Progress Summary:
A constant challenge when measuring air quality is the balance between cost, accuracy and coverage (both spatially and temporally). Our street level surveys have shown that to capture the neighborhood scale variability in air quality measurements should be made every 0.5 km. We are using machine learning technology that we initially developed for the calibration of NASA and ESA satellite instruments to calibrate low cost sensors against primary reference sensors. We are committed to open data and transparent open science. All sensor designs and code for the sensors and website are online. The sensors we build make measurements every few seconds and stream the data in real-time allowing us to accurately capture the time evolution of air quality at a site. We then can answer the question: How representative is an individual observation of what was encountered over a time window? Our sensors a typically deployed as a cluster of measurement nodes, a central node which is surrounded by an ensemble of lower cost nodes that are solar powered and wirelessly communicate with the central node. The central node contains an EPA certified O3 FEM instrument, an airborne particle spectrometer measuring the aerosol size distribution in the size range 0.35μm to 40 μm in 24 size bins, temperature, pressure and humidity, and some low cost gas sensors, a set of light sensors measuring the UV/visible spectrum of light that drives atmospheric photochemistry, an ionizing radiation sensor, and a lightning sensor. The lower cost nodes surrounding the central node measure particulates, temperature, pressure and humidity, and include some low cost gas sensors (CO, NO2, NH3, CH4, etc).
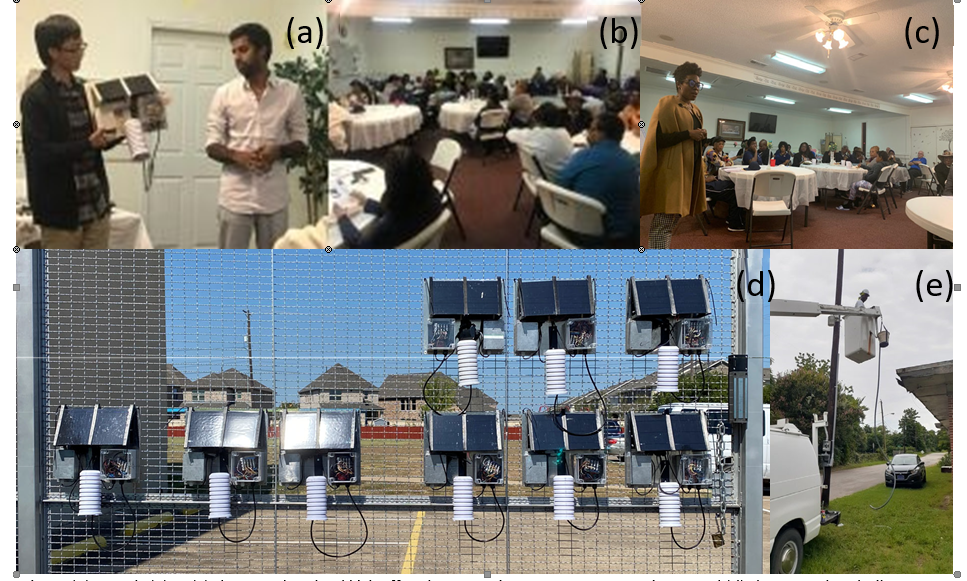
Figure 1. Panels (a) to (c) show student lead kick off and community engagement meeting. Panel (d) shows student built sensors being calibrated at our calibration station. Panel (e) shows central sensor node and LoRa gateway being mounted in community in Joppa, TX.
Prior to the lockdown associated with the COVID-19 pandemic we had made very good progress (Figure 1) in constructing, calibrating and deploying our air quality sensors. Community engagement and sensor construction is led by the students, and the identification of sites for the sensors (please see the pictures in Figure 1) is done by the students in partnership with the community groups. During the COVID-19 lock down we reorganized the way we worked to predominantly remote working. We continue to make good progress. We already have online a visualization portal that was built by the students, where the air quality sensor data (https://www.sharedairdfw.com) can be visualized along with an overlay of the winds and weather radar. All the sensor data is made available as it comes in through the portal (http://mintsdata.utdallas.edu:4200). These visualization and data portals are being used by substantial numbers of community members and local educational institutions (schools and community colleges).
Much of the sensor design was done by graduate student Lakitha Wijeratne and undergraduate Daniel Kiv. Lakitha Wijeratne also led the mentoring of the other students (graduate, undergraduate and high-school). Lakitha and Daniel can be seen in Figure 1 in the community outreach kick off meeting. Lakitha continues to be a key contact with the various community partners for new sensor deployment and sensor maintenance.
The active community engagement has been with local communities, local environmental groups, a historical minority university, several cities (Plano, Fort Worth, Dallas, and Richardson), Dallas County, Dallas Community College District (now called Dallas College), Plano ISD and others. This has garnered significant press coverage and support from Dallas County,
Future Activities:
The main activities that remain are: (1) The completion of sensor construction, calibration and deployment. (2) Ongoing community engagement which happens through a weekly teleconference. (3) Presentation at EPA P3 conference.
Journal Articles on this Report : 1 Displayed | Download in RIS Format
| Other project views: | All 4 publications | 2 publications in selected types | All 2 journal articles |
|---|
| Type | Citation | ||
|---|---|---|---|
|
|
Wijeratne LO, Kiv DR, Aker AR, Talebi S, Lary DJ. Using machine learning for the calibration of airborne particulate sensors. Sensors 2020;20(1):99. |
SU839965 (2020) |
Exit |
Supplemental Keywords:
Machine Learning, Sensor Calibration, Air Quality.Relevant Websites:
Live air quality data visualization along with an overlay of the winds and weather radar Exit
Progress and Final Reports:
Original AbstractThe perspectives, information and conclusions conveyed in research project abstracts, progress reports, final reports, journal abstracts and journal publications convey the viewpoints of the principal investigator and may not represent the views and policies of ORD and EPA. Conclusions drawn by the principal investigators have not been reviewed by the Agency.