
Grantee Research Project Results
Final Report: Reactive Nanobubble for Algae and Cyanotoxin Removal
EPA Grant Number: SU839451Title: Reactive Nanobubble for Algae and Cyanotoxin Removal
Investigators: Zhang, Wen , Reif, John A , Shi, Xiaonan
Institution: New Jersey Institute of Technology
EPA Project Officer: Page, Angela
Phase: I
Project Period: December 1, 2018 through November 30, 2019
Project Amount: $15,000
RFA: P3 Awards: A National Student Design Competition Focusing on People, Prosperity and the Planet (2018) RFA Text | Recipients Lists
Research Category: P3 Awards , P3 Challenge Area - Sustainable and Healthy Communities
Objective:
In this EPA P3 phase I project, we aimed to explore and develop a green chemical process involving the formation of chemically reactive NBs to tackle the challenges of harmful algal bloom and cyanotoxin removal. Our central hypothesis was that (1) reactive NBs (e.g., oxygen and ozone) may efficiently react with water pollutants or pathogens, owing to their higher colloidal stability and longer residence time as opposed to regular bulk bubbles or microbubbles that usually float up and escape from water; (2) the collapse of NBs creates the shock waves and transforms into radicals such as •OH, which and facilitate cyanotoxin and/or other algogenic pollutant removal; (3) Furthermore, NBs leaves no or low chemical residuals or disinfection byproducts (DBPs) and thus have negligible implications on water quality or aquatic life. Some additional research questions deserve explorations include the algal cell damage kinetics and mechanisms, degradation kinetics and removal efficiency of cyanotoxin, ammonia and other relevant nutrients.
Summary/Accomplishments (Outputs/Outcomes):
This EPA P3 phase I research has confirmed the presence of NBs of different gases in water and measured their stability (bubble size distribution and zeta potential) under various environmentally relevant conditions. Secondly, NBs such as oxygen has been demonstrated to produce hydroxyl radicals under proper stimulation (e.g., sonication), which has major impacts on algal disruption and cyanotoxin degradation. Upon exposure to O2 NBs at proper doses, algal cells underwent cell disruption and lysis, which inevitably releases algogenic organic matters (AOMs). However, the degradation mechanisms of AOMs (especially cyanotoxins) by different NBs (e.g. ozone NBs) remain elusive and deserve extensive research.
2. Data, Findings, Outputs/Outcomes
2.1. Colloidal properties of NBs in water
We have established a laboratory scale nanobubble generation as shown in Fig. 1.60 Furthermore, the effects of the ceramic membrane pores size, surface energy, and the injected gas pressures on the bubble size were examined.2 The results show that the gas injection pressure had considerable effects on the bubble size of the produced NBs, which was explained by the Laplace - Young Equation. For example, increasing the injection air pressure from 69 kPa to 414 kPa, the air bubble size was reduced from 600 to 340 nm respectively. Membrane pores size and surface energy also had significant effects on sizes and zeta potentials of NBs. The bubble size distribution of oxygen NBs in water in sealed containers was measured under different temperatures for 15 hours, which shows that the size of ONBs reduced from 255±30 nm under 6℃ to 147±11nm under 40℃. The decreased NBs’ size under higher temperature may due to the decreased surface tension of water at high temperatures and removal of large sized NBs.
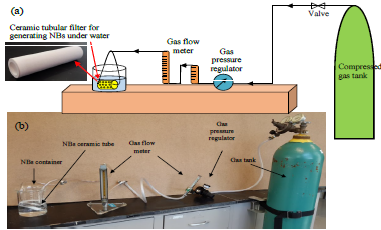
Fig. 1. Schematic of the bench scale NBs generator.
Colloidal properties of nanobubbles (NBs) in liquid such as surface charge and surface tension influence stability (coalescence or bubble size distribution), reactivity and performance of applications. We assessed colloidal properties of three types of nanobubbles (pure air, oxygen and nitrogen) and environmental factors such as pH, ionic strength, the presence of natural organic matters (NOM). Three different types of NBs exhibited different bubble size distribution (160-340 nm in water) as shown in Fig. 2 and zeta potentials (approximately -27 to -45 mV at neutral pHs) presumably due to the differences in their surface tension or charges.
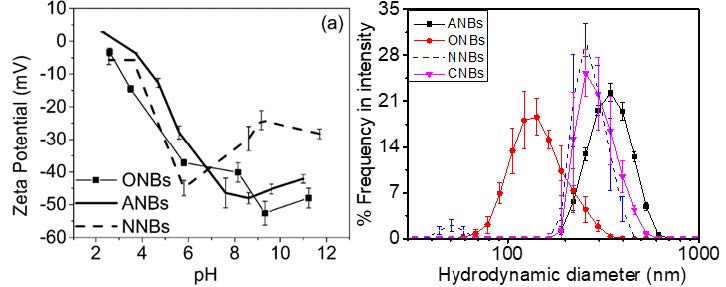
Fig. 2 (a) Zeta potential for ANBs, ONBs, and NNBs at different pHs; (b) Hydrodynamic diameter of air NBs (ANBs), oxygen NBs (ONBs), nitrogen NBs (NNBs), and carbon dioxide NBs (CNBs).
2.2. Visualization of NBs by Atomic Force Microscopy
To confirm and visualize the formation of NBs in water, AFM images of a Highly Ordered Pyrolytic Graphite (HOPG) surface with or without the attachment of oxygen NBs were acquired and compared in Fig. 3. NBs on the HOPG surface were determined to have a height of approximately 30 nm and an average diameter around 200-300 nm. The size of NBs on the surface seems to be reduced or flattened probably due to the deformation of NBs when the AFM probe tip engaged with the soft bubbles.
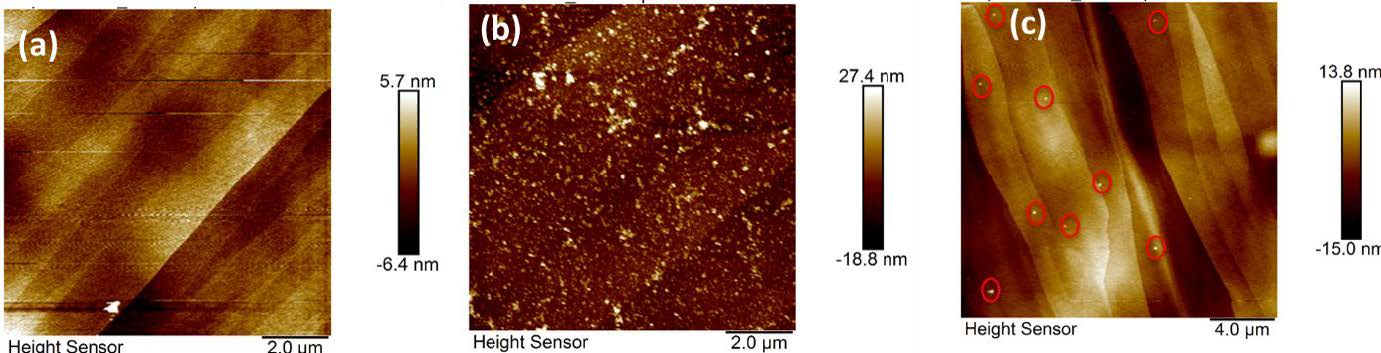
Fig. 3 AFM height images of HOPG surface (a) with a drop of DI water; (b) with a drop of ONBs water within 1 hour,>and (c) 72 hours after deposition.
2.3. Reactive oxygen radical production tests
Generation of hydroxyl radicals (•OH) by different NBs was detected by a photoluminescence (PL) technique with terephthalic acid as a probe molecule.9, 10 Fig. 4 compares the results of the detected •OH radicals in the water suspension of different NBs. Both ONBs and ANBs generated considerable amounts of •OH radicals, whereas NNBs seemed to quench or inhibit radical formation resulted from the sonication, which also produced some •OH radicals under sonication. This highlights the potential of oxygen NBs towards the degradation of organic matters via advanced oxidation processes (AOP).
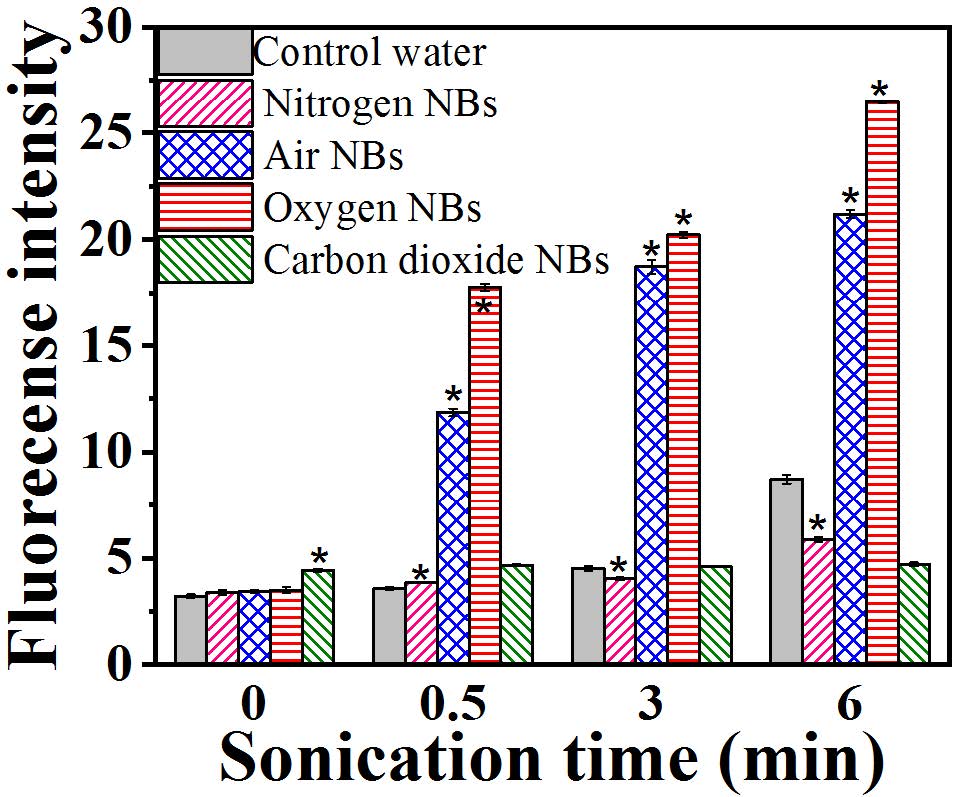
Fig. 4 Fluorescence intensity of different NBs water under sonication (100 W). * denotes significant differences (p<0.05) between the values of NB groups and control group under same sonication time.
2.4 Electrochemical characterization of reactive NBs system
Our hypothesis is that NBs suspension will have a higher reaction activity or stronger oxidation potential than that of other types of NB water. As shown in Fig. 5, electrochemical experiments was carried out on a CHI 660 electrochemical workstation (CH Instrument, USA) to investigate the electrochemical activities of O3/O2 NBs in aqueous solutions. A traditional three-electrode system with a 3 mm platinum disk as the auxiliary electrode, an Ag/AgCl electrode as the reference, and a Pt disk electrode (3.0 mm diameter) as the working electrode was employed. To maintain facile and reproducible electrochemistry, the electrolyte solution was prepared with 10 mM K3Fe(CN)63- in 0.1M KCl as a supporting electrolyte, with or without NBs suspension.>The cyclic voltammogram of Pt working electrode was recorded at 50 mV s-1. Fig. 5 shows our preliminary results of cyclic voltammetry for different NBs. A higher current could indicate a higher electrolyte-electrode interface reaction activity and a higher efficiency of mass transfer potentially caused by NBs.
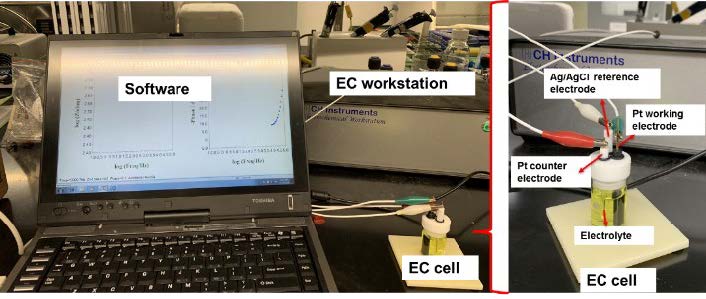
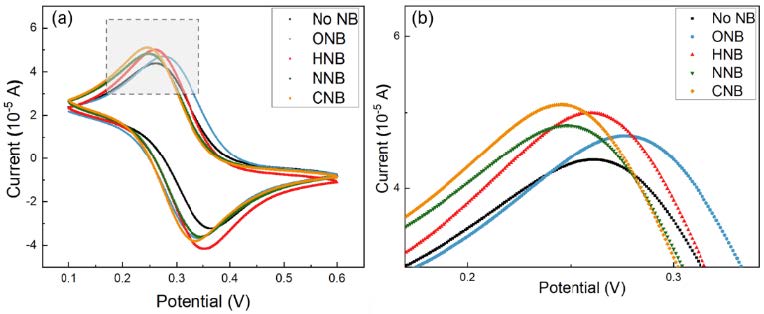
Fig. 5 Above: The electrochemical measurement system. Below: (a) Cyclic voltammetry of NBs water containing different types of gas. (b) Zoom view of the grey-squared part of (a).
2.5. Topography and current imaging of ONBs by AFM-SECM
Previous nanoscale characterization of NBs by AFM were only reported on topography imaging to reveal the size and distribution of NBs on a substrate. Here in our experiments, Fig. 6 reveals both morphological and electrochemical information. Individual oxygen nanobubbles can be clearly identified and precisely located from the topography image as well as the current image. The tip current was generated by the redox reaction of [Ru(Nstrong)6]3+, which are reduced at the tip with a potential at -0.4V, as depicted in the scheme presented in Fig. 5c. A comparison of the topography and current image evidences the good correlation between the locations of the NBs and the current spots. This result may confirm that the existence of ONBs could facilitate the diffusion and mass transfer of [Ru(Nstrong)6]3+ from bulk solution to the tip area and result in a higher current (around 6 pA higher than substrate) when the AFM-SECM tip scanned over NBs.
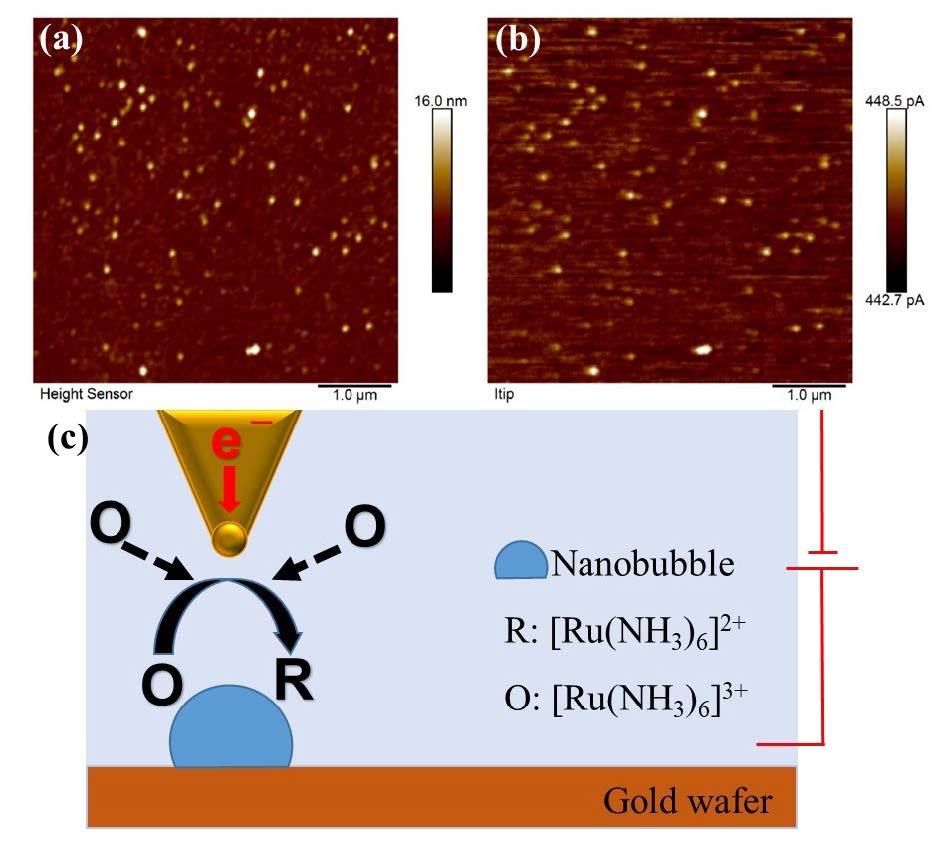
Fig. 6. Simultaneously acquired topography (a) and tip current (b) images of oxygen NBs. (c) Schematic illustration of AFM-SECM measurement of NBs.
2.6. Effect of NBs on algal growth and integrity
The inhibitory effect of the •OH radicals has been reported on cyanobacterial cells (M. aeruginosa).15 Fig. 7 left shows the changes in optical density of the algal cell suspension following air microbubble treatment with different treatment time.15 The density of the untreated sample of algae gradually increased from 0.25 to 0.38 over 3 days. In contrast, the density of all treated samples was reduced to different degrees during 72 h of culture. For algae treated for ≧5 min, the algae biomass decreased almost linearly to as low as 0.04 after 72 h culture, amounting to a reduction of 84%. It was observed that treated samples turned from green to yellow and some algae settled to the bottom. When the treatment period was less than 5 min, the decrease in density was comparable to that of other treated groups, but then density began to increase again. The final optical density in these cultures after 72 h was about 0.18. Besides the effect of •OH radicals, air bubbles have proven to increase dissolved oxygen in water>and cause changes of redox levels and speciation such as nitrogen, phosphorus, and sulfur,>which may affect algae growth and algae-induced anoxia/hypoxia in the eutrophic waters.
Scanning electron microscope (SEM) was used to observe the morphology changes of the bubble-exposed algae. Fig. 7 right shows the untreated algae with intact cytoderm and epicyte, and with viscous material adhering to the cell surface. After treatment, algal cells exhibited different degrees of damage (e.g., loss of extracellular materials) and apparent collapse or ruptures (Fig. 7(right)b). After 30 min, ruptures were apparent on the surface of almost all cells. Furthermore, the algae accumulated in large clumps (Fig. 6 (right)c).
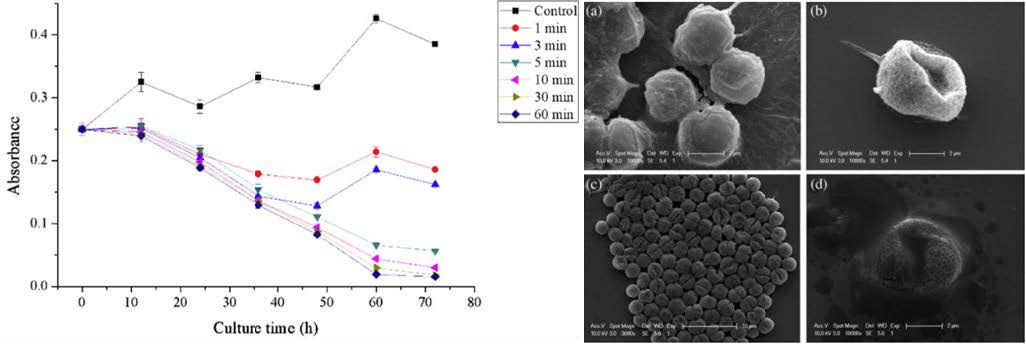
Fig. 7 Left: The changes in optical density of the cell suspension following air MBs treatment with different treatment time. Right: Electron micrographs of M. aeruginosa cells after NBs treatment (0.4 MPa, 0.5 L min−1) for (a) 0 min (control); (b) 10 min; (c) 30 min; (d) 60 min. Figures cited from a reference.
2.7. Detection method development for cynanotoxin (i.e., MCLR)
The concentration of the model cyanotoxin, Microcystin LR (MCLR), was successfully measured using the Agilent Ultivo triple quadrupole LC/MS/MS system (1290 Infinity LC/6460 QQQ MS, Agilent, U.S.A) according to the US EPA method 544.19 The method involved the use a reversed phase C 18 column (2.7 mm i.d. ×50 mm long, 5 μm particle size) maintained at 50 °C. Gradient elution involved a mobile phase of ultrapure water containing 20 mM ammonium formate (A) and pure methanol (B) at a flow rate of 0.6 ml min−1. Analysis was carried out with positive ionization and dynamic multiple reaction monitoring (dMRM) with the precursor ion and product ion of 995.6 (m/z) and 135.2 (m/z), respectively. The calibration curve (Fig. 8) rendered a R2 of greater than 0.99 and a limit of detection of 0.12 ppb for MCLR.
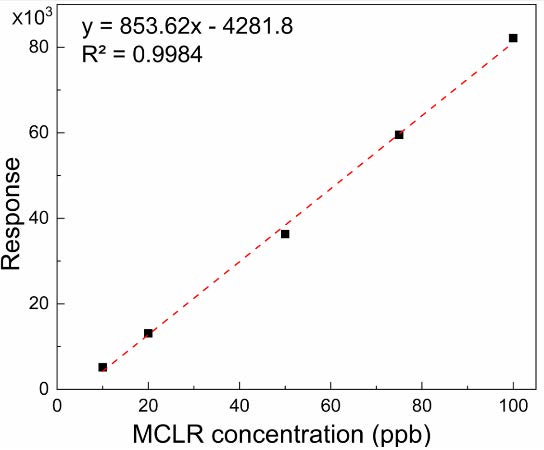
Fig. 8 Calibration curve for MC-LR in water using LC-MS.
2.8. Degradation of MCLR by oxygen NBs
MCLR was dispersed in 100mL oxygen NBs suspension with a final concentration as 50 ppb and sealed for 1 h. 1 ml samples were taken out every 30 mins for LC/MS/MS detection after filtration with 0.23 μM filter. As shown in Fig. 9, significant difference was not detected during the 1-hour treatment. It may because that the concentration of radicals generated in oxygen NBs suspension is not sufficient for MCLR degradation. Therefore, other NBs (e.g., oxygen, air, ozone, nitrogen, and hydrogen NBs) may be applied to achieve the degradation results in the future.
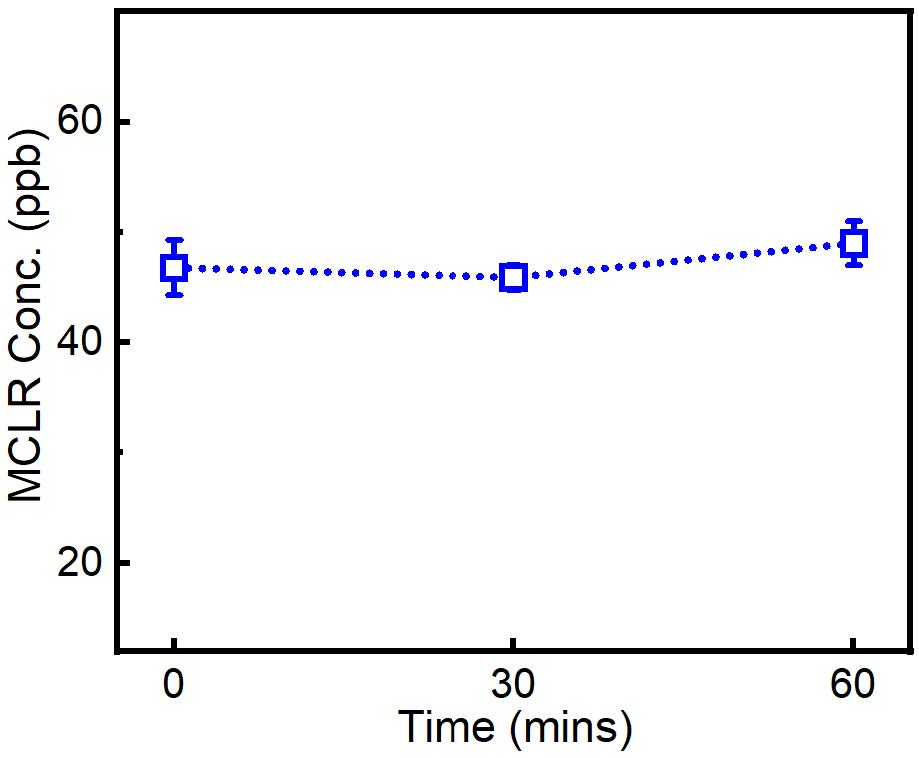
Fig. 9 Calibration curve for MC-LR in water using LC-MS.
2.9. Assessment of Microbial Inactivation by O3/O2 NBs by Colony Counting
In our designed O3 NBs generation system as illustrated in Fig. 9(a), the ozone formation is enabled by irradiating the flowing oxygen gas under 185-nm vacuum UV or VUV to transform molecular O2 into molecular O3. When oxygen bubbles are irradiated with UV185 nm, reactive oxygen species including O3 and O(1D) are formed. Then, the mixture of oxygen and ozone gas will be converted into nanobubbles and dispersed into water through our membrane-based bubbling system as elaborated previously in our research articles.
Fig. 10(b) shows with 5 min of O3 macro bubbles injection, the concentration of E.coli decreased to zero, which is consistent with previous researches employing ozone for disinfection. However, the concentrations of E. coli cells did not change significantly with the continuous injection of O2 and O3 NBs. This may because the ozone concentration in O3 NBs suspension is not high enough for the removal of E. coli cells. The oxidation capacity of O2 NBs was not high enough for the removal of E. coli cells either. Although NBs in general are believed to generate radicals (when bursting or collapsing) the radical levels in our oxygen NB suspension are apparently not high enough to induce strong antimicrobial activity.
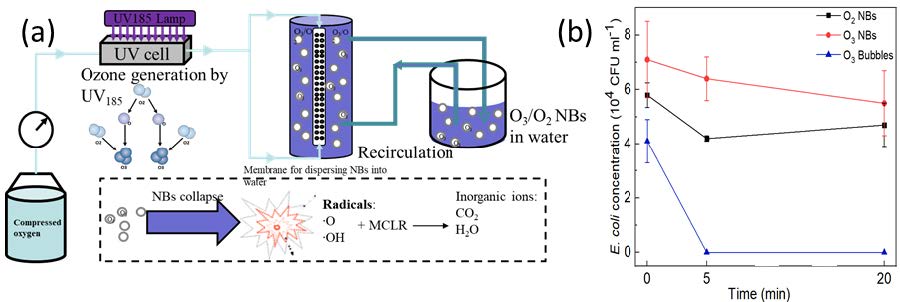
Fig. 10 (a) Schematic of the proposed ozone/oxygen nanobubble generation system. (b) Effectiveness of O2 NBs, O3 NBs and O3 bubbles injection on the concentration of E. coli cells.
2.10. Quality assurance results
This project was primarily operated in Prof. Wen Zhang (PI)’s laboratories at NJIT. Samples are liquid suspension of microalgae and water samples for the analysis of microalgal integrity, algal density, water quality and cyanotoxin level or speciation using different analytical instruments such as LC/MS/MS. The data quality was assessed by the analytical method applicability, repeatability, detection limits and sensitivity of measured target toxin compounds (e.g., microcystin-LR). QA/QC was conducted by regular examination of the calibration, detection limits and sensitivity of different analytical methods. The detection for the concentration of MCLR will still follow the US EPA method 544. Regarding the QA/QC for the potential analytic instruments such as LCMS, we followed the procedure for calibration and performance check, including 1) EPA Method Detection Limit: a method blank to be analyzed with each preparation batch of 20 or fewer samples, and provides exceptions for when this QC check is not applicable. 2) a requirement for a Laboratory Control Sample to be analyzed with each preparation batch of 20 or fewer samples, provides exceptions for when this QC check is not applicable, and discusses specific issues related to multi-analyte tests. 3) matrix spikes to be performed as specified by the method or laboratory customer and contains details as to selection of analytes to be spiked. Criteria for the acceptance of an initial calibration was established (e.g., correlation coefficient or relative percent difference should be less than 10% of the standard values).
3. Evaluation of the technical effectiveness and economic feasibility
Many current water treatment methods of contaminated water are chemical-intensive, energy-intensive, and/or require post-treatment of unwanted by-product formation. Developing green nanobubble (NB)-based water treatment should help reduce or eliminate the use of hazardous disinfectants or chemicals. Specific intellectual merits included 1) providing deeper understandings of colloidal stability and interactions (e.g., aggregation or coalescence mechanisms and kinetics and radical formation) of different NBs under environmentally relevant aqueous conditions; 2) Evaluation of oxidative species generation and the implications on algal and cyanotoxin degradation; 3) assessment of algal cell damage, cell lysis or fragmentation. The information will be useful for developing next-generation HABs control and mitigation technologies and important for establishing the rational design of economically viable NB treatment processes. Therefore, the success of this project will lead to transformative technologies for pollution prevention and control in impaired water bodies such as lakes, rivers, and reservoirs.
4. Discussion of subaward monitoring activities under 2 CFR 200.331(d)
The project results were sent to the USGS NJ Water Science Center (USGS NJWSC) scientists, who provided cross check of the analytical results of algal concentration and cyanotoxin. Additionally, we have shared our research findings and obtained feedback from Passaic Valley Water Commission and New Jersey American Waters at Short Hills in a technical workshop we organized in the fall 2018. We plan to reach out to other local purveyors of water treatment such as North Jersey District Water Supply Commission for potential research collaborations and student education activities (e.g., plant tours).
The PI has also developed and integrated some new course modules related to the chemistry and environmental applications of NBs in the environmental engineering curriculum (ENE 262): Introduction to Environmental Engineering that is taught to sophomore and junior civil engineering students. Moreover, microbiology related to algal disinfection was covered in the graduate core course: Environmental Microbiology (ENE 661).
References:
1. Khaled Abdella Ahmed, A.; Sun, C.; Hua, L.; Zhang, Z.; Zhang, Y.; Marhaba, T.; Zhang, W., Colloidal Properties of Air, Oxygen, and Nitrogen Nanobubbles in Water: Effects of Ionic Strength, Natural Organic Matters, and Surfactants. Environmental Engineering Science 2017.
2. Ahmed, A. K. A.; Sun, C.; Hua, L.; Zhang, Z.; Zhang, Y.; Zhang, W.; Marhaba, T., Generation of nanobubbles by ceramic membrane filters: The dependence of bubble size and zeta potential on surface coating, pore size and injected gas pressure. Chemosphere 2018.
3. Oguz, H. N.; Prosperetti, A., Dynamics of bubble growth and detachment from a needle. Journal of Fluid Mechanics 1993, 257, 111-145.
4. Attard, P., The stability of nanobubbles. The European Physical Journal Special Topics 2013, 1-22.
5. Behkish, A.; Lemoine, R.; Sehabiague, L.; Oukaci, R.; Morsi, B. I., Gas holdup and bubble size behavior in a large-scale slurry bubble column reactor operating with an organic liquid under elevated pressures and temperatures. Chemical Engineering Journal 2007, 128, 69-84.
6. Liu, Y.; Zhang, H.; Sun, J.; Liu, J.; Shen, X.; Zhan, J.; Zhang, A.; Ognier, S.; Cavadias, S.; Li, P., Degradation of aniline in aqueous solution using non-thermal plasma generated in microbubbles. Chemical Engineering Journal 2018, 345, 679-687.
7. Godon, C.; Teulon, J.-M.; Odorico, M.; Basset, C.; Meillan, M.; Vellutini, L.; Shu-wen, W. C.; Pellequer, J.-L., Conditions to minimize soft single biomolecule deformation when imaging with atomic force microscopy. Journal of structural biology 2017, 197, 322-329.
8. Barinov, N. A.; Prokhorov, V. V.; Dubrovin, E. V.; Klinov, D. V., AFM visualization at a single-molecule level of denaturated states of proteins on graphite. Colloids and Surfaces B: Biointerfaces 2016, 146, 777-784.
9. Ishibashi, K.-i.; Fujishima, A.; Watanabe, T.; Hashimoto, K., Detection of active oxidative species in TiO2 photocatalysis using the fluorescence technique. Electrochemistry Communications 2000, 2, 207-210.
10. Xiao, Q.; Si, Z.; Zhang, J.; Xiao, C.; Tan, X., Photoinduced hydroxyl radical and photocatalytic activity of samarium-doped TiO 2 nanocrystalline. Journal of Hazardous Materials 2008, 150, 62-67.
11. Gabrielli, C.; Huet, F.; Keddam, M.; Rousseau, P.; Vivier, V., Scanning electrochemical microscopy for investigating gas bubble/liquid interfaces. Electrochemical and solid-state letters 2003, 6, E23-E26.
12. Lou, S.-T.; Ouyang, Z.-Q.; Zhang, Y.; Li, X.-J.; Hu, J.; Li, M.-Q.; Yang, F.-J., Nanobubbles on solid surface imaged by atomic force microscopy. Journal of Vacuum Science & Technology B: Microelectronics and Nanometer Structures Processing, Measurement, and Phenomena 2000, 18, 2573-2575.
13. Borkent, B. M.; Dammer, S. M.; Schönherr, H.; Vancso, G. J.; Lohse, D., Superstability of surface nanobubbles. Physical review letters 2007, 98, 204502.
14. Tasaki, T.; Wada, T.; Baba, Y.; Kukizaki, M., Degradation of surfactants by an integrated nanobubbles/VUV irradiation technique. Industrial & Engineering Chemistry Research 2009, 48, 4237-4244.
15. Li, P.; Song, Y.; Yu, S., Removal of Microcystis aeruginosa using hydrodynamic cavitation: performance and mechanisms. water research 2014, 62, 241-248.
16. Nakashima, T.; Kobayashi, Y.; Hirata, Y. In Method to exterminate blue-green algae in a large pond and to improve plant growth by micro-nano bubbles in activated water, XXVIII International Horticultural Congress on Science and Horticulture for People (IHC2010): International Symposium on 938, 2010; pp 391-400.
17. Schroth, A. W.; Giles, C. D.; Isles, P. D.; Xu, Y.; Perzan, Z.; Druschel, G. K., Dynamic coupling of iron, manganese, and phosphorus behavior in water and sediment of shallow ice-covered eutrophic lakes. Environmental science & technology 2015, 49, 9758-9767.
Journal Articles on this Report : 3 Displayed | Download in RIS Format
| Other project views: | All 13 publications | 3 publications in selected types | All 3 journal articles |
|---|
| Type | Citation | ||
|---|---|---|---|
|
|
Ahmed AK, Shi X, Hua L, Manzueta L, Qing W, Marhaba T, Zhang W. Influences of air, oxygen, nitrogen, and carbon dioxide nanobubbles on seed germination and plant growth. Journal of agricultural and food chemistry 2018;66(20):5117-24. |
SU839451 (Final) |
Exit Exit Exit |
|
|
Ahmed AK, Sun C, Hua L, Zhang Z, Zhang Y, Zhang W, Marhaba T. Generation of nanobubbles by ceramic membrane filters:The dependence of bubble size and zeta potential on surface coating, pore size and injected gas pressure. Chemosphere 2018;203:327-355 |
SU839451 (Final) SV840019 (2021) |
Exit Exit |
|
|
Shi X, Qing W, Marhaba T, Zhang W. Atomic Force Microscopy-Scanning Electrochemical Microscopy for Nanoscale Topographical and Electrochemical Characterization:Principles, Applications and Perspectives. Electrochimica Acta 2019;14:135472. |
SU839451 (Final) SV840019 (2021) |
Exit Exit |
Relevant Websites:
P3 Phase II:
Development of Reactive Nanobubble Systems for Efficient and Scalable Harmful Algae and Cyanotoxin Removal | 2021 Progress Report | Final ReportThe perspectives, information and conclusions conveyed in research project abstracts, progress reports, final reports, journal abstracts and journal publications convey the viewpoints of the principal investigator and may not represent the views and policies of ORD and EPA. Conclusions drawn by the principal investigators have not been reviewed by the Agency.