
Grantee Research Project Results
Final Report: Monitoring the Air in Our Community: Engaging Citizens in Research
EPA Grant Number: R836187Title: Monitoring the Air in Our Community: Engaging Citizens in Research
Investigators: Cho, Seung-Hyun , Cicutto, Lisa , Hawthorne, Wendy , Crews, Krysten
Institution: Research Triangle Institute , National Jewish Health , Groundwork Denver
EPA Project Officer: Callan, Richard
Project Period: May 1, 2016 through April 30, 2019 (Extended to April 30, 2023)
Project Amount: $749,837
RFA: Air Pollution Monitoring for Communities (2014) RFA Text | Recipients Lists
Research Category: Particulate Matter , Air Quality and Air Toxics , Airborne Particulate Matter Health Effects , Air
Objective:
Overall Goal and Overview of the Study Design: The overall study goal was to prove our hypothesis that communities can use low-cost sensors to understand the air quality in their neighborhood and their personal exposure to pollutants that empowers them to take actions to protect their health. We proposed two specific aims to achieve the goal. Aim 1: Identify audience-specific air quality data presentation needs and preferences to support understanding and interpretation of data. Aim 2: Evaluate the effectiveness of different knowledge translational (KT) approaches for supporting behavior modifications to minimize exposure to indoor and outdoor air pollutants. Our study community is Globeville, Elyria, Swansea (GES), an environmental justice community north of downtown Denver. Our study used a longitudinal study design to collect air quality and personal exposure data between 2018 and 2019 and shared those data with the study community and personal monitoring participants, using multi-faceted approaches to conduct studies to achieve Aim 1 and 2. We used staged KT process with the combination of data access modality, exposure data types (i.e., personal and ambient monitoring data separately and combined), and support to the community in making decision for behavior modification. We have also developed a Community Advisory Committee (CAC) to keep stakeholders informed of project activities and to inform key aspects of this project with participating members from EPA Region 8, City of Denver Environmental Health, American Lung Association of Colorado, Colorado Department of Public Health and Environment (CDPHE), North Denver Cornerstone Collaborative, Regional Air Quality Council and Colorado Department of Transportation (CDOT). The participation of both CDPHE and City of Denver EH members in the air monitoring data sharing and sensor collocation study has been crucial. Their collaborative efforts and contribution to the process have played a significant role.
Summary/Accomplishments (Outputs/Outcomes):
Air and Personal Monitoring: Longitudinal ambient air monitoring study through the low-cost PM sensor network provided valuable air quality measurement data that enable us to characterize dynamic air quality within the GES community. Eighteen monitoring sites within the GES community were selected by CAC, including parks, schools, recreation centers where community members gather, a near-road site at about 10 ft from highway I-25, and one outside the west boundary of GES community. After a pilot monitoring study, 12 out of the 18 sites were finally chosen for the longitudinal study (2018 summer, 2018 fall, and 2018-2019 winter). Two monitors (the near-road site and one outside the west boundary of GES community) were collocated with FEM monitors operated by state government. The study team used RTI MicroPEM PM sensors, a miniaturized nephelometer, to collect real-time PM2.5 concentrations and filter samples simultaneously. The real-time data was later adjusted using gravimetric PM concentration from the filter samples to improve the accuracy.
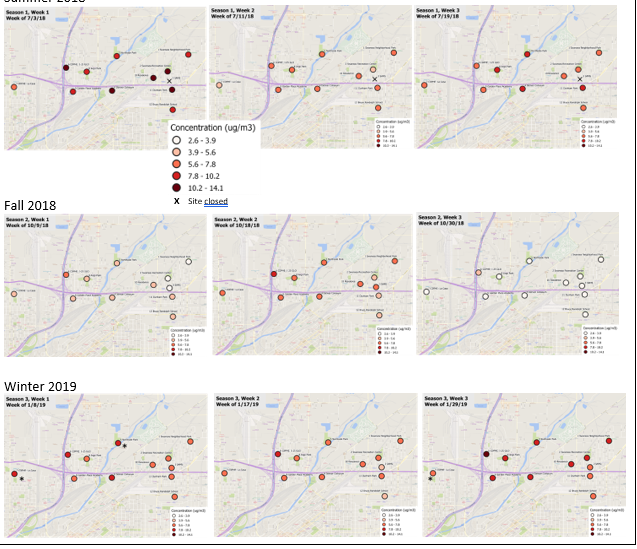
Exhibit 1. Spatio-Temporal Variability of PM2.5 Measured in the GES Community by the Sensor Network
The longitudinal ambient monitoring study data showed spatial and temporal variabilities of PM2.5 concentrations within the ambient air quality monitoring domain with the area of 16 km2. In general, the highest PM levels were measured during the summer, followed by winter and fall, with the difference between summer and fall reaching up to 2.5 times at one site. The near-road site had highest PM levels because of the large volume traffic of two highways crossing the study community. PM levels of sites adjacent to the near-road changed together with the level of near-road sites, indicating significant impact of highway traffic to the study community. In addition, detailed time series data analysis of individual ambient monitoring sites showed there are localized short-term changes from nearby sources such as high peak up to several hundred ug/m3 from July 4th fireworks at the parks. When there was a rain in October 2018, the PM concentrations at all sites drastically decreased.
We also monitored 72-hour personal PM2.5 exposures using MicroPEMs for 19 participants who lived in GES community. They received the ambient air quality and personal exposure data after each monitoring season and at the last season, discussed with the research team and review activities from their time-activity diary to identify high exposure events and associated activities. This one-on-one meeting, which took time and personal support significantly improved participants’ knowledge, confidence and action/behavior change to reduce exposures. Reporting back to the study participants seem to further motivate them to wear monitors for increased duration and provide details on their diaries. For the individuals with high exposure events, shor-term personal levels were up to 24 times higher than nearby ambient sensor levels. Individual’s exposure levels vary by days and are influenced by activities such as cooking, burning candles, being around a smoker, and cleaning in indoor environments. As people spend more time indoors and close the doors and windows in the winter, indoor/outdoor PM exposure ratio was highest in the winter (I/O=2.7) and lowest in the summer (I/O=1.3). This emphasizes the influence of microenvironments and individual’s lifestyle on personal PM exposures.
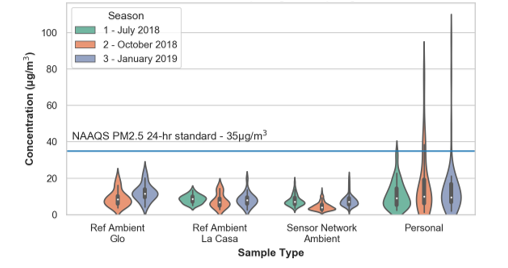
Exhibit 2. Exposure Levels Assessed by Different Sample Types
Preference of Data Outputs for Knowledge Translation: We conducted multiple rounds of focus study to identify preference for data displays and health messaging to be used for knowledge translation materials for the longitudinal study (Aim 1). A total of 50 people participated, representing stakeholder groups of health providers, community organizations, health advocacy organizations and community residents. Various data output formats were developed with multiple types of data presentation (i.e., table, chart) with different color schemes and chart types. We also presented data with different temporal and spatial resolutions to examine events and meteorological conditions such as July 4th fireworks and rainy days and to understand air quality impact of major sources such as highways. The focus group identified features that promoted and/or limited effective communication of sensor data and health messages.
Exhibit 3. Types of sensor data formats considered for prototype data reports and displays
| Resolution | Temporal | Frequency of real-time data Averaged time of post-hoc data (eg, hour, day, night, weekdays vs weekend, season, etc) |
| Format | Spatial Graphic | Individual monitoring sites Entire study area (4x4) Bullseye Themometer Traffic light analogy
|
| Air Quality scale | Actual measurements of ambient concentration in scales of ug/m3 or ppb Relative scale Air qualtiy health index | |
Effectiveness of knowledge translational approaches: We have evaluated effectiveness of our KT approaches by assessing how the knowledge of exposures to air pollutants is translated by the community to take actions to minimize their exposure (Aim 2). Specifically, we measured how the participants identify sources of exposure, develop action plans, and carry out strategies to reduce exposures of concern, and learned what type and level of community support would be needed in the decision-making process. The effectiveness was measured for a) knowledge, b) self-confidence, and c) satisfaction, engagement, and preference for data access modalities.
Knowledge of Particulate Matter (PM) was assessed during visit one (pre monitoring and intervention) and visit four (post monitoring and intervention). Understanding PM is a precursor for interpreting measurements/levels of PM, determining whether or not there are exposures of concern and potential sources of PM, and developing and implementing an action plan to reduce exposure to PM. PM knowledge scores between visit 1 (pre) and visit 4 (post) were compared using Wilcoxon signed rank tests to determine statistical significance. Particulate matter knowledge scores significantly increased from a pre assessment core of 2.5 ± 1.9 to 7.0 ± 0.8 (p<0.0001).
Confidence in ability to interpret and apply PM2.5 measurement data was also assessed pre (visit 1) and post (visit 4) personal environmental monitoring. At pre-assessment, only 22% of participants were confident or completely confident in their ability to know when to be concerned about PM, understand air quality reports about PM, and identify sources of PM. At post-assessment, 94% of participants were confident or completely confident in their ability to know when to be concerned about PM levels, 89% were confident or completely confident in their ability to understand air quality reports about PM, and 89% were confident or completely confident in their ability to identify sources of PM. These improvements were statistically significant at the p<0.0001 level.
Wearability of and satisfaction with the air quality monitor (RTI MicroPEM) were also assessed during the home visits. Throughout the monitoring period, there were no participants who reported they minded wearing the monitor. Participants liked that the monitor was small and lightweight, easy to use, and the options for wearing the monitor on a belt clip/waist band or around the neck. Several participants also found it to be a good conversation starter while wearing the monitor in their community and discussed the monitor with others. Some participants found the monitor to be bulky, uncomfortable to wear when exercising or driving, and found it difficult to remember to carry the exposure diary with them.
The majority of participants identified exposures of concern and potential sources of PM, identified strategies to reduce PM2.5 exposure and implemented the identified activities. Steps identified to reduce PM2.5 exposures included buying a HEPA furnace and/or vacuum filter, using natural cleaners, reducing or abstaining from use of candles, incense, and cigarettes, using a hood, box fan, or opening windows when cooking, avoiding outdoor activity during rush hour or poor air quality days, and keeping windows closed while driving. Most participants felt success in improving ventilation while cooking, keeping windows rolled up while driving, and using the recirculate air mode in their cars. One of the biggest barriers to reducing exposure to PM2.5 was avoiding cigarette smoke. Several participants reported having smokers go outside, but they also reported that this was more difficult in the winter season with cold weather.
We also shared the study results at a community translational event. The event lasted almost 2 hours and was attended by local promotoras. For Satisfaction for the sessions was high. All (100%) of attendees agreed/strongly agreed that the speaker was easy to understand, appeared knowledgeable, and answered questions. All attendees (100%) also agreed/strongly agreed that the session was well-organized, met expectations, and that the handouts supported their learning during the presentation. The majority (83%) agreed or strongly agreed that the session was well paced. Attendees stated that they most liked the personal monitor data and the comparison of PM2.5 levels between GES and other areas of Denver. When asked what they would change, participants indicated they wanted more time, additional information on health effects, and more interactive activities. All attendees (100%) felt the session was very helpful for supporting their understanding of PM and that they were very likely to use what they learned during the presentation.
Supports for Effective Translation: We developed a PM information sheet that explains What is PM2.5, Where does PM2.5 come from?, Why do PM2.5 levels change?, and What are health effects of PM2.5? This educational resource was pilot tested and rated favorably. This was a resource provided during home visits of the personal environmental monitoring study. It is available in English and Spanish. We also developed a high school curriculum on air quality and health together with a local high school and taught a special interest class. We have contributed to EPA’s citizen science and environmental justice program report and websites.
Details of all technical aspects of the project
Low cost sensor data quality: Initially, the study plan involved incorporating NO2 gas sensors into the exposure monitoring process. However, during the commencement of our field study in 2018, we encountered limitations with the available NO2 sensor technologies. Available wearable sensors lacked the necessary accuracy, especially at low concentrations, making their inclusion infeasible. To address this challenge, the research team sought guidance from the EPA and CAC and ultimately decided against using NO2 sensors in the field study. The concern was that inaccurate data would not be beneficial to the community and could potentially raise unnecessary alarm.
Consequently, this technical obstacle prompted us to reflect deeply on the potential impact of new low-cost measurement technologies on the study community. We recognized that such technologies could offer both positive and negative experiences. Therefore, it became essential to communicate the measurement data from low-cost air sensors with utmost care and clarity when engaging with non-technical individuals. This involved explaining the limitations of low-cost sensor technologies, such as accuracy and mechanical breakdown, and providing a clear understanding of uncertainty of measurement data in terms of potential health impacts and varying susceptibilities among individuals.
Personal monitoring: Despite the research team's initial concern about the potential burden that personal monitors might impose on the study participants, it was heartening to discover that the participants themselves highly appreciated the data gathered from these personal monitors. When asked for feedback on the study, they expressed a desire for more time to discuss the data, as well as a need for additional information on health effects, and a request for more interactive activities.
This positive response from the participants clearly indicates that both the communities and individuals involved warmly embrace the use of wearable technologies in environmental health studies. The willingness to engage with these technologies demonstrates their recognition of the value and importance of such data in contributing to a deeper understanding of environmental health impacts.
Project Disruption because of COVID-19: Until COVID-19 pandemic, we have shared the results of our EPA STAR project that was conducted in the GES community at various community meetings. However, due to the elevated risk of COVID-19 infection, all in-person events and knowledge transfer (KT) activities, including the planned Town Hall meeting to present our study findings to the GES community, had to be canceled. This precautionary measure was taken to ensure the safety and well-being of everyone involved. Unfortunately, during this period, the research team also encountered challenges in maintaining the project's field staff due to lack of project work.
Conclusions:
Project evaluation
Technical effectiveness and economic feasibility of the study method: The data collection completion rates have improved during the first season (from 75% to 98%). This was supported by modification of ambient monitoring platform configuration for easy deployment and field team’s improved skills for monitor operation and data/sample collection.
Study’s value for environment and human health improvement:
The sensor network's ambient PM data played a crucial role in quantitatively evaluating the variations in air quality over time and across different locations. Through this data, the research team, along with the CAC and study participants, gained valuable insights into the disparities in PM2.5 levels between GES and other regions within Denver. Moreover, the data emphasized the significant impact of traffic-related PM from two major highways on the overall air quality in GES, identifying it as a major source of PM in the area.
The study team shared the personal monitoring data in a readily understandable format, enabling study participants to gain new insights into potential PM sources. These insights further empowered them with strategies to reduce their exposure to PM2.5. As a result, the participants were able to implement the identified activities effectively, leading to concrete actions in their efforts to mitigate PM exposures.
Our KT activities involved engaging with community members through a range of events and environmental health class modules specifically designed for high school students. These efforts extended the benefits of the project beyond the study participants, reaching out to the broader community and raising awareness about local air quality and environmental health.
The methodology and outcomes derived from our study hold significant value for other research teams and communities. They can serve as valuable resources to design their air quality monitoring and environmental health studies more effectively. The insights gained from our research can aid in enhancing the understanding and approach towards addressing air quality-related concerns in various settings, benefiting a broader range of stakeholders and contributing to overall environmental health efforts.
Journal Articles:
No journal articles submitted with this report: View all 17 publications for this projectSupplemental Keywords:
Air quality, air sensor, particulate matter, exposure, personal monitoring, health effects, citizen science, environmental health literacy, environmental justice community, actionable knowledgeRelevant Websites:
EPA’s story map on citizen science Exit , Denverites likely encounter the worst air quality inside their own homes Exit
Progress and Final Reports:
Original AbstractThe perspectives, information and conclusions conveyed in research project abstracts, progress reports, final reports, journal abstracts and journal publications convey the viewpoints of the principal investigator and may not represent the views and policies of ORD and EPA. Conclusions drawn by the principal investigators have not been reviewed by the Agency.