
Grantee Research Project Results
2016 Progress Report: Air Quality Observatory
EPA Grant Number: R835873C002Subproject: this is subproject number 002 , established and managed by the Center Director under grant R835873
(EPA does not fund or establish subprojects; EPA awards and manages the overall grant for this center).
Center: Center for Air, Climate, and Energy Solutions
Center Director: Robinson, Allen
Title: Air Quality Observatory
Investigators: Presto, Albert , Robinson, Allen , Apte, Joshua S. , Millet, Dylan B
Institution: Carnegie Mellon University , University of Minnesota , The University of Texas at Austin
EPA Project Officer: Chung, Serena
Project Period: May 1, 2016 through April 30, 2021
Project Period Covered by this Report: May 1, 2016 through April 30,2017
RFA: Air, Climate And Energy (ACE) Centers: Science Supporting Solutions (2014) RFA Text | Recipients Lists
Research Category: Air , Climate Change
Objective:
The primary aim of this project is to collect and analyze air quality observations to characterize spatial (intra-city, urban-to-rural, and inter-city) and temporal distributions of multiple air pollutant species in three cities. The project has three core objectives: (1) identify determinants of spatial and temporal patterns in outdoor concentrations for a wide range of pollutants (CO, NO, NO2, O3, PM2.5 mass and composition, ultrafine particles) within and between regions and modifiable factors driving these differences; (2) locally evaluate national-scale models of air pollution using a new, independent dataset of measurements with high spatiotemporal precision for multiple pollutants; and (3) develop a mechanistic understanding of how physicochemical pollutant transformations affect ambient concentrations over exposure-relevant spatial and temporal scales (seconds to days, ~10 m – 100 km).
Progress Summary:
The first year of sampling has been conducted in Pittsburgh. The sampling involves a combination of fixed site monitors with mobile monitoring. The fixed site monitoring includes a central supersite located on the Carnegie Mellon University (CMU) campus. This site has been in continuous operation since July 2016. We are also using a set of movable, distributed monitors to supplement the supersite. The movable monitors include a lower-cost real-time affordable multi-pollutant (RAMP) instrument for measuring CO, CO2, NO2, SO2, O3, and PM2.5. Some of the movable, distributed monitors also included a condensation particle counter (CPC) and BC measurement. During the last project period, we deployed the distributed monitors to investigate two case studies: an urban-rural transect and a downtown, high traffic, steep street canyon. The mobile laboratory is equipped with a suite of standard gas and particle monitors, including an aerosol mass spectrometer (AMS) to measure non-refractory particle composition.
RAMP performance and calibration
A major effort during the last project period was evaluation of the lower cost RAMP monitors. Prior to deployment, the RAMPs were tested via co-location with the supersite on the CMU campus and through laboratory calibration. We developed and evaluated three calibration strategies: a standard laboratory calibration; an empirical ambient calibration using a multi-linear regression that included sensor voltage, temperature, and relative humidity (RH) as independent variables; and a machine-learning based calibration. The machine learning algorithm performs the best, and highlights the importance of calibrating the sensors as a package rather than standalone units. In addition to developing a calibration algorithm, we also investigated the minimum co-location period required for developing effective calibrations. A 4-week co-location period prior to deployment seems to provide sufficient data for calibration model building.
Case Studies
The initial deployment of the 10 distributed samplers was to investigate air quality along an urban-rural transect stretching from southwest (upwind) of Pittsburgh to northeast (downwind). Figure 2.1 shows box plots of CO, NO2, and O3 along the transect sites. We observe some site-to-site variability, but it is limited by the fact that many of the transect sites are urban or suburban background. Site 110 was located close to a highway, and shows expected increases in CO and NO2, and concomitant O3 titration. Analysis of the typical diurnal cycles at this site reveal expected trends driven by traffic, such as daily CO peaks during the morning and evening rush hours.
The transect measurements, in addition to having their own intrinsic value, represent the first deployment of RAMPs for use in pollutant monitoring. Thus, this case study was an important proving ground for the RAMP sensor package and for our calibration methods.
A second case study was conducted during the winter of 2017 in the downtown Pittsburgh central business district. This is an area characterized by high traffic volumes and narrow street canyons. Preliminary analyses show large variations in black carbon (BC) and cooking aerosols within this small (~3 km x 3 km) domain.
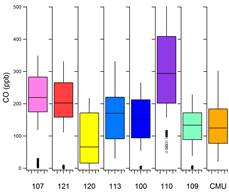
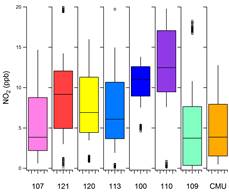
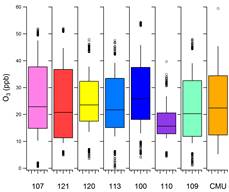
Figure 2.1 Box plots of CO, NO2, and O3 along the urban-rural transect. The x-axis labels are RAMP numbers, and are organized from southwest (upwind) to northeast (downwind).
Mobile sampling
Mobile sampling campaigns were conducted to support the case studies. The mobile sampling was designed to cover the same spatial extent as the stationary sampling. In most cases, we drew a ~1 km2 polygon around each stationary sampler (both the transect and downtown case studies) and then raster the streets within the polygon. This allows us to characterize the spatial variability in close vicinity to the stationary monitors. Mobile data are spatially joined into predefined grids using 33 m, 100 m, 200 m, and 1 km meshes to investigate different spatial scales for data aggregation.
One common feature of the AMS data collected by the mobile laboratory is the presence of high concentrations of organic aerosol (e.g., plumes) in areas of high restaurant density. Figure 2.2 shows several Pittsburgh neighborhoods with these cooking plumes, which are contrasted with data collected on a highway. Organic aerosol concentrations on the highway are not significantly elevated above the urban background, whereas the restaurant plumes can be a factor of 10 or more higher than background concentrations and can persist for several hundred meters.
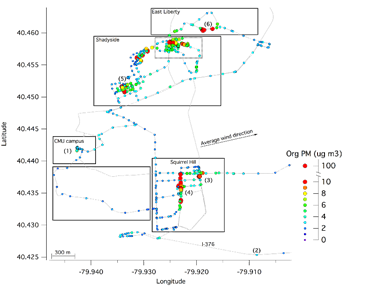
Figure 2.2. Organic aerosol concentrations from one typical night of mobile sampling. Sampling started at the CMU campus (location 1) and continued through various neighborhoods. High concentration plumes were often observed in areas with high restaurant density, but concentrations were near background on a highway (I-376, bottom of the map).
Using the AMS data we can quantify the impact of different sources using source apportionment. Analysis of the AMS data using positive matrix factorization (PMF) reveals two primary emissions sources (cooking and traffic) and two classes of secondary organic aerosol. Preliminary source apportionment reveals high cooking organic aerosol concentrations in areas with high restaurant density. These cooking hot spots can occur in neighborhoods with relatively little other source activity (e.g., low traffic areas). Even in high traffic areas such as Pittsburgh downtown (center of the map), cooking OA is more abundant than OA emitted by traffic.
We are also operating the AMS to collect data in single particle mode. This allows determination of PM composition on a single-particle basis. The single particle mass spectra have been separated using a clustering algorithm. The clusters reflect similar sources as the PMF analysis shown above: traffic, cooking, secondary organic aerosol, and secondary inorganic aerosol. The single particle data allow us to probe particle mixing state, especially in near-source regions. Cluster analysis reveals different particle mixing sates in different microenvironments. For example, in a suburban park, particles are largely internally mixed and dominated by the secondary sulfate cluster. However, in near source regions, we observe fresh emissions of traffic and cooking particles that are externally mixed from the regional background PM. Our analyses reveal that the population of particles (e.g., their size, mixing, and composition) is significantly different near roadways than far from roads. This combination of changes may help explain some of the poor health outcomes associated with high traffic exposures that are not explained by PM mass alone.
Future analysis will use the single particle data to develop exposure maps of particle mixing state. We can also use this data to probe near-source dynamics of fresh emissions to determine the relative importance of evaporation, condensation, and coagulation near sources.
Future Activities:
We plan the following activities for the next year.
- Completion of mobile sampling in Oakland, CA (August 2017)
- Completion of Pittsburgh data collection. We will complete the routine data collection slated for Pittsburgh by the summer of 2018. We will use the fall of 2017 to analyze data and to collect additional data in the form of two experiments inspired by our results to date.
- Special experiment #1: Measurement of emission factors from restaurants. Our mobile AMS data identify cooking emissions as a major source of hot spots and exposure gradients. We will perform targeted measurements to quantify PM emissions from restaurants. Our restaurant emissions data will be useful both for this project and modeling in Project 1.
- Special experiment #2: UFP variations in micro-environments. We will conduct targeted experiments in one or two micro-environments to quantify variations in particle number. We are still planning this experiment, but the initial plan is to deploy the full suite of CPCs in a small area and collect highly spatially resolved concentrations near sources.
- Dissemination: Presentation. Results will be presented at the 2017 Gordon Conference for Atmospheric Chemistry, AAAR, and ISES conferences, as well as other venues as appropriate.
- Dissemination: Publications. Multiple manuscripts are in various stages of preparation. Two manuscripts described below will be submitted during summer 2017.
- Measurements in Austin. We will prepare for measurements in Austin in 2018.
Journal Articles:
No journal articles submitted with this report: View all 3 publications for this subprojectSupplemental Keywords:
Atmosphere, mobile sources, exposure, VOC, aerosol, PM2.5, metals, organics, elemental carbon, ultrafine particles, monitoringRelevant Websites:
The Center for Air, Climate, and Energy Solutions Exit
Progress and Final Reports:
Original AbstractMain Center Abstract and Reports:
R835873 Center for Air, Climate, and Energy Solutions Subprojects under this Center: (EPA does not fund or establish subprojects; EPA awards and manages the overall grant for this center).
R835873C001 Mechanistic Air Quality Impact Models for Assessment of Multiple Pollutants at High Spatial Resolution
R835873C002 Air Quality Observatory
R835873C003 Next Generation LUR Models: Development of Nationwide Modeling Tools for
Exposure Assessment and Epidemiology
R835873C004 Air Pollutant Control Strategies in a Changing World
R835873C005 Health Effects of Air Pollution and Mitigation Scenarios
The perspectives, information and conclusions conveyed in research project abstracts, progress reports, final reports, journal abstracts and journal publications convey the viewpoints of the principal investigator and may not represent the views and policies of ORD and EPA. Conclusions drawn by the principal investigators have not been reviewed by the Agency.