
Grantee Research Project Results
Final Report: Taking it to the Streets: Green Infrastructure for Sustainable Philadelphia Communities
EPA Grant Number: R835558Title: Taking it to the Streets: Green Infrastructure for Sustainable Philadelphia Communities
Investigators: Ballestero, Thomas P
Institution: University of New Hampshire
EPA Project Officer: Packard, Benjamin H
Project Period: October 1, 2013 through September 30, 2017 (Extended to September 30, 2020)
Project Amount: $992,759
RFA: Performance and Effectiveness of Green Infrastructure Stormwater Management Approaches in the Urban Context: A Philadelphia Case Study (2012) RFA Text | Recipients Lists
Research Category: Watersheds , Water
Objective:
(1) Project activities over the entire period of funding, describing the recipient's achievements with respect to the stated project goals and objectives (outputs/outcomes).
The ultimate goal of this project was to build municipal capacity in the Greater Philadelphia urban watershed for Green Stormwater Infrastructure (GSI) by engaging local and regional stakeholders in a planning and implementation process supported by science-based resources and up-to-date relevant technical information. This process stressed the social/interpersonal context of advancing GSI by recognizing that the adoption of new technologies is a process that requires peer-to-peer interactions, demonstrations, and ownership of methods and practices. Activities performed over the seven-year project performance period (2013 – 2020) included: planning activities, design and construction of green stormwater management systems, and monitoring stormwater systems.
Summary/Accomplishments (Outputs/Outcomes):
Achievements
- QAPP completed for project activities
- Involvement with community groups, school administrations, staff and students at Philadelphia elementary schools (Chester Arthur and Tanner Duckrey), The Big Sandbox (NGO), School District of Philadelphia, Philadelphia Water Department (PWD), university students (University of New Hampshire, Iowa State, University of Colorado at Denver) and local consulting firms (AECOM, SALT Design Studio, Ian Smith Design Group, Peer Environmental).
- Six Stormwater systems constructed at Chester Arthur Elementary School: porous asphalt, subsurface detention (two), bioretention system, hydraulic controls with snout and Flexstorm (2), and green inlets (2).
- Construction of two PWD tree trench designs with different inlet hydraulics
- Draft plans for management of onsite and right-of-way stormwater management at Tanner Duckrey Elementary School
- Stormwater management concepts for: Anna B. Day Elementary School, Eleanor C. Emlen Elementary School, Gideon Elementary School, Charles W. Henry Elementary School, Henry H. Houston, John S. Jenks Elementary School, Anna L. Lingelbach Elementary School, George G. Meade Elementary School, Robert Morris Elementary School.
- Assessment of hydraulic design configurations of the Philadelphia Tree Trench
- Critical assessment of the long-term performance of permeable pavements and the importance of maintenance
- Technical memos on permeable pavement infiltration, maintenance of permeable pavements, infiltration (sidewall)
- Design guidance, design review, and implementation of four green stormwater infrastructure systems at the Chubb Hangar, Northeast Philadelphia Regional Airport
- Watershed impacts of GSI
(2) Complete details of all technical aspects of the project--both negative and positive--the recipient's findings, conclusions, and results, including the associated quality assurance results.
2.A Chester A. Arthur Elementary School
In 2014 PWD introduced the University of New Hampshire Stormwater Center (UNHSC) to the Parent-Teacher Organization, The Friends of Chester Arthur (FoCA). FoCA applied for and was awarded a Stormwater Management Incentives Program (SMIP) grant from PWD. These grants partially fund stormwater improvements on non-City property with the intent of helping the City meet its obligations to reduce combined sewer overflows. FoCA was successful in significant additional fundraising including:
- $10,000 from the Children's Hospital of Philadelphia
- $110,000 Neighborhood Transformation Initiative (NTI) grant from the City of Philadelphia with the help of Councilman Johnson
- $175,000 in matching funds from the School District of Philadelphia
- $232,000 Stormwater Management Incentives Program (SMIP) grant from the Philadelphia Water Department
- $1,100,000 grant from the William Penn Foundation FoCA
- Local donations
Of this entire amount raised, approximately $500,000 was for the stormwater improvements that managed 48,588 ft2 of on-site impervious area and 17,620 ft2 from the immediately adjacent street network. The University of New Hampshire Stormwater Center (UNHSC), under the auspices of the US EPA STAR award, would perform all aspects of the stormwater designs for the Chester Arthur project. FoCA performed a competitive bid for the landscape architectural services and hired Salt Design Studio. The UNHSC worked collaboratively with Salt Design Studio with the objective of meeting the land surface user aspects without penalizing or limiting these uses to make way for stormwater infrastructure. This means that GSI for schoolyard projects such as this either minimizes the surface requirements for GSI or the GSI also meets other land surface needs, for example staff parking. Various meetings between all stakeholders were held from 2014 through early 2016. UNHSC prepared design reports, design plans, and bid documents. The project was put out for competitive bid and then constructed summer/fall 2016. The existing schoolyard at the start of the project is depicted in Figure 1, and was almost entirely impermeable asphalt, including teacher parking. Figure 2 depicts architectural and stormwater concepts, Figure 3 the porous asphalt and bioretention systems, and Figure 4 a rainfall event.
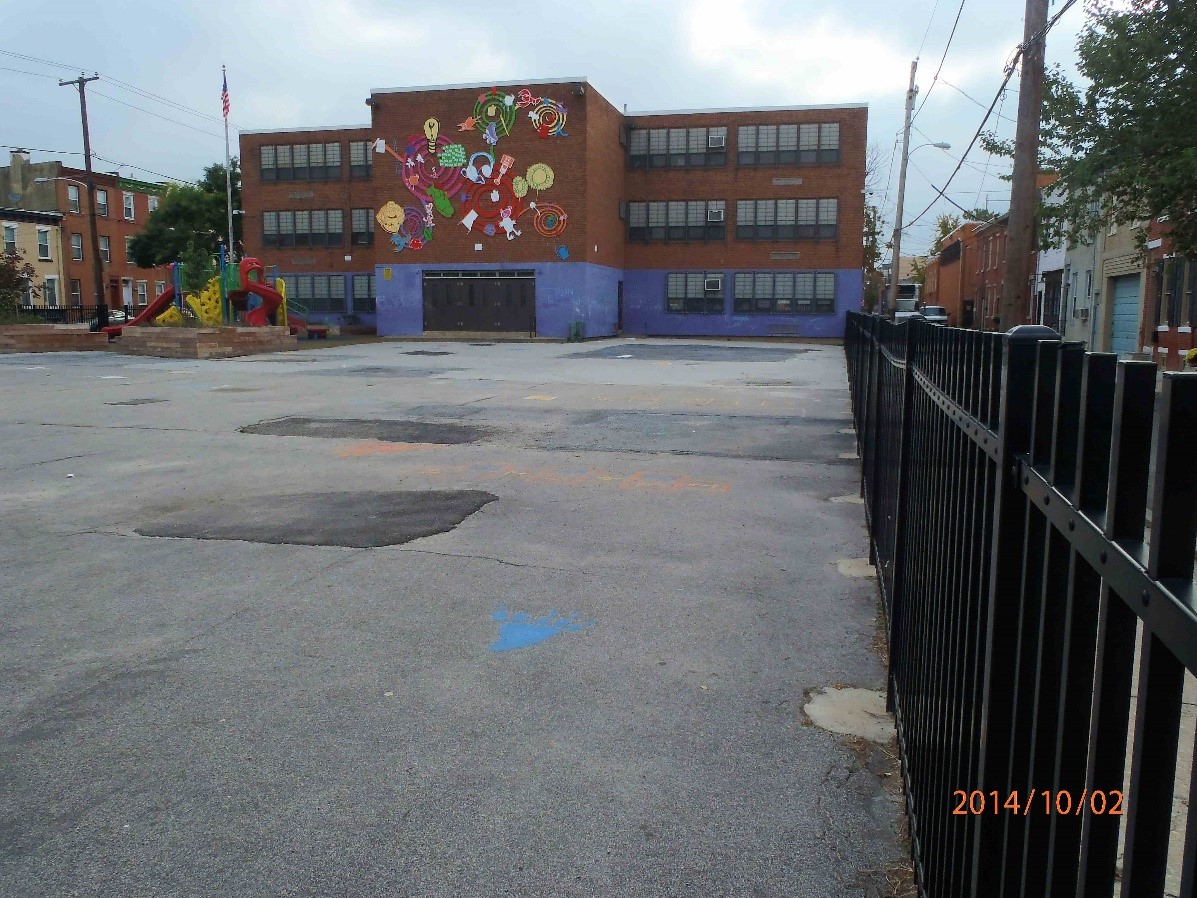
Figure 1. Pre-existing Chester Arthur Schoolyard.
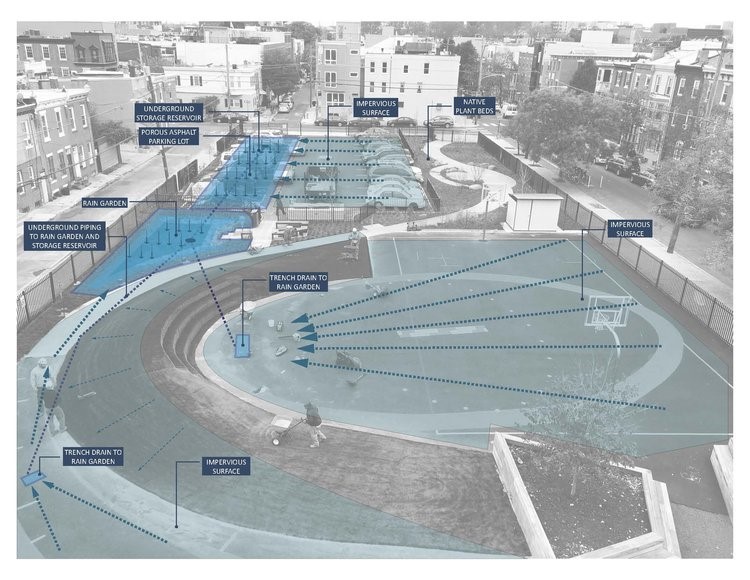
Figure 2 Chester Arthur architectural and stormwater concepts
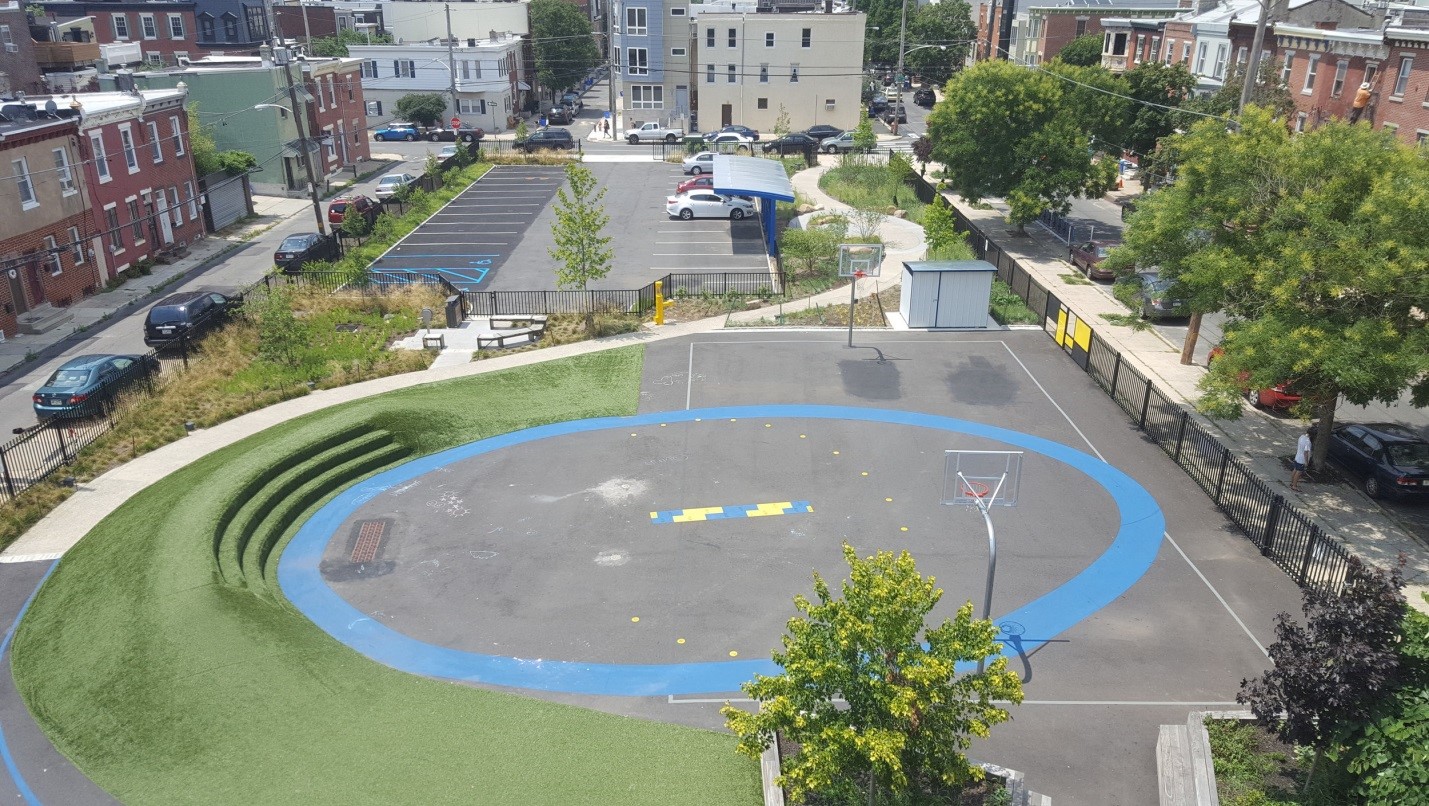
Figure 3. Completed schoolyard including porous asphalt and bioretention system
Upon completion of the project a weather station Figure 4) and site monitoring system were installed. The weather system was designed such that staff and students could download via the school’s wifi system. The porous asphalt had four monitoring locations (wells), the bioretention system one, and at the site storage shed, barometric pressure. Data collected at the site since project construction indicates 100% infiltration of precipitation. This is in large part due to the urban fill (mostly bricks from the former site row homes) that occupy the site. This urban fill is very permeable compared to the native soil below the GSI systems. Borehole infiltration tests at depths of 5 to 9 feet, at the base of the GSI systems, indicated very little infiltration capacity in the native soils. This fact required static sizing of the stone reservoir to hold the entire volume of the runoff from 1.5 inch of precipitation.
By design all site drainage either directly enters the porous asphalt (Figure 5) to a stone reservoir below, or through subsurface plumbing (street green inlets, bioretention system) to this same stone reservoir. This stone reservoir was statically sized to hold runoff from 1.5 inches of precipitation over the watershed areas. The primary exodus for water in the stone is via infiltration, however it was planned to be a small orifice drilled into the underdrain endcap. As with prior PWD experience, these statically-sized systems often drain without drilling the underdrain orifice hole. By suggestion from PWD, the orifice hole for the Chester Arthur system was not drilled to observe performance, and if the system was not draining between storms, it would be drilled in the future. If the stone reservoir fills to a depth of 3.5 feet, then water overflows the weir wall in the inlet catch basin and goes directly to the combined sewer in the street. In the 4 years of monitoring the site, the water depth in the stone has never exceeded 1.5 feet. Because of the low permeability of the soil below the stone reservoir, the majority of the infiltrated water moves laterally into the urban fill surrounding the stone reservoir. Figure 6 displays precipitation and stone reservoir data for a storm that occurred from 12-13 October 2017. Here, 0.46 inches of precipitation fell and the water level in the stone reservoir peaked at 0.042 feet (half an inch) and then receded.
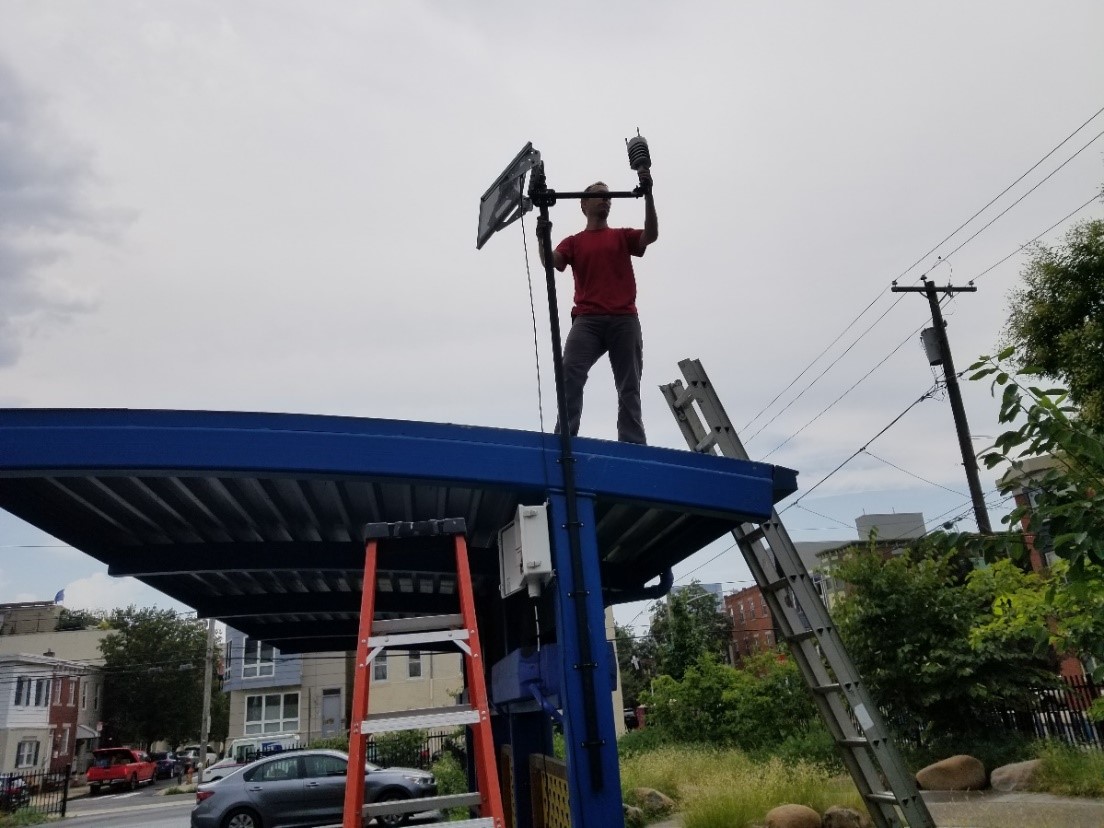
Figure 4. Installation of the Chester Arthur weather station
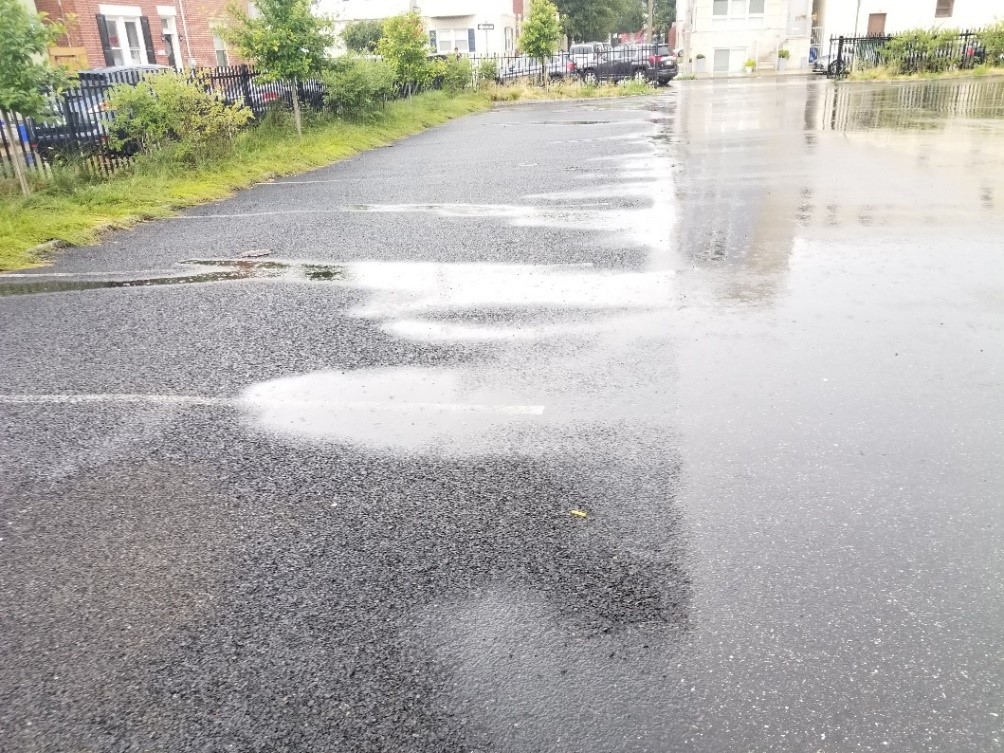
Figure 5. Runoff from impermeable asphalt on to the porous asphalt
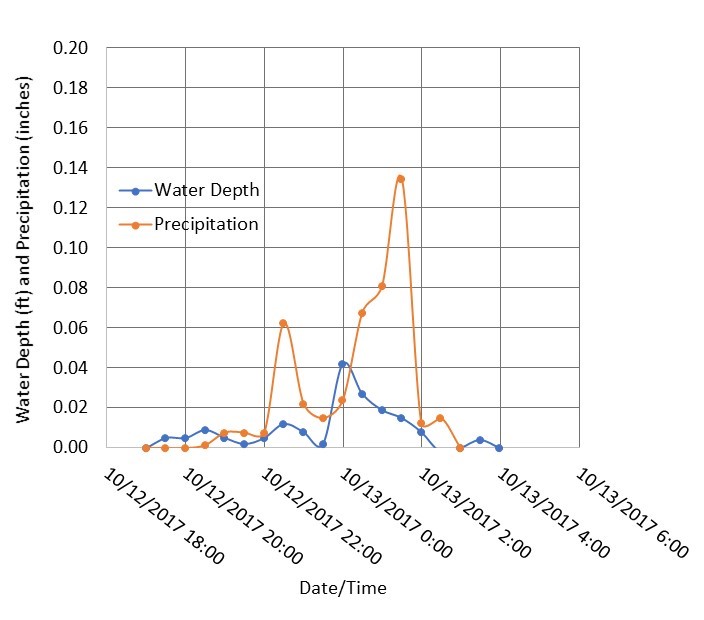
Figure 6. Precipitation and Porous asphalt stone reservoir history for 12 October 2017 event
Important Results
- The design was one of the first to go through the PWD design review protocols. At the outset of this research, the PWD contacts integrated with all the EPA STAR Philadelphia stormwater efforts wanted “innovation”. Therefore, our initial designs offered such innovations, such as the location of the inlet pipes to stone reservoirs (PWD design guidance at the time had them at the bottom of the stone, and UNHSC experience located them at the top). This was rejected by the initial design review because it did not subscribe to the PWD design guidance. In addition, from the outset we asked if PWD maintenance could be involved in the design review process. We were told that occurred after the designs were approved, and that was the next step. After the initial designs were approved, maintenance review rejected the designs and we had to start the process over. Since that time, the PWD design guidance on the location of the stone reservoir inlet pipe has changed (now at the top of the stone). In addition, the design review process changed: now PWD maintenance is involved with all design review phases.
- As with many urban regulatory bodies, PWD has specific design requirements for stormwater systems. In many instances regulatory criteria, guidance, or requirements do not reflect full understanding of system performance, but rather past, generic experience or logic. For example, PWD, as with almost all other similar agencies across the country, require field measurements of soil permeability in the design of infiltration systems. These requirements and design standards only accept vertical infiltration measurements at the bottom of the systems (“the receiving layer” as it is also known) and do not recognize that significant infiltration may occur laterally out the sidewalls of systems. This is particularly meaningful in system sizing: if there is low bottom infiltration capacity the system is statically sized to hold the full design runoff volume. If there is acceptable bottom infiltration capacity, the systems may be sized much smaller. When reflecting on the sheer number of these systems being designed across this country, the savings from just this one design facet could be in the billions of dollars. Here, by measuring and recognizing the capability for lateral infiltration, many systems could be sized and constructed significantly smaller.
- Many site owners have blinders when it comes to maintenance: they may halfheartedly agree to it in the design phase, but completely ignore it after systems are installed. Although PWD recognizes that the stormwater systems they permit on non-City properties will require regular inspection and maintenance, it is not evident that such maintenance will actually occur. In the City, there are private contractors who could be contracted to perform such maintenance. At the same time PWD is the most qualified to perform such maintenance as they already possess the equipment, the personnel, and the capacity. This shall be a challenging road ahead, but there may need to be a carrot or stick approach to addressing private property GSI maintenance in the future. The carrot could be reduction of “rain tax” assessments on properties. The stick would be along the lines of the City either performing the inspection/maintenance or subcontracting it and then charging the property owner. But this aspect of stormwater management does need to be addressed.
- Six stormwater management systems were designed and constructed to manage property and right-of-way runoff.
- The project won an Excellence in GSI Award (2019) from the Sustainable Business Network of Greater Philadelphia.
2B. Tanner Duckrey Elementary School
The University of New Hampshire Stormwater Center (UNHSC) was introduced to The Big Sandbox (TBS) by PWD as one component of the EPA STAR efforts to collaborate with local entities to improve stormwater management in the City. TBS is a non-governmental organization (NGO) that encourages comprehensive schoolyard planning in a holistic approach that includes physical and academic education to address the social and emotional growth of children. TBS approached numerous Philadelphia schools about redeveloping their schoolyards. The fundamental approach to the schoolyard redesigns were to create more natural environments for students while meeting many of the other school needs such as, staff parking, morning line-up, access for delivery vehicles, and stormwater management. In the City of Philadelphia, the School District of Philadelphia (SPD) is a separate, independent entity from the City itself.
Summer 2016 TBS and UNH visited over one dozen Philadelphia elementary schools. TBS had already been engaged with these schools to redevelop their schoolyards. At that time, none of the schools had funding for such improvements let alone the stormwater management. UNHSC was to assist with stormwater management concepts and assist with a SMIP grant application for those schools that could meet the matching funds requirements of the SMIP grant. Funding was and is the most challenging aspect to redevelopment of any property, especially Philadelphia schools. Since the School Department of Philadelphia is not a City entity and therefore schoolgrounds are not City property, SDP is essentially viewed as if it were private property. In total, SPD lands represent almost 2% of the impervious surfaces the City needs to “green” to meet the obligations of its Consent Agreement. One school seemed to have aggregated various funding sources: Tanner G. Duckrey Elementary School (Figure 7). At this writing, funding sources for the Duckrey project include: the Philadelphia Authority for Industrial Development (PIDC), the Pennsylvania Redevelopment Assistance Capital Program (RACP), SDP, PWD, and the Commonwealth of Pennsylvania.

Figure 7. The Tanner Duckrey Elementary School
In spring 2017 the UNHSC began efforts to design stormwater management aspects at the redevelopment of the Duckrey Elementary School, much as UNHSC did at Chester Arthur Elementary School. The Duckrey school occupies a full City block of approximately 5 acres with impervious area covering most of that (approximately 4.8 acres), depicted in Figure 8. Existing stormwater management was to drain runoff offsite as quickly as possible to the combined sewer north of the site under Susquehanna Street. Onsite green stormwater management would be able to capture 2.7 acres of impervious area runoff. PWD is interested in also managing nearby right-of-way (ROW) drainage on this property as well (approximately 4.5 acres of impervious area). PWD had already drafted concepts for a large bioretention system in the northwest property corner where presently sit tennis courts in disrepair. Local residents and school personnel were more interested in there being more usable, recreational space, which is in competition with any aboveground stormwater management practice, such as a bioretention system. Also, residents and school personnel were concerned that the bioretention system would collect significant gross solids (trash), much as some of the existing property green space does now. After various meetings that included PTA members, school personnel, SDP, PWD, funding agencies, local politicians, and the design team, TBS developed a conceptual landscape plan (Figure 9) and UNHSC initially developed two fundamental systems for onsite and ROW stormwater: bioretention and subsurface gravel storage (Figure 10). As designs, partners, and site use evolved (Figure 11), the most recent designs include tree filters, bioretention, treatment swale, and subsurface gravel filter.
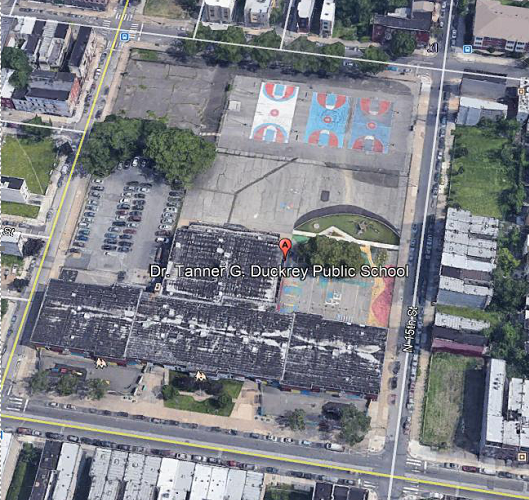
Figure 8. Land use and impervious surfaces at Duckrey Elementary
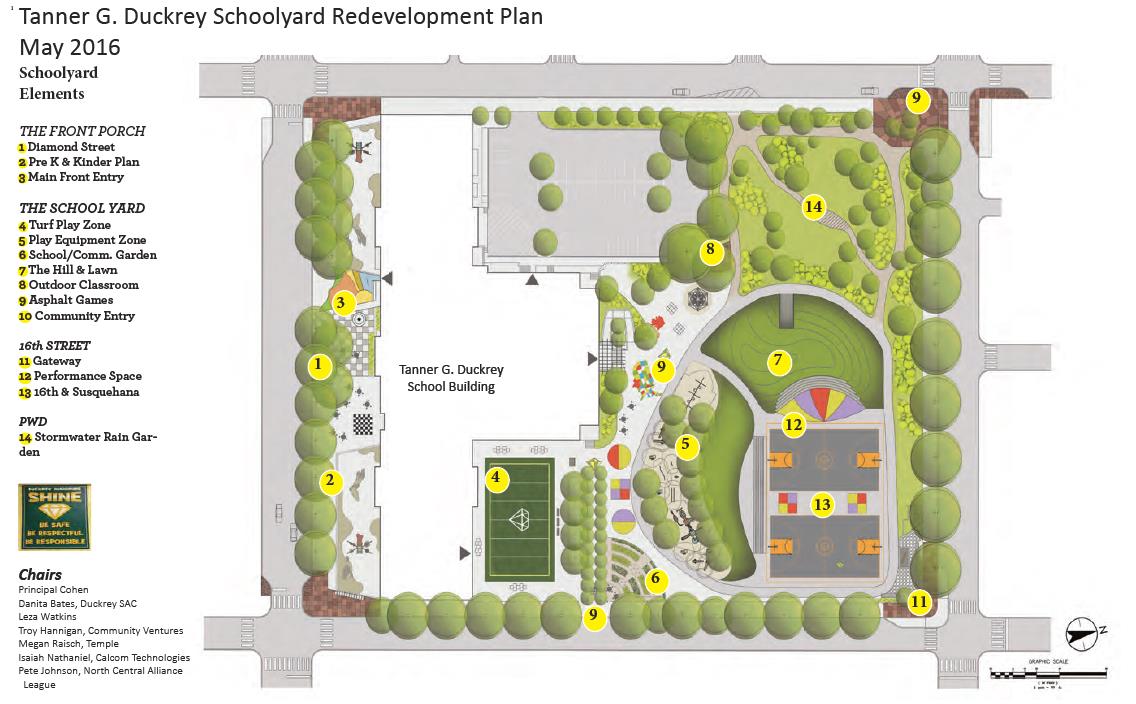
Figure 9. Landscape plan for Duckrey Elementary School
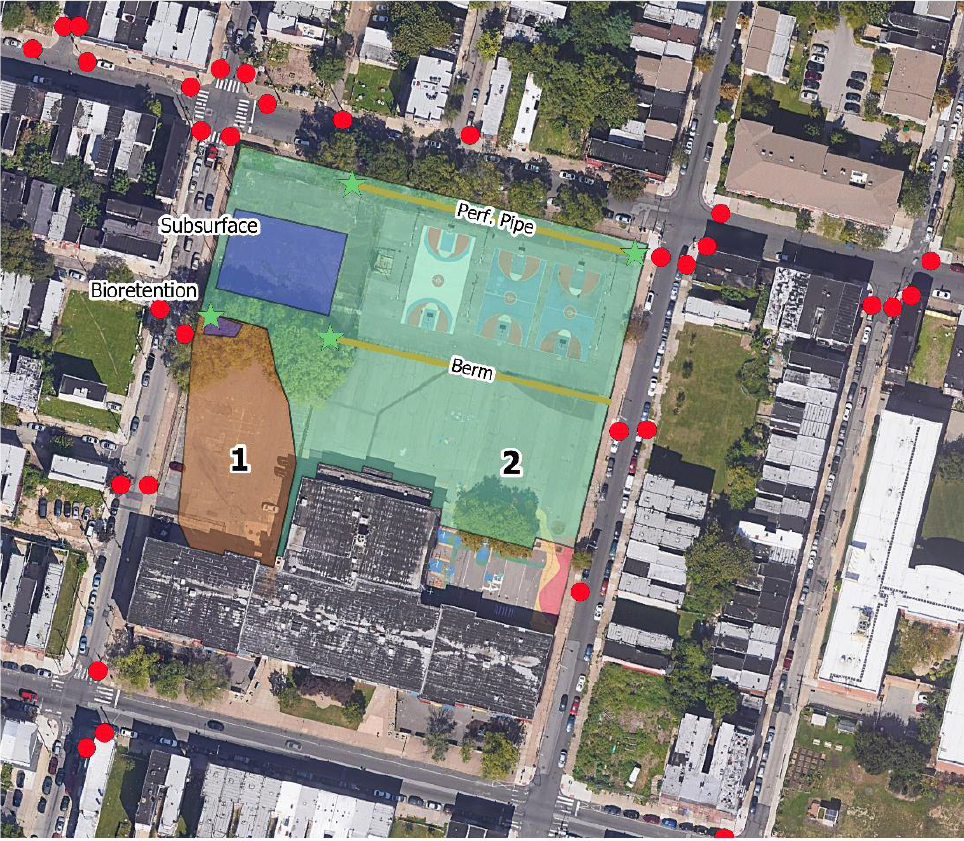
Figure 10. Stormwater systems for onsite runoff.
At this writing, the project is stalled due to funding, partnering, and agreement aspects. All involved stakeholders desire to move the project to completion, however the details take significant discussion, modification, and revision.
Important Results
- As the number of entities involved in a project increases, the project timeline increases almost exponentially.
- Many entities enter the project with a singular focus or objective. This can make it challenging to reach consensus when entities are reluctant to make concessions or modify expectations.
- There are enormous opportunities for schoolyard redevelopments which present benefits to the environment, the schools, the children, and the surrounding community.
- Nine stormwater systems are presently designed for the Duckrey Elementary School site.

Figure 11. Latest design concepts for Duckrey Elementary School.
2C. Chubb Hangar at Northeast Philadelphia Airport
In 2016 the UNHSC began collaborating with AECOM in the site development of a new hangar for Chubb INA Holdings, Inc. at the Northeast Philadelphia Airport. Prior to the UNHSC involvement, the initial stormwater management at the site was proposed to be a detention pond, which was rejected by PWD. It was at that time that AECOM reached out to the UNHSC to provide guidance and technical support for GSI at the site. The revised UNHSC stormwater management conceptual designs included GSI such as: porous asphalt, rooftop infiltration, and bioretention systems (two) (Figure 12). The stormwater systems were constructed in 2018 (Figure 13). One challenge in the design phase was the PWD requirement to separate the systems below the ground. That is, rooftop and porous asphalt GSI systems required separate gravel storage layers. There does not seem to be a rational for this requirement and it significantly increases construction costs.
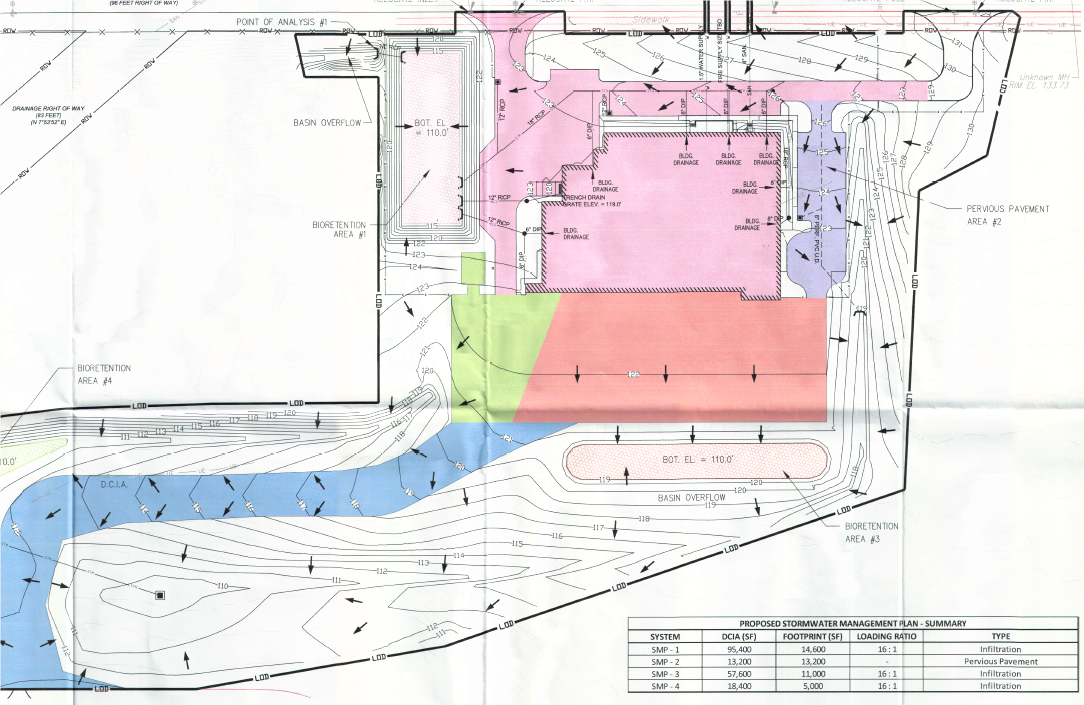
Figure 12. System designs at Chubb Hangar
Important Results
- Four stormwater systems designed and constructed.
- Successful collaboration with local office of a large engineering firm
- Complete buy-in of green stormwater infrastructure by client
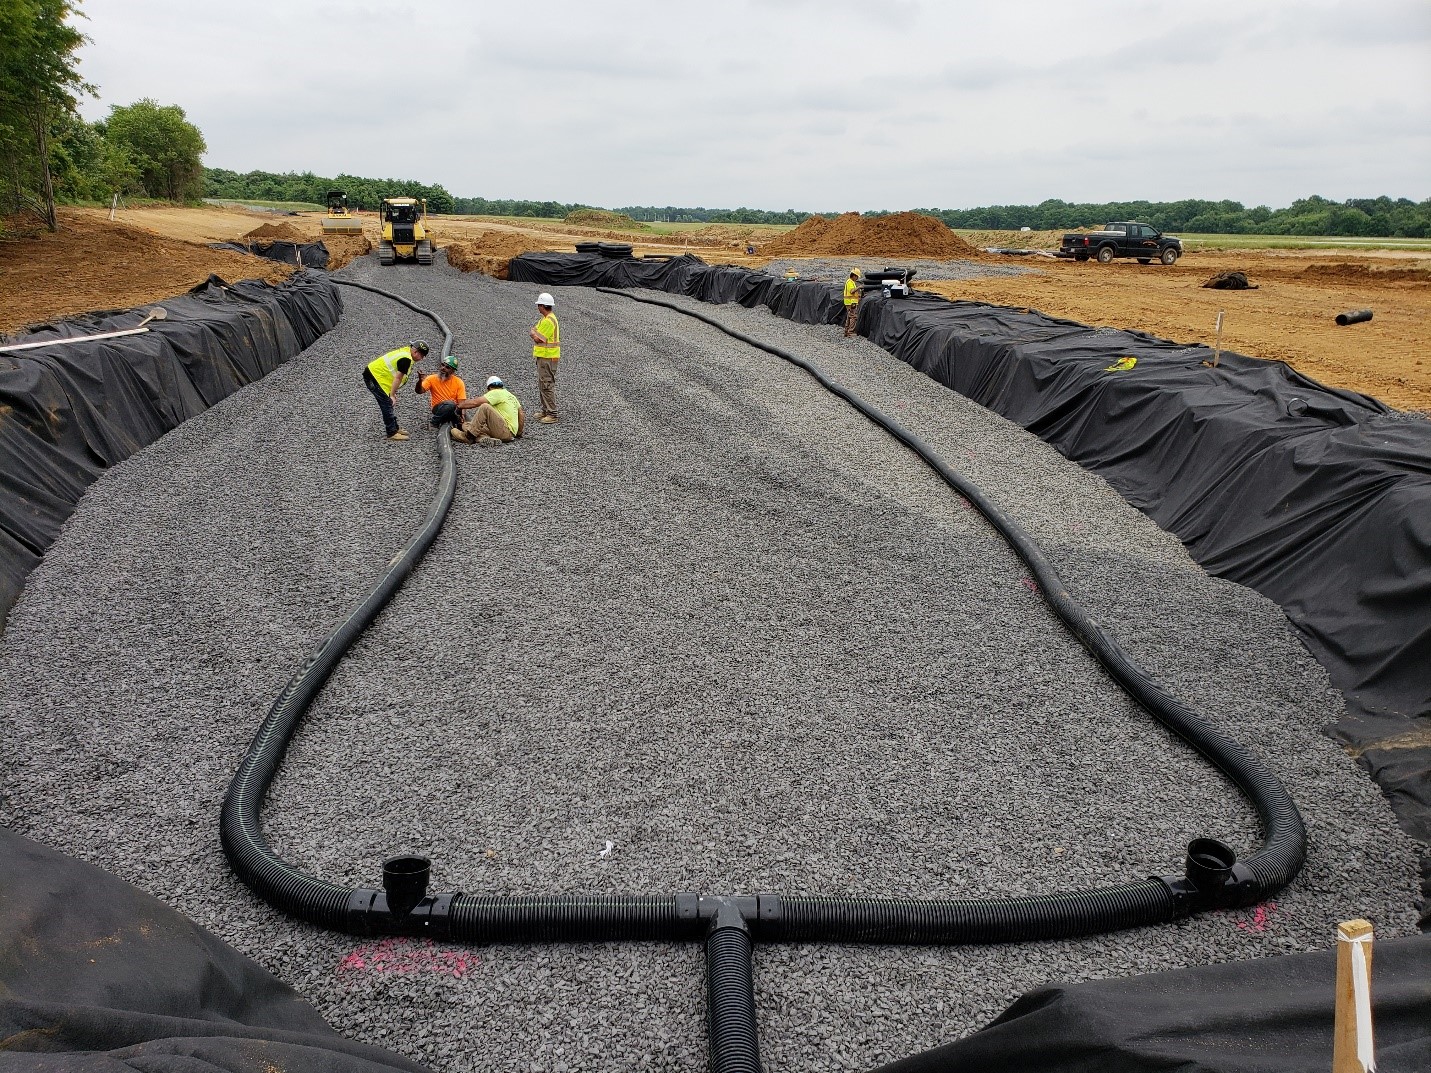
Figure 13. Bioretention system construction at Chubb Hangar
2D. Philadelphia Tree Trenches Constructed on UNH Campus
To kick start system monitoring objectives, the UNHSC designed and installed Philadelphia tree trench systems on the UNH campus. The process from design, permitting, bidding, and construction took less than 6 months, and this was the primary reason for building the systems on the UNH campus as it then afforded much more time to monitor system performances. In the summer of 2014 UNHSC installed the first Philadelphia tree trench on the UNH campus (A-Lot site). Design of this Tree Trench followed the “Green Stormwater Infrastructure Design Requirements and Guidelines” published by the Philadelphia Water Department (PWD) updated October 22, 2013 and was also reviewed and critiqued by PWD personnel. A key UNH innovation to the PWD design guidance was to have the stormwater enter at the top of the stone. This innovation is now in the latest PWD guidance, however at the time was not.
In the summer of 2016 UNHSC designed and installed a second tree trench system by strictly following (without alteration or innovation) retrofit guidelines published by PWD (E Lot site). In this system, the stormwater enters at the bottom of the stone compared to the A-lot system where water enters the top of the stone. Due to the low permeability soils at both sites where infiltration capacity was measured at the base of each system (as required by PWD specifications), neither of these tree trench systems were credited in the design phase for infiltration. This meant that both systems were statically sized to hold the entire runoff volume from one inch of precipitation. As with the Chester Arthur stone reservoir, the A-Lot and E-Lot stone reservoirs are drained by an underdrain that is capped. A small orifice hole is drilled in the underdrain end cap, the hole diameter sized to drain the system in 24 hours. Like the Chester Arthur system, the A-lot and E-lot orifices were not drilled pending field data demonstrating whether the orifices were necessary or rather that infiltration could drain the systems between storms and therefore the orifices were unnecessary. Since construction, both systems exhibit significant infiltration and drain soon after storms. Most of this infiltration occurs out the sidewalls, which is predominantly urban fill. Sidewall infiltration is given no credit when designing systems. The E-lot system, although also infiltrating a significant amount, seems to bypass prematurely: this happens when the water level in the inlet overtops the high flow bypass weir and yet the stone is not filled. This will be discussed more in a later section on Monitoring Performance, however it appears that the very modest design innovation of placing the stone inlet pipe at the top of the stone (A-lot system) is hydraulically more efficient than at the bottom (E-lot system), since all other system, climate, and watershed aspects are nearly identical. Both systems continue to be monitored. Data to date point at both the need of maintenance (jetting) and water entering at the base of the stone (hydraulic penalty) as causes for the premature bypass. The E-lot system was televideoed in 2019 and jetted.
The majority of funding for construction of these systems came from the state of New Hampshire Watershed Assistance Grant program. EPA STAR funded the various student monitoring and reporting efforts.
Important Results
- The design, review, and permitting process can take on a life of its own. Systems in Philadelphia require two to five years whereas in New Hampshire less than one year. Urban areas require much more thorough consideration of stormwater infrastructure in the totality of the urban environment, but there may be opportunities to make the process more efficient.
- Many stormwater design manuals and guidance documents present designs that may have been logical or continued past practices yet prove to underperform for GSI. All systems presented in guidance documents should have the first constructed systems monitored in order to verify that the designs in fact meet objectives and expectations.
2E. System monitoring
A significant effort was invested in monitoring GSI in Philadelphia and elsewhere. The fundamental objective was to understand system performance. Monitoring goals broadly fell into the following categories
- Understanding infiltration
- Permeable pavement infiltration
- Blue carbon
- System hydraulics
2E.1 Understanding infiltration
Many GSI systems are constructed with an objective of infiltration. In communities such as Philadelphia, the key to reducing combined sewer overflows is to reduce stormwater runoff. Stormwater infiltration is one way to meet this goal. In the design phase and even in existing modeling software packages, GSI infiltration is only credited at the bottom of the systems. Bottom (vertical) infiltration is used to size systems and to predict their performance. In reality, the sidewalls of systems may also yield significant infiltration. If sidewall (horizontal) infiltration was included in the design phase, it would result in reduction to system size which translates to significant cost reductions.
In the performance of this task, the following systems were monitored: Philadelphia (Chester Arthur bioretention and subsurface gravel storage), UNH campus (A lot, E lot), and the Berry Brook watershed in Dover, NH (Horne Street Bioretention, Cheslea Avenue subsurface gravel filter, Kettlebell gravel filter). All of these systems were statically sized to hold the water quality volume. All but the Kettlebell system revealed significant sidewall infiltration, accounting for 20% to 60% of total infiltration. The Kettlebell system was constructed in a very tight clay and yielded no infiltration over 3 years of observation and is not discussed further. For those systems that did enjoy infiltration, they all managed much more water volume than the water quality volume prior to overflowing. While this indicates that systems are conservatively designed, it also means that systems are overbuilt and that design procedures might be revisited. All systems studied had a perforated/slotted drain at the bottom with an orifice to throttle the outflow in order that they drain very close to 24-hours when filled with water. In all cases, the orifice was sized in the outlet manhole or underdrain, but the hole never drilled. This subscribed to PWD experience that system performance is observed soon after construction, and if systems are not draining properly, then the orifice is drilled. To demonstrate the degree of infiltration and horizontal infiltration, data from two of the monitored systems are presented: Chester Arthur gravel filter and the A-lot Philadelphia tree trench. In both of these systems, because the outlet orifice was never constructed, the systems fill and until the water level in the systems reaches the elevation of the overflow (bypass) the only means for water leaving the system is via infiltration. That infiltration occurs wherever water in the systems contact native soils: the bottom of the systems or the sidewalls.
The Chester Arthur Elementary School subsurface gravel filter (which exists below a porous asphalt surface layer) was monitored from November 2016 through August 2020. Monitoring occurred with pressure transducers installed in observation wells and surveyed to NAVD. Precipitation data was secured from PWD. Prior to system construction, borehole permeability tests estimated infiltration capacity at the bottom of the system to be negligible. The site of the schoolyard was the former location of brick rowhomes. These homes were demolished in place and the school and schoolyard built upon the rubble (Figure 14). Performance testing indicated a very different infiltration characteristic.
Figure 15 displays the water level data for the entire monitoring period. The gravel filter is full when a water depth of 2.7 feet is reached. This data indicates that the water level only once exceeded that height during the entire monitoring period, which implies almost 100% infiltration. If, as the borehole testing indicated, no water infiltrates out the base of the system, then all water is either leaking through the system sidewalls or there are leaks in the plumbing system connecting to the street combined sewer. The controlling manhole to this system only once exhibited a water level higher than 2.7 feet which means that the system only bypassed flows once during the entire monitoring period.
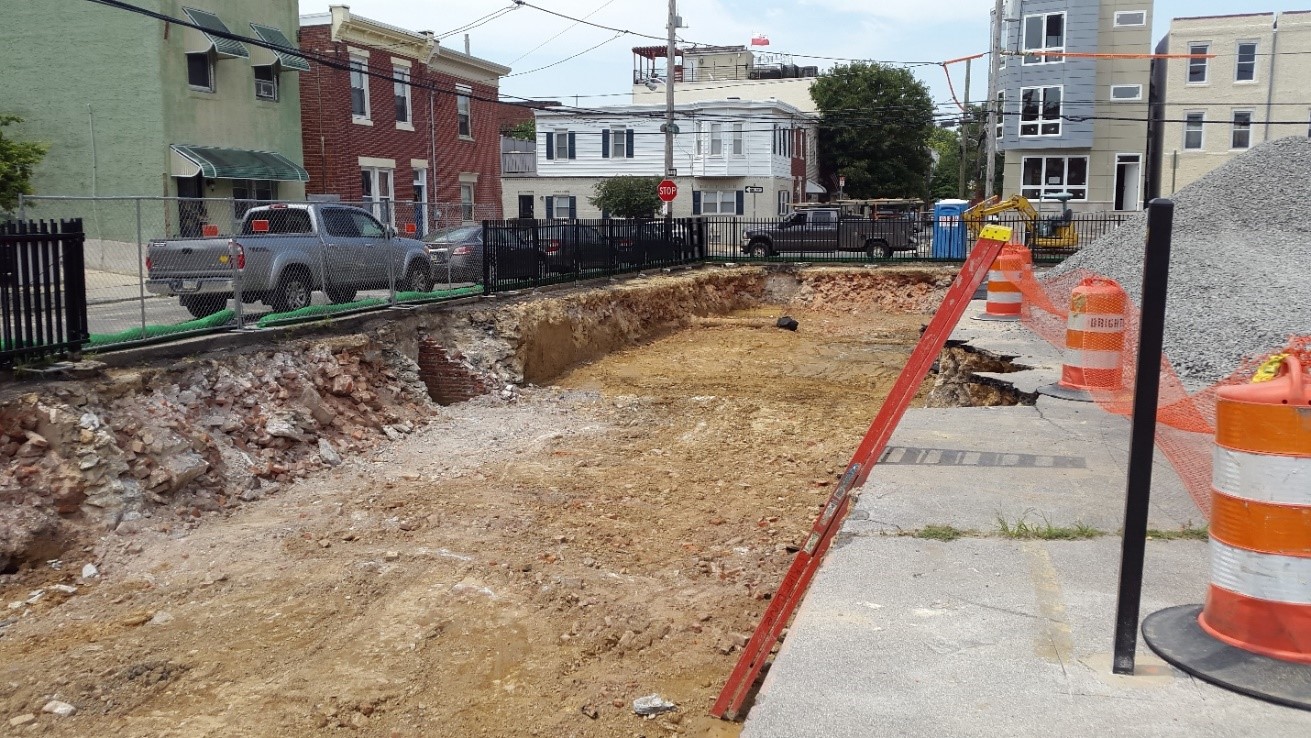
Figure 14. Existing demolition rubble in the sidewalls of the Chester Arthur gravel (stone) filter below the porous asphalt section.
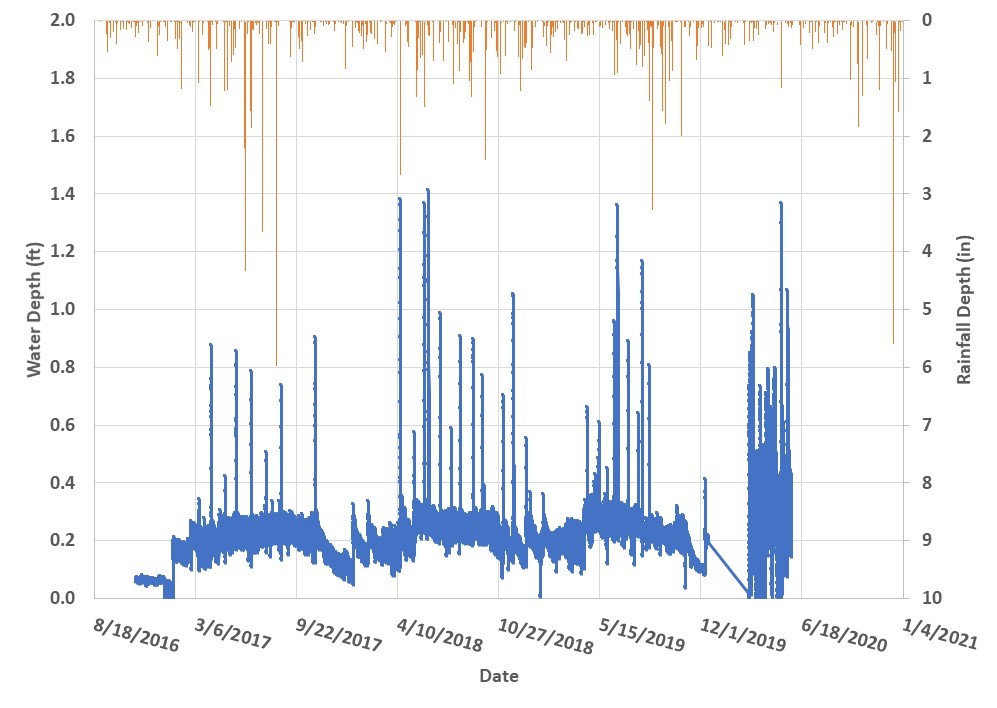
Figure 15. Water level and precipitation in the subsurface gravel filter below the porous asphalt at Chester Arthur Elementary School (blue curve is the water depth in the stone reservoir below the porous asphalt, orange bars are precipitation).
Figure 16 depicts a single event from April 15-16, 2018. A total of 3.11 inches of rain fell. For the total watershed area of 0.63 acres and assuming 90% of the precipitation runs off into the gravel filter, that yields a runoff volume of 6,300 ft3. The gravel (stone) reservoir below the porous asphalt has a volume of 3,100 ft3 to the elevation of the overflow. Twice as much water flowed into the gravel as there is storage available in the gravel. More importantly, the maximum water elevation recorded in the gravel (Figure 16) was 1.4 feet, meaning that at the maximum water level, about 1,600 ft3 of gravel volume was occupied by water. Since the water depth did not reach 2.7 feet, no water overflowed and bypassed, meaning that all the water from this storm infiltrated. The entire event infiltrated within 7 hours after rainfall ceased. Looking at just the water depth recession limb, after rainfall and runoff ceased, the rate of water level drop in the gravel (“apparent infiltration rate”) averaged 2 inches per hour. Since field measurement indicated almost no infiltration out the bottom of the system, this infiltration is predominantly out the sidewalls (horizontal) through the demolition rubble (urban fill).
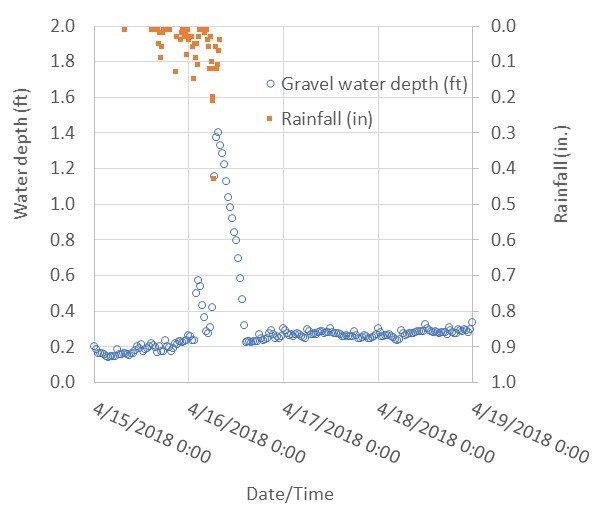
Figure 16. Precipitation and gravel water depth below Chester Arthur porous asphalt for 15-16 April 2028 event.
The Philadelphia Tree trench constructed at A-lot on the UNH campus had a very similar setting as the Chester Arthur setting: urban fill over low permeability soil. The site setting and construction are depicted in Figure 17. After excavating to the full depth of the system, soil permeability was measured with double ring infiltrometer (ASTM D3385) to be 0.03 in/hr. Because this was less than 0.25 in/hr, per PWD design guidance for infiltration systems, the storage volume of the stone (gravel) in the tree trench had to completely hold the runoff from one-inch of precipitation and the release rate had to be such that the system drained within 24-72 hours. The bottom perforated pipe in the system was controlled by an orifice in the outlet catch basin manhole, yet this orifice was never drilled. Watershed area is 0.58 acres, of which 95% is impervious asphalt, with a time of concentration of 6 minutes (Figure 18). In the design of the A-lot system, although the system is located in New Hampshire, PWD graciously provided design review to ensure that the system design met PWD design guidance. The only aspect that did not meet PWD design guidance at the time was that water enters the system from the top of the stone whereas PWD design guidance at the time required water to enter at the bottom of the stone.
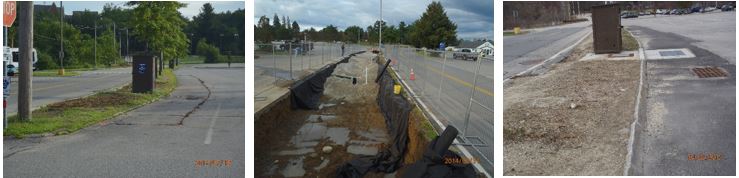
Figure 17. Left to right: pre-existing A-Lot site with cuts for system excavation, mid-construction, and completed system.
For the A lot system, the stone depth below the overflow elevation is 2.4 feet. That overflow is in the concrete inlet structure next to the monitoring shed in Figure 17 (right panel). There was an existing inlet grate in the parking lot prior to system construction. That grate is also visible in Figure 17 (left panel). During the 2-year monitoring period, the overflow was capped, and the original inlet grate replaced with a steel plate. The overflow was capped in order to prevent any premature bypass (inlet full of water and bypassing before the stone was filled). The original street grate was connected to a storm sewer in the road. The outlet to the new A-lot Philadelphia tree trench was to this same catch basin outlet pipe in the street grate manhole. The original inlet grate was replaced with a steel plate because in the first months of monitoring it was noticed that some parking lot runoff was entering the grate. These two events are depicted with the time history of system water levels in Figure 19.
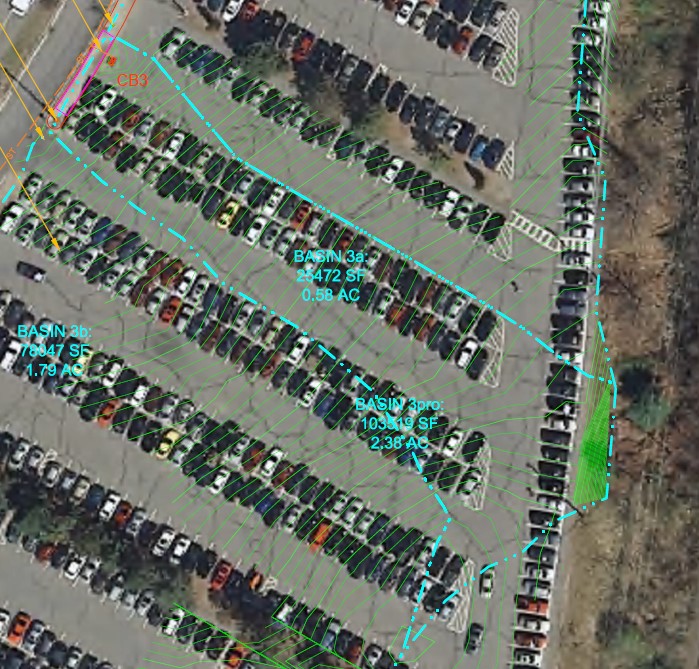
Figure 18. A Lot system watershed (BASIN 3a) overlain on aerial image.
Again, the system stone volume below the overflow (bypass) spillway elevation was statically sized to hold the runoff from one-inch of precipitation. Because the system is not credited with infiltration capability because of the low field-measured bottom soil infiltration capacity, that volume of runoff would fill the stone to a water depth of 2.4 feet. What is clear is that the system easily manages the one-inch storm and often storms of greater magnitude. There are two fundamental reasons for this in general, and one of these is specific to the A-lot system. First, systems are sized statically, meaning that the entire design runoff volume is placed into the system instantaneously and then the design calls for the outlet orifice to be sized to drain the system in a specified time period. The reality is that in nature, systems operate dynamically: as runoff occurs and enters the system, it may also leave the system (underdrain and/or infiltration). Static sizing will always result in oversized systems. Secondly, although the system is not credited with infiltration, because there is no drainage orifice, infiltration is occurring and is significant.
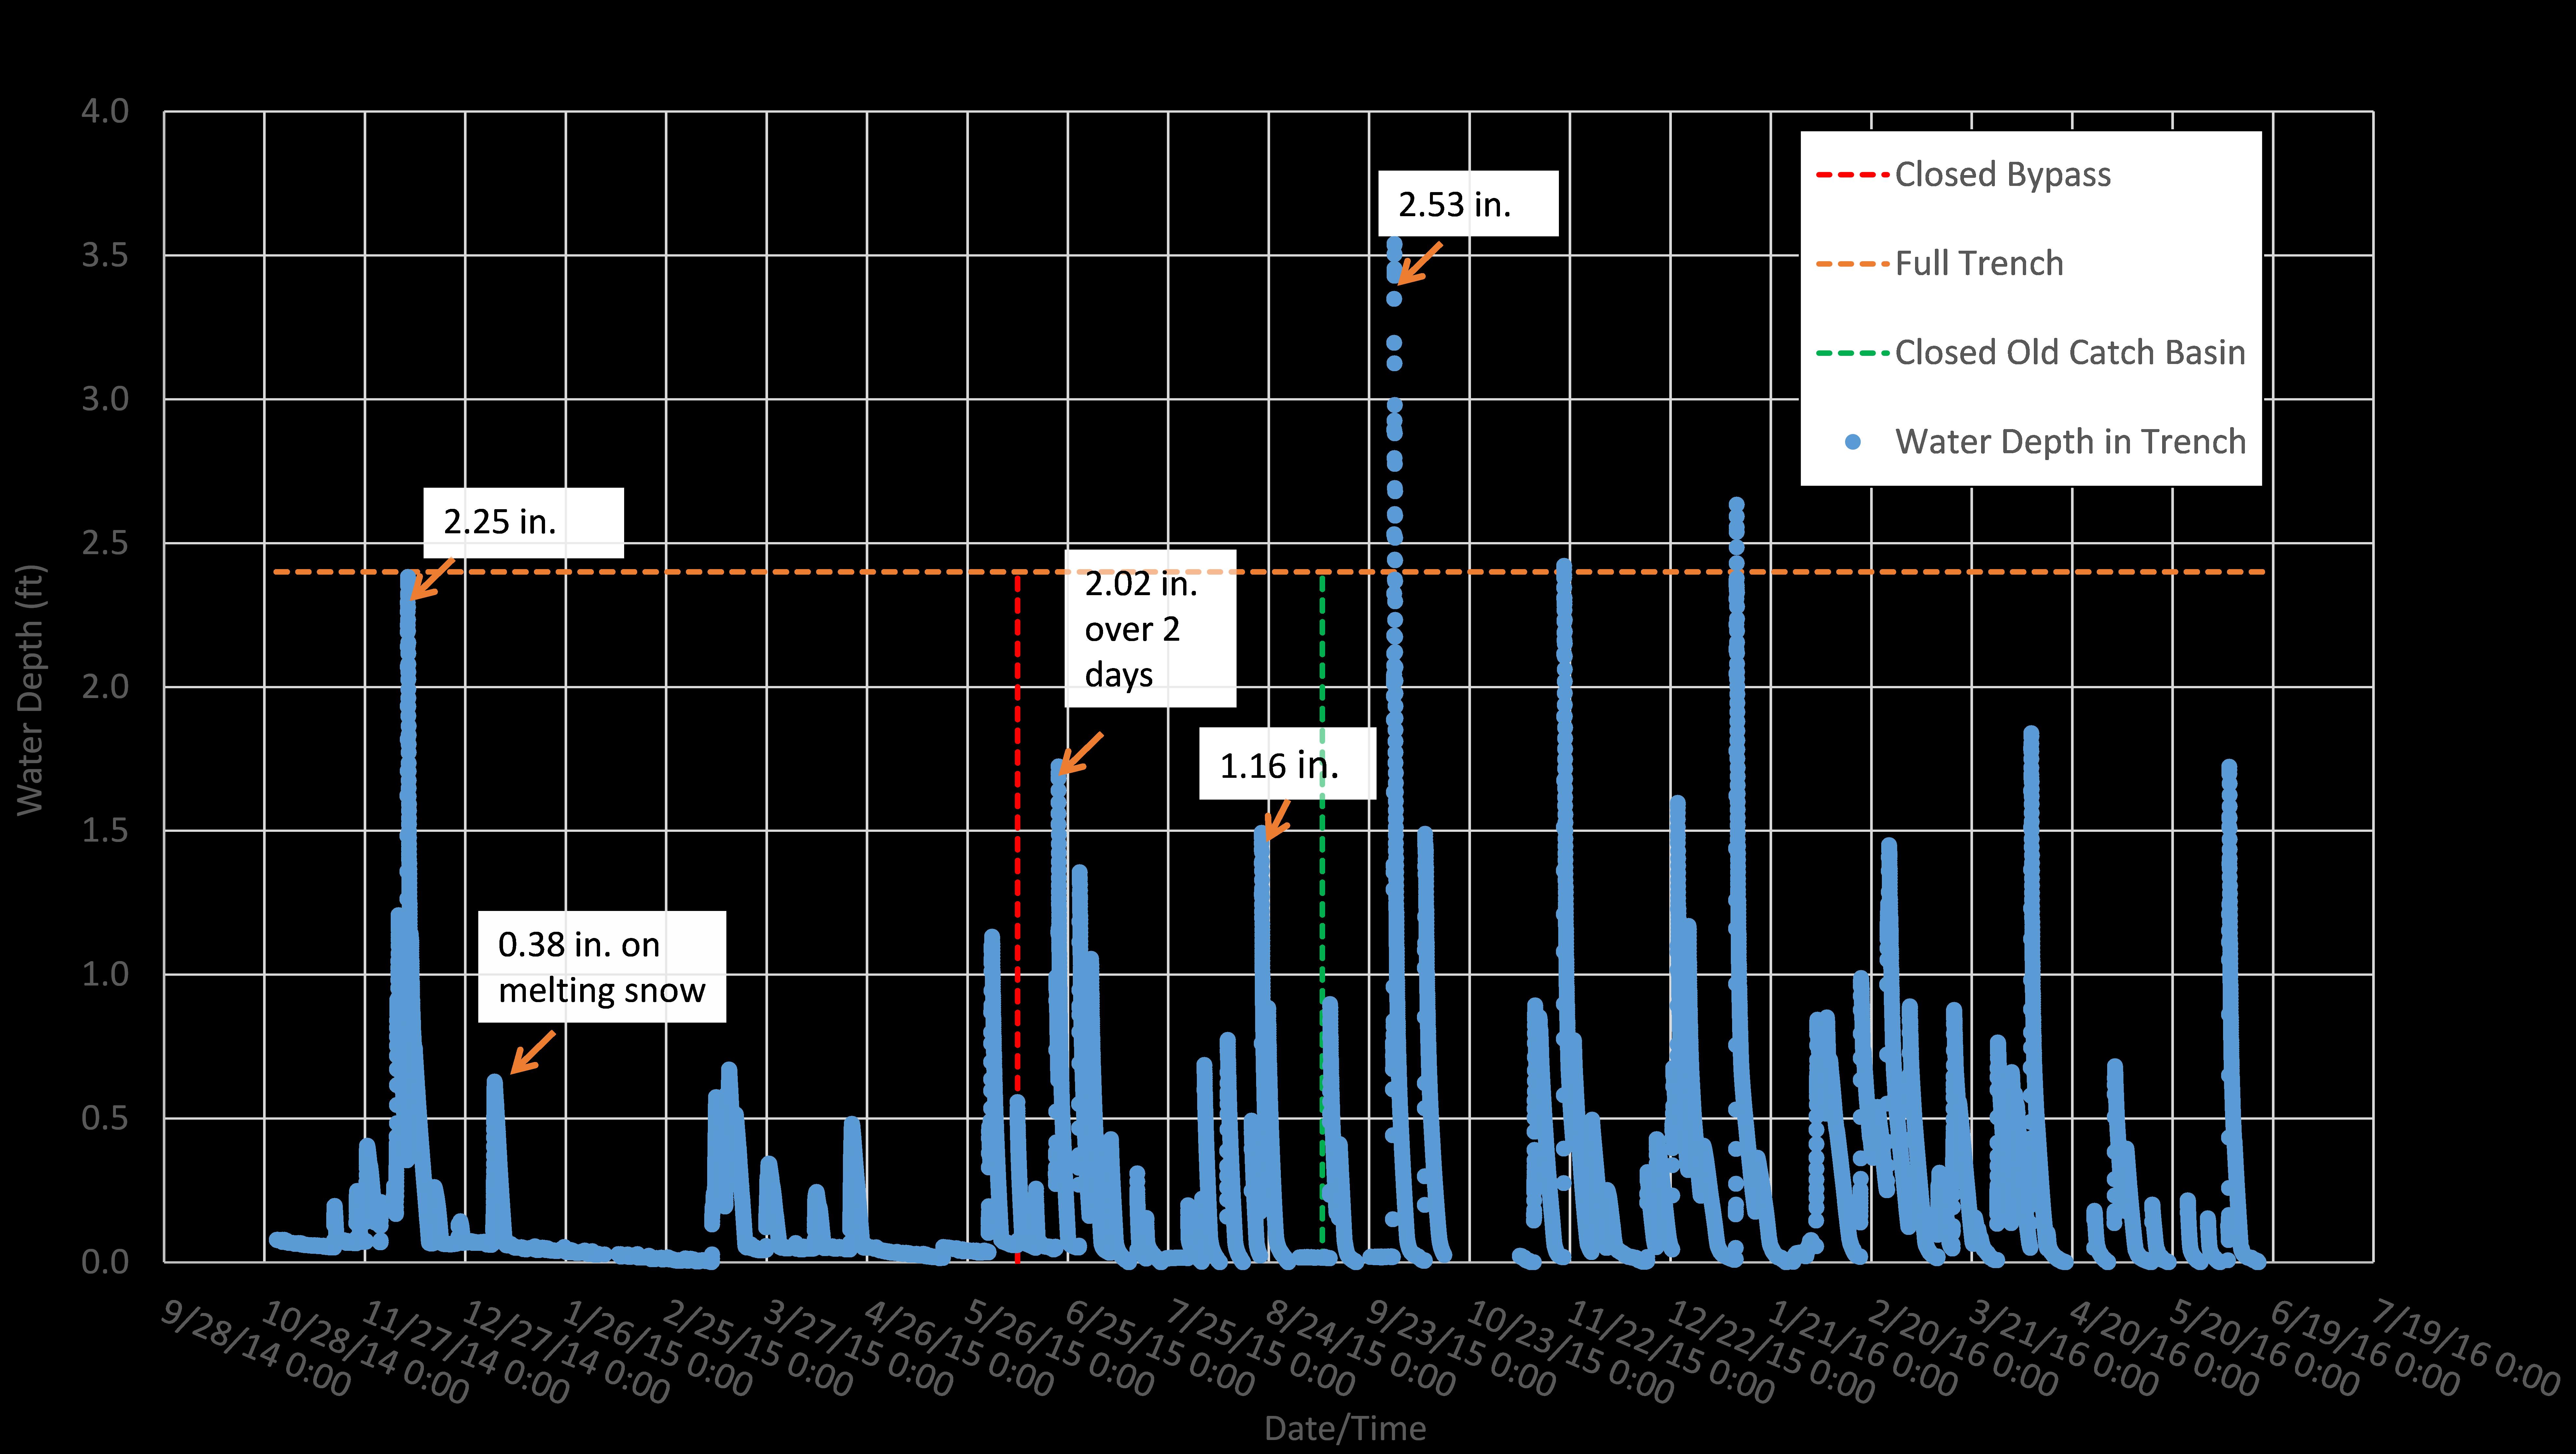
Figure 19. Time history of A-lot Philadelphia tree trench water levels.
For the first year monitoring period (October 2014 – November 2015), 41.47 inches of precipitation fell, which represents a precipitation volume over the watershed of 87,300 ft3. With a runoff fraction of 92%, that yields a runoff volume of 80,330 ft3. The volume of water infiltrated (estimated from water depths in the system) was 64,583 ft3. The volume reduction was 80%, all via infiltration. The 20% that was not infiltrated occurred in two storms of precipitation depths 2.25 inches and 2.53 inches.
To understand the “apparent” infiltration capacity in this system, the rate of change of the water level hydrographs, starting 12 minutes after the end of rainfall (twice the estimated time of concentration, therefore when surface runoff has ceased), were plotted versus the water depth at the time of the calculation. The rate of change of the water depth is the apparent infiltration rate (inches per hour), these are plotted in Figure 20. The data seems to fit into two zones of permeability: water depth greater than 0.8 ft and water depths less than 0.02 ft. For water depths greater than 0.8 feet, apparent infiltration capacity is linearly correlated with water depth (R2 = 0.91). This strongly argues for sidewall infiltration: as depth of water increases linearly, sidewall area increases linearly. For water depths less than 0.8 ft, there is no significant correlation between apparent infiltration rate and water depth, the average apparent infiltration rate is 0.02 in/hour which is remarkably close to the field measured bottom infiltration capacity (0.03 in/hr). This implies that the bottom of the system is in the native, low permeability soil and above that is much higher permeability urban fill. This is exactly what was observed during construction. The system is full when the water depth reaches 2.4 feet. The water depth is less than 0.8 ft for 99% of the record.
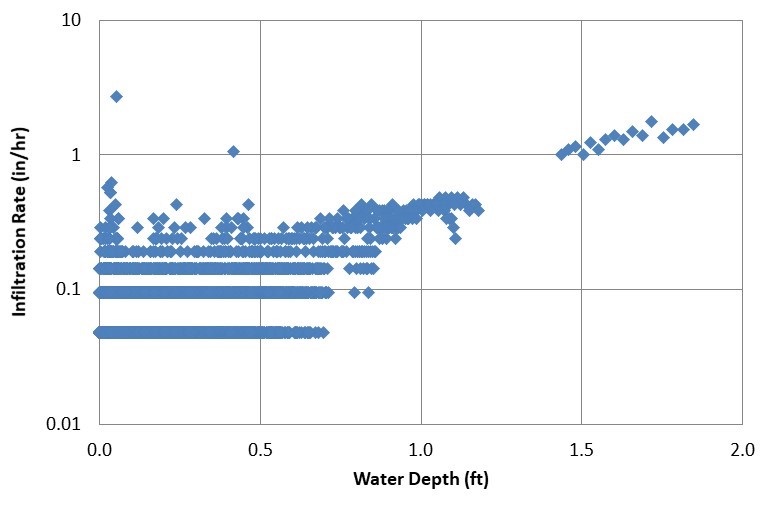
Figure 20. Apparent A Lot Philadelphia Tree Trench infiltration rates
Important Results
- GSI is very commonly statically sized and this results in oversized systems. Significant cost savings are possible by either dynamically-sizing systems, crediting sidewall infiltration, or directly using field-measured infiltration rates (common practice is to reduce this value by one half to one third). Statically sizing GSI makes the design simple. This was an important aspect in getting GSI integrated into design protocols as complex design procedures would result in much more slower adoption of GSI practices. Interestingly, prior to GSI, all systems (ponds) were dynamically sized. It is not that the profession cannot dynamically size systems, rather it is the social infrastructure in the development of design guidance that seems to direct the use of static sizing criteria. Dynamic sizing of GSI is no more difficult than for conventional infrastructure, however most present-day model approaches do not adequately address the dynamic physics of systems (for example horizontal infiltration). The static sizing is very conservative, especially in well-draining soils. While this may be viewed as the ability to manage much more runoff than the design requires, this comes at the penalty of larger and therefore more expensive systems. In the cases of Chester Arthur and A-lot, these systems could be almost half the size, with possible saving of 30% or more. When considering the billions of dollars communities are dedicating to GSI, 30% cost reductions are a considerable savings of taxpayer dollars. To be clear, it is most appropriate for stormwater retrofits to be dynamically sized. Stormwater retrofits are where there is existing development with little to no stormwater management, and GSI is sized to fit all stie constraints. This may mean that systems may not be fully sized (large enough to hold runoff from the one-inch storm). For new development where GSI can be planned and fully sized at project inception, there is no reason not to fully size systems, especially since often it is the developers paying for these systems, although ultimately they may be turned over to the community much as the roads.
- Sidewall infiltration can dominate infiltration in GSI systems, especially in stratified soils where low permeability soils are at the base of the systems.
- GSI static sizing results in system oversizing (system can manage much more water than in the design).
2E.2 Location of System Influent
In subsurface gravel filter systems, such as the Philadelphia Tree Trench, the cross section from the bottom up is stone, pea stone, soil, and at the very top possibly impervious surface. These systems are well-suited to urban settings as they afford the land surface above the systems to be utilized (parking, transportation, recreation, etc.). Prior to runoff reaching the subsurface gravel filter there is usually pretreatment to remove gross solids, floatables, and large sediment particles. After pretreatment, water may enter the stone layer in the subsurface gravel filter. At the start of the EPA STAR project, PWD design guidance for this aspect of subsurface gravel filters was to have the water enter at the bottom of the stone. UNHSC designs typically put the water in at the top of the stone. Hydraulically, there is a significant difference in how the two systems perform: they key performance metric is the depth of water in the pretreatment inlet control prior to the gravel filter itself. When water enters at the top of the stone, a perforated or slotted pipe from the pretreatment inlet control enters at the top of the stone and often slopes downwards away from the inlet control. The only hydraulic resistance between pretreatment inlet control and the stone in this case is the entrance into the perforated/slotted pipe. Water in the pretreatment system must fill the pretreatment structure to the elevation of the invert of this inlet pipe to the stone. Water either flows into the inlet pipe as weir flow (more common), however for a small diameter inlet pipe, influent may enter as orifice flow. Weir flow is hydraulically more efficient than orifice flow (for a unit increase in water depth, weir flow exhibits much more increase in flow than orifice flow). The water that enters the inlet then may flow down the pipe and through the pipe perforations/slots into the stone. By design, the pipe capacity exceeds the hydraulic capacity of the inlet and should not back-up water into the pretreatment area. When the water enters the stone from the top it then flows as unsaturated flow through the stone and ponds at the bottom. The unsaturated flow does not back-up water to the inlet.
When water enters the bottom of the stone, it may first be as weir flow or orifice flow, but as the water ponds in the stone, weir flow is not possible, and flow is as an orifice. In addition to the hydraulic resistance of the pipe inlet, the depth of water in the stone represents hydraulic resistance to inflow. Lastly, when water flows from the inlet pipe to the stone under submerged conditions, there is an “exit loss” in the conversion of energy from velocity to pressure. The submerged orifice, the water depth in the stone, and the exit loss are all hydraulic penalties that the bottom of stone inlet pipe realize that the top of stone inlet pipe does not. This means that from the outset, one would expect system bypass to preferentially occur for systems with the inlet pipe low rather than when the pipe is set high.
The previously described A-lot system had the inlet pipe at the top of the stone. Another system designed and constructed on the UNH campus, E-lot, had the inlet pipe at the bottom of the system. As with the A-lot system, even though the E-lot system is in New Hampshire, PWD personnel provided design review to ensure that the E-lot system met PWD design guidance. Water levels in A-lot were monitored from 2014 through 2016. Water levels in the E-lot system were monitored from 2016 through 2019.
E-lot is an asphalt parking lot. The watershed area is 0.53 acres and is 100% impervious. It originally drained to a catch basin that connected directly to a storm sewer. A subsurface gravel filter was sized to hold the runoff from one inch of precipitation. The old catch basin was left in place and served as the outlet for the gravel filter as well as to capture overflow (bypass) for water trying to enter the subsurface gravel filter. As in A-lot and Chester Arthur, the underdrain in the system was controlled by an outlet orifice. This orifice was never drilled, therefore the only way for water to leave the system is via infiltration.
For both the A-lot and E-lot systems, there is a catch basin upstream that removes floatables, gross solids, and large particles (pretreatment). Also, in this inlet catch basin is a high flow bypass: when the depth of water in the inlet catch basin exceeds that of the high flow bypass, water does not enter the stone but directly goes to the storm sewer. The expectation is that water freely flows from the inlet catch basin to the stone and the water levels in both inlet catch basin and stone are the same, as in a bath tub. When the stone is filled with water, the system bypasses in the inlet catch basin: the stone captures the first runoff that often carries the majority of pollutants (first flush). Premature bypass can occur when there is hydraulic resistance between the inlet catch basin and the stone. This manifests itself as a difference in water levels between the inlet catch basin and the stone. With premature bypass, water in the inlet catch basin is at the elevation of the bypass before the stone is filled.
|
| A-lot | E-lot |
| Period of monitoring | Nov 2014 – July 2016 | July 2016 – Sep 2018 |
| Number of storms | 141 | 145 |
| Number of bypass events | 2 | 36 |
| Number of premature bypass events | 0 | 36 |
Figure 21 Depicts a cross section of the E-Lot system and the water level histories for the period 27-31 October 2017 where 1.8 inches of precipitation fell. All elevations in the figure are relative to NAVD. In the figure may be seen the system physical elevation for the land surface (grate elevation), the top of the gravel (stone) layer, the bottom of the gravel, and most importantly the bypass elevation in the inlet catch basin. Depicted system water levels include the inlet catch basin and two monitoring wells in the gravel (Well 1 and Well 2). If the system behaved like a bathtub, the water levels in the Inlets, Well 1, and Well 2 would be identical. It is apparent that the inlet water level tracks at higher elevations than the wells during runoff events. In this particular storm, the inlet water level exceeded that of the bypass whereas neither of the well water levels did: this is an example of premature bypass.
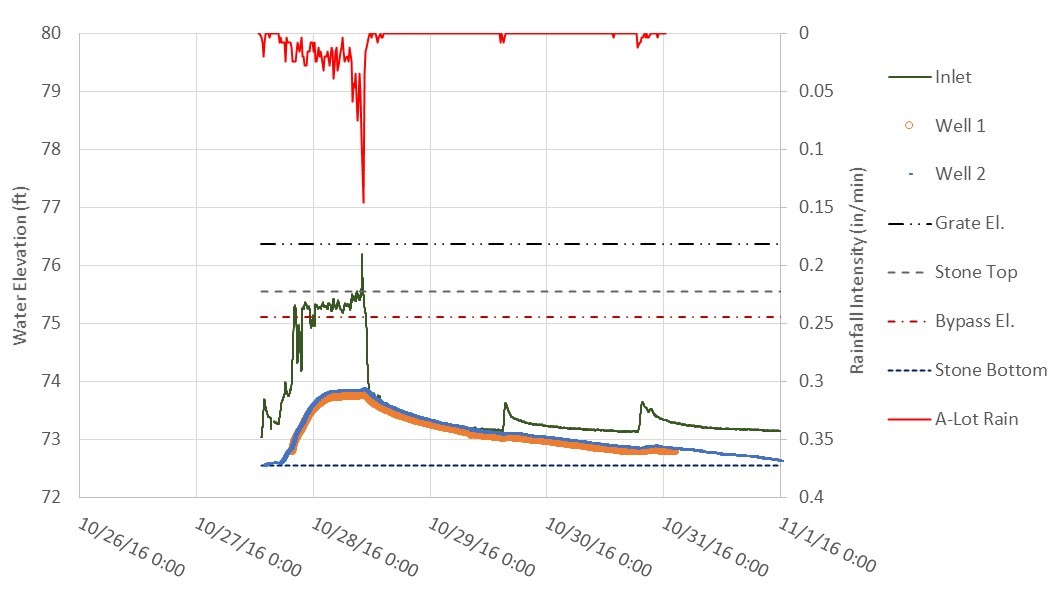
Figure 21. E Lot Water levels during October 2016 storm event.
During the monitoring period individual storms were isolated and stratified into those storms in which there was premature bypass and those without (Table 2). Those data sets were then compared against the rainfall depth for each storm and the maximum rainfall intensity for each storm. The E-lot system was designed to hold the runoff from one inch of rainfall. The median storm depth that resulted in bypass events was 0.82 inches, however there were storms with depths as low as 0.27 inches that resulted in bypass. The median rainfall intensity that resulted in bypass was 0.72 inches per hour. Looking at just the underdrain inlet as an orifice, and computing flows with the Rational equation, the hydraulic capacity of the pipe is greater than intensities of 4 inches per hour. This means that the pipe entrance is not what is restricting the flow. Both of the data variables for each data subset (bypass, no bypass) were statistically different at the 95% level of significance. The data represented by the subsets may be found plotted in Figures 22 and 23. In summer 2019, the inlet pipe was video logged. Some debris (pine needles) were observed in the pipe. Soon after the inlet pipe was cleaned with a hydraulic jet, but the performance did not improve, and the premature bypass persisted.
Table 2. E Lot Bypass Data subsets
|
| No Bypass Events | Bypass Events |
| Median rainfall depth (in) | 0.45 | 0.83 |
| Median maximum rainfall intensity (in/hr) | 0.19 | 0.72 |
Important Results
- There is a hydraulic penalty when placing the inlet pipe at the bottom of the stone in subsurface gravel filter systems.
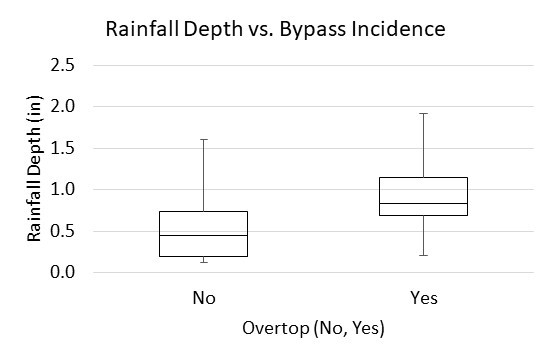
Figure 22. Box and Whisker plot for E lot precipitation depth versus bypass or no bypass events.
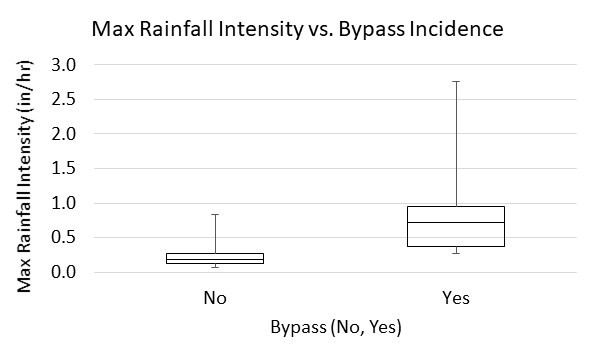
Figure 23. Box and Whisker plot for E lot precipitation intensity versus bypass or no bypass events.
2E.3 Infiltration Capacity of Permeable Pavements
Permeable pavement systems are an attractive GSI option: they provide a stable surface layer for other uses and infiltrate almost all water at the surface. The permeability of the permeable pavement occurs via the higher porosity of the material compared to its impermeable counterpart: often the porosity of the permeable pavement surface is on the order of 20%. Atmospheric deposition, vehicle tracking, and runon can bring sediments to the permeable pavements. These sediments are filtered out at the surface, thereby slowly reducing the permeability, and without maintenance (vacuuming) ultimately rendering the pavement impermeable. Permeable pavement installations in Philadelphia and across the northeast US were tested to assess permeability and how it varied with site age. Permeability testing was conducted using ASTM C1701. At high permeability sites, the ASTM method requires a significant amount of water, 25 gallons for a single test, and therefore a substudy was to use the surface inundation test (Bean, 2005) at the same locations and sites. The surface inundation test uses much less water and is much faster than the ASTM method.
For each permeable pavement site selected for testing, design plans and construction dates were collected. Each site was then visited and a minimum of three locations at each site tested. At each test site, first the surface inundation test was performed three times, and then the ASTM method (which requires a pre-wetting test and then three repetitions). At all Philadelphia sites, PWD provided a mobile 200-gallon tank that they would fill with nearby fire hydrants. For all other sites, four, 40-gallon barrels were brought to the sites empty and filled locally with potable water.
The results of the surface inundation method versus ASTM method may be seen in Figure 24. In this figure, each data point represents the average infiltration capacity (IC) of each permeable pavement site: three locations at each site, measured by both methods and at each test location, the method is repeated three times, therefore each data point is the average of nine infiltration tests. Permeable pavements included: porous asphalt, pervious concrete, and interlocking concrete pavers. In all, 42 sites were included in the study, 12 sites in Philadelphia, including the parking lot at the Philadelphia Wastewater Treatment Plant that has six different types of permeable pavements and the Community College of Philadelphia that had two pavement types.
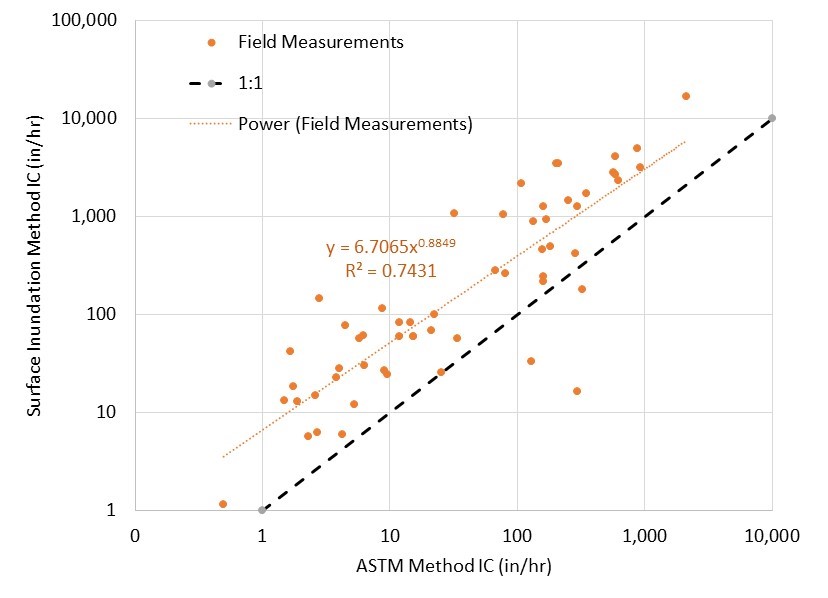
Figure 24. Comparison of ASTM and Surface Inundation Test infiltration capacities (IC) on studied permeable pavements.
As is evident from Figure 24, the surface inundation test nearly consistently overpredicts infiltration capacity compared to the ASTM method. That aside, there is no requirement for a minimum permeable pavement infiltration capacity in typical construction specifications (a performance metric requirement): if the manufacturer and installer follow construction and manufacturing specifications, it is presumed that the infiltration capacity of the completed system is acceptable. Therefore, there is no strict reason not to use the surface inundation method over the ASTM method as both are giving an indication of the site performance. In general, UNHSC recognizes that sites with ASTM permeabilities of 10 inches per hour or less are relatively impermeable in that they are not meeting GSI stormwater management expectations: when a site possesses an ASTM infiltration capacity of 10 inches/hour or less most precipitation events will result with surface ponding and runoff. The ASTM value of 10 inches/hour translates to a surface inundation value of 50 inches/hour.
Infiltration capacities, measured with the ASTM method, were performed at various sites during the performance of the EPA STAR effort, with some sites revisited in different years. This data was combined with other site measurements elsewhere. The intent was to understand not only the variability in construction and permeable pavement type, but more importantly the temporal variability of infiltration capacity.
Figure 25 depicts all data from this study, stratified by the type of permeable pavement (porous asphalt, pervious concrete, and permeable interlocking concrete pavers). Best fit exponential curves were fitted to the data to visually demonstrate temporal the trends. In general, using single parameter models (infiltration capacity versus time), the exponential relationships generated the highest R-squared values for all data as well as the stratified data. In general, the concrete initially starts off with much higher infiltration capacity than the asphalt. Also in general, all studied permeable pavement systems demonstrate loss of infiltration capacity over time.
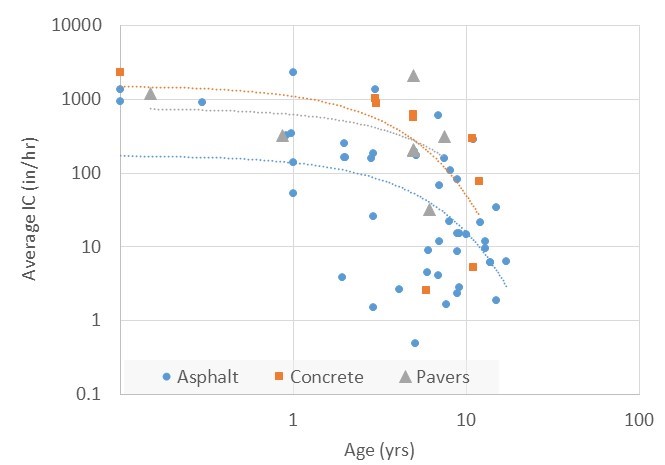
Figure 25. Infiltration capacities of various permeable pavements over time.
Since the data in Figure 25 is dominated by porous asphalt sites, just the porous asphalt data is presented in Figure 26. If the previously mentioned infiltration rate of 10 inches/hour is used to characterize a site as basically impermeable, Figure 26 indicates that in general porous asphalt ceases to function for stormwater management after 10 years. The studied sites that maintained higher permeabilities after 5 years were those that were properly maintained (vacuumed). Figure 26 includes additional data collected prior to the performance of the EPA STAR project. These data were at sites also sampled during the EPA STAR award.
Half of the data points for Figure 26 were from the UNHSC West Edge parking lot on the UNH campus. That dataset is isolated in Figure 27. This lot has only seen one or two maintenance events over its lifespan, and those were associated with earlier UNHSC research efforts (in years 3 and 6, which explains much of the data variability in that time period). As with the general data trends, the West Edge site data clearly demonstrates loss of permeability over time and that at 5 years of age (viewing the data, not the trendline) the asphalt ceased to perform its stormwater management function.
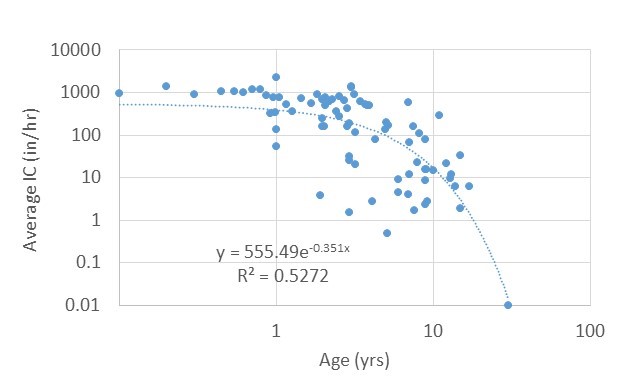
Figure 26. Infiltration capacities of porous asphalt sites over time.
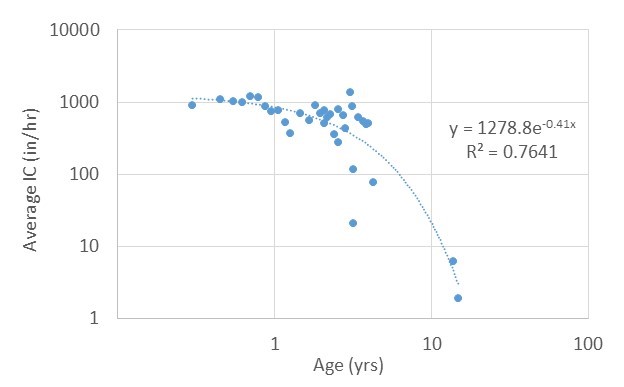
Figure 27. Infiltration capacities of UNHSC West Edge parking lot porous asphalt site over time.
Five porous asphalt sites (four in New Hampshire and one in Massachusetts from the overall dataset of Figure 26 are presented in Figure 28. Exponential trend lines were fitted to each data set only to assist visual interpretation. The majority of studied sites demonstrate dramatic infiltration capacity reductions after 5 years: the average infiltration capacity loss in these five sites in five years’ time is 96%. None of these sites has active maintenance (vacuuming).
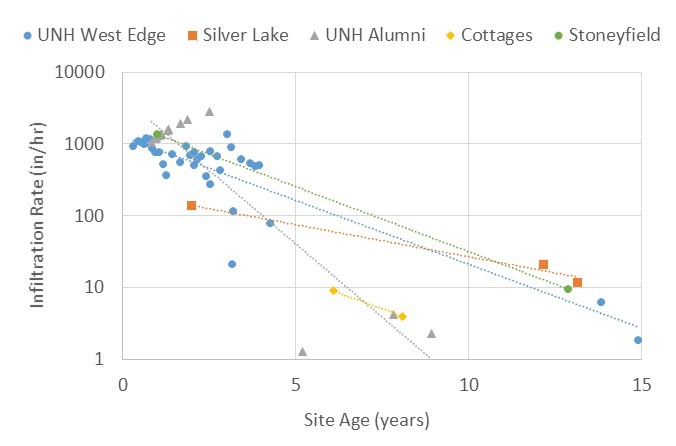
Figure 28. Time history of infiltration capacity at five porous asphalt sites.
Important Results
- Initially permeable pavements exhibit extremely high infiltration capacities: much larger than the 5-minute 1,000-year rainfall intensity. Even with modest runon from adjacent areas, there should never be ponding on a permeable pavement.
- As a general guide when using the ASTM C1701 infiltration capacity method, permeable pavements with measured infiltration capacities of 10 inches per hour or less are essentially impermeable and cease to perform their intended stormwater management function.
- Without active, regular maintenance to clean clogged sediments in permeable pavement voids, the permeable pavements quickly lose the ability to infiltrate. Withing five years sites can lose 90% or more of their original infiltration capacity. Note that if a site starts with an infiltration capacity of 1,000 inches/hour and loses 90% of its infiltration capacity, the ensuing infiltration capacity (100 inches/hour) is still much greater than the 5-minute 1,000-year rainfall intensity (approximately 10 inches/hour in Philadelphia according to NOAA Atlas 14). What is misleading about this comparison is that the ASTM infiltration capacity measurement occurs under a driving head whereas infiltration during rainfall generally does not: the ASTM method generates higher infiltration capacity values than the surface permeability exhibits during rainfall.
- For the pavements studied in this research, the majority cease to perform their stormwater function after 10 years (ASTM infiltration capacity less than 10 inches/hour).
- The permeable pavement performance data presented here underscores a much larger issue integral to the adoption of GSI: maintenance is necessary. Without such maintenance, systems fail and then are used as an example of why GSI is ineffective. This then promotes the use of grey infrastructure (collection systems, storage reservoirs, pump stations, and treatment facilities) in which maintenance is: substantial (equipment and personnel), unquestioned, and performed automatically. There is a disconnect between the adoption and construction of GSI and its long-term maintenance needs, and this is squarely on the shoulders of the system owners. It would appear that private property owners perform little to no maintenance: at the 12 studied Philadelphia sites, only one was performing regular maintenance. Of the nine private property Philadelphia sites, their average age was 7.5 years (range of 3 – 9 years) with an average infiltration capacity of 140 in/hour (range of 2 to 592 inches/hour) which is far below common initial infiltration capacities of over 1,000 inches per hour. PWD may need to address this issue, either through the site stormwater fee or by more aggressive efforts to engage site owners. There are private subcontractors who maintain stormwater infrastructure, so the problem is not that maintenance infrastructure is lacking. This is more a problem in the social dimension: for whatever reason, property owners do not typically maintain GSI, especially permeable pavements. Given that there are less than 100 permeable pavement sites in Philadelphia, PWD might consider performing or contracting for the maintenance of all sites and charge for this service via the stormwater fee. Without maintenance, these “greened” sites “ungreen” before the sunset of the Consent Agreement.
2E.4 Cleaning of Clogged Permeable Pavements
As field data came in on permeable pavement infiltration capacity, it was clear that maintenance is incredibly important to preserve the stormwater management objective of the pavements. To that end, a study of cleaning effectiveness was performed on permeable pavements. By serendipity a manufacturer of vacuuming equipment had developed a new piece of machinery and was trying to break into the permeable pavement maintenance market. They approached the UNHSC and offered to try out their equipment on sites we recommended if the UNHSC would give them feedback and share its data. We selected sites in Philadelphia and Boston, but Boston Water and Sewer Commission nor PWD had the ability to collaborate at the time, therefore sites at and close to the UNH campus were selected. The ASTM C1701 method was performed at various locations at each selected site just prior to and immediately following maintenance and cleaning activities.
The sites selected for the cleaning study were the West Edge parking lot and the Alumni Center parking lot, both porous asphalt installations. Because of very little maintenance at these sites and theirs ages, the sites were very clogged, and more than routine maintenance was necessary to try to recover infiltration capacity. Whereas normal maintenance is one pass of a vacuum a few times per year, these lots required multiple passes. The vacuum equipment used was the Triverus Municipal Cleaning Vehicle (MCV) situated onto a Bobcat® Toolcat™ all-wheel steer carrier. This equipment uses pressurized water jets to unc
References:
Bean, E. Z. (2005). A field study to evaluate permeable pavement surface infiltration rates, runoff quantity, runoff quality, and exfiltrate quality. Biological and Agricultural Engineering. Raleigh, North Carolina State University.
Journal Articles on this Report : 1 Displayed | Download in RIS Format
| Other project views: | All 44 publications | 1 publications in selected types | All 1 journal articles |
|---|
| Type | Citation | ||
|---|---|---|---|
|
|
Houle J, Ballestero T, Puls TA. The performance analysis of two relatively small capacity urban retrofit stormwater controls. Journal of Water Management Modeling 2017;25:C417. |
R835558 (2016) R835558 (Final) |
Exit Exit Exit |
Supplemental Keywords:
stormwater, green stormwater infrastructure, permeable pavement, blue carbonRelevant Websites:
Progress and Final Reports:
Original AbstractThe perspectives, information and conclusions conveyed in research project abstracts, progress reports, final reports, journal abstracts and journal publications convey the viewpoints of the principal investigator and may not represent the views and policies of ORD and EPA. Conclusions drawn by the principal investigators have not been reviewed by the Agency.