
Grantee Research Project Results
2015 Progress Report: Impacts of Household Sources on Outdoor Pollution at Village and Regional Scales in India
EPA Grant Number: R835425Title: Impacts of Household Sources on Outdoor Pollution at Village and Regional Scales in India
Investigators: Smith, Kirk R. , Seinfeld, John , Bond, Tami C. , Edwards, Rufus D. , Arora, Narendra
Current Investigators: Smith, Kirk R. , Bond, Tami C. , Edwards, Rufus D. , Seinfeld, John , Arora, Narendra
Institution: University of California - Berkeley , California Institute of Technology , University of California - Irvine , The INCLEN trust
Current Institution: University of California - Berkeley , California Institute of Technology , The INCLEN trust , University of California - Irvine
EPA Project Officer: Keating, Terry
Project Period: April 1, 2014 through March 31, 2017 (Extended to March 31, 2019)
Project Period Covered by this Report: April 1, 2015 through March 31,2016
Project Amount: $1,495,454
RFA: Measurements and Modeling for Quantifying Air Quality and Climatic Impacts of Residential Biomass or Coal Combustion for Cooking, Heating, and Lighting (2012) RFA Text | Recipients Lists
Research Category: Air Quality and Air Toxics , Tribal Environmental Health Research , Air , Climate Change
Objective:
This research will quantify the contribution of households to ambient air pollution in North India by (1) updating and improving existing emissions inventories through activity-based modeling at high temporal and spatial resolution, (2) providing field-based emissions of SVOCs and other ozone precursors to, for the first time, model the contribution of household air pollution to regional secondary particle formation; and (3) monitoring rural ambient and near-home concentrations of and personal exposures to PM2.5. Modeling efforts will enable manipulation of various sources and emission rates across a variety of relevant policy scenarios, enabling estimation of how certain initiatives may impact air pollution at varying scales.
This project leverages a multiple year collaboration between the University of California, Berkeley, and INCLEN, the International Clinical Epidemiology Network (New Delhi, India). INCLEN runs a large demographic and environmental surveillance site approximately 75 kilometers south of Delhi; their activities span over 50 villages covering approximately 200,000 individuals. While relatively close to Delhi, most households in the area rely on brushwood and dung as primary household fuels. The entire region is prone to low, ground-level inversions in the winter, resulting in especially high particulate matter concentrations between November and February.
Study findings will be disseminated to community members, policy makers and members of relevant ministries, environmental health practitioners, and other researchers through journal articles.
Progress Summary:
We have made significant progress on a number of fronts, including advances in emissions inventories, led by the University of Illinois; in-depth infield emissions characterization and subsequent chemical analyses, led by the University of California, Irvine (UCI); field-based PM2.5 ambient and near-home concentration measurements and personal exposure monitoring, UAV technology development, and stove use monitoring led by the University of California, Berkeley, and INCLEN. Briefly, advances in emissions inventories have focused on spatially and temporally explicit updates to existing emissions inventories leveraging in-depth emissions measurements and detailed survey data available at the village level in India. In-field emissions measurements undertaken in the past year include 48 simulated cooking events measuring a range of particle and gaseous pollutants. Analysis of collected samples is ongoing, but indicates unique dung and brushwood smoke signatures and potential climate and health implications related to the organic species released during combustion. Both the emissions inventories and emissions models have been discussed with the primary modeling leads at California Institute of Technology, to ensure they have all required inputs to perform modeling of secondary organic aerosol over North India. Finally, between December 2015 and early February 2016, real-time and gravimetric measurements of concentrations of and exposures to PM2.5 were collected in 42 households. Stove use monitoring has continued since the first year of the project with relatively few interruptions. Details of each component follow.
Emissions Inventories
Current emissions inventories mask significant temporal and spatial heterogeneity and often do not distinguish by task (cooking: frying, boiling, baking; heating; lighting). Our ongoing work extends the inventory created by Venkataraman et al. by using rich Indian consumption surveys and census data to better understand household energy characteristics at the village level. Our elaboration breaks down energy use into a number of activities and tasks, including cooking (frying, baking, boiling, etc), water and space heating, and primary and secondary lighting. Cooking and heating activities are further disaggregated by seven main fuel types. We include modifications to adjust for activities impacted by ambient temperature and rely on field-based emission factors and/or rates for CO2, PM2.5, black carbon, organic carbon, nitrous oxides, methane, sulfur dioxide. Figure 1 below illustrates the types of analyses enabled by the more highly resolved inputs described above.
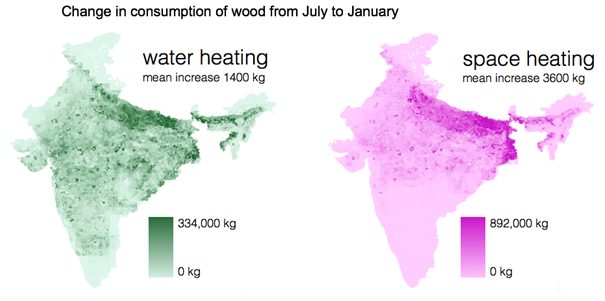
Figure 1: An example of the types of analyses enabled by more spatially and temporally resolved task-based emissions inventories. This figure depicts the estimated change in consumption of wood from July to January for water heating and space heating. Darker areas indicate a greater increase in wood across this time period, which represents a transition from summer to winter.
Emissions Measurements
Between August and September 2015, the research team from UCI evaluated emissions from two traditional Indian cookstoves (the chulha and angithi, see Figure 2) fueled by either bovine dung, brushwood, or a combination of both fuels. Fuels were evaluated at varying moisture contents as estimated using two techniques: a moisture probe and an oven where fuel was dryed.
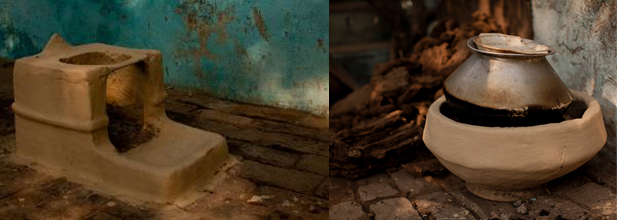
Figure 2: Common stoves in Palwal District, Haryana, India. The stove on the left is the typical primary cookstove, or chulha. The stove on the right is a typical portable simmering stove, or angithi. The chulha is typically fueled with a combination of dung and wood, while the angithi is fired primarily with dung.
Emissions testing was performed as part of a controlled field study in a real kitchen located in the village of Khatela, Palwal, Haryana, India. Both gaseous and particulate emissions samples were collected while a cook from the local community made prescribed traditional dishes (animal feed; rice and vegetables; or chapatti, an Indian wheat-based flat bread, and vegetables) using local fuel with a representative range of measured moisture contents chosen to span the range previously seen in our field studies. Table 1 describes the types of measurements obtained.
Table 1: Fuels and moisture content used and activities measured during in-field emissions sampling.
| Dung | Brushwood | Dung & Brushwood | ||||
| < 25% | > 25% | < 25% | > 25% | Dung > 25% + Brushwood < 25% | Dung + Brushwood < 25% | |
| Chulha Rice + Vegetables | 4 | 3 | 3 | 3 | 3 | 3 |
| Chulha Chapathi + Vegetables | 3 | 3 | 3 | 3 | 3 | 3 |
| Angithi Animal Feed | 5 | 6 | - | - | - | - |
Emissions were sampled using previously described methods. Additional sample lines were added to accommodate an expanded range of chemical analyses for this study. In brief, three-pronged metal probes were hung above each stove. Air was drawn through the probes using air sampling pumps (PCXR8, SKC Inc, Eighty Four, PA, USA) connected via conductive tubing during field-based cooking events. Ambient courtyard aerosols were monitored for the duration of each simulated cooking event.
PM2.5 particles were collected on two Teflon filters for gravimetric and chemical analysis, respectively, and on prebaked quartz filters for EC/OC analysis with a backing filter to correct for sampling artifacts caused by the condensation of gas-phase organic carbon onto quartz filters. A Teflon-coated aluminum PM2.5 cyclone (URG Corporation, North Carolina, USA) with a 3 liter per minute flow rate was used to collect emissions samples. Additionally, a multi-stage Sioutas cascade impactor (SKC Inc.) was utilized in the background to allow for a fine-particle D50 cut-point at flow rates >5 liters per minute. Real-time analyses of CO and CO2 was performed with a Q Trak 7575 (TSI, Inc), collecting data every fifteen seconds.
Non-methane volatile organic compounds (NMVOCs) were analyzed by Donald Blakes group at UCI using three gas chromatographs (each HP 6890), which form the core of the analytical system connected to a pre-concentrator. Two electron capture detectors (ECDs), sensitive to halocarbons and alkyl nitrates; two flame ionization detectors (FIDs), sensitive to hydrocarbons; and one quadrupole mass selective detector (MSD), were used for unambiguous compound identification and selected ion monitoring. Particulate matter (PM) collected on Teflon filters was analyzed in high-resolution (m/Δm ~100,000) experiments done with an LTQ-OrbitrapTM high resolution mass spectrometer (HR MS, Thermo Electron, Inc).
Preliminary Findings. Type of fuel led to the largest differences in primary organic aerosol composition. Nitrogen-containing compounds (CHN and CHON species) dominated emissions from dung cooking events, while they were not observed in emissions from brushwood cooking. Levoglucosan, a well-established biomass burning tracer, was present in all brushwood experiments as the most abundant peak, but was not present in all dung experiments. Potassium, another biomass burning tracer, was only observed in brushwood samples in the form of inorganic salts (K2Cl+, K3Cl2+) and as an adduct (K+) with organic compounds. Fuel and stove type both significantly affected the average modified combustion efficiency (unadjusted two-tailed p-values < 0.001). Dung burning cooking events had lower combustion efficiencies, and as expected, had increased emissions of hydrocarbons. Further, much larger emissions of propyl and ethylbenzenes, toluene, xylenes, and dimethyl sulfide (DMS), hydrocarbons relevant to ozone formation, were emitted from dung burning cooking events versus brushwood.
Stove Use Monitoring & Household and Ambient Air Pollution Measurements
Stove Use Monitors (SUMS). Stove Use Monitoring of between 3-5 cookstoves per home has been ongoing in 45 homes for approximately 1 year, resulting in 4.5 million data points representing 30,000 stove-days of data. Figure 3 is a graphical depiction of SUMs data from one household for multiple weeks.
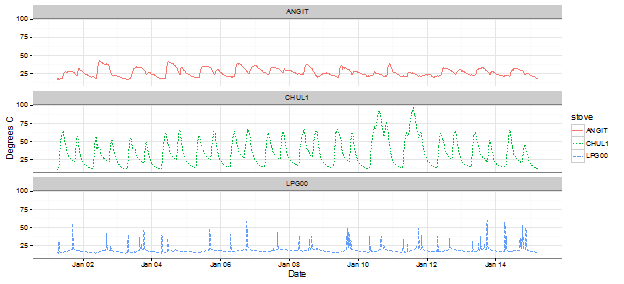
Figure 3: Stove Use Monitoring from a randomly selected household in early 2016. The top temperature trace is from a stove use monitor placed on an Angithi, a portable simmering stove. The middle trace is from a primary cookstove. The lower trace is from an LPG stove. The figure is indicative of mixed use of modern and traditional fuels. Note the regular use of the Chulha, consistent for this area.
Household Air Pollution Monitoring. Personal exposures to PM2.5 and near-home concentrations of PM2.5 were measured for 24 hours among 40 participants in Haryana between December 2015 and early February 2016. Households were selected from the pool in which SUMs were installed. Both personal and area monitoring included both real-time (using the Berkeley Air Particle and Temperature Sensor +, or PATS+) and gravimetric (SKC XR5000 drawing air through 37 mm PTFE filter attached to a BGI Triplex Cyclone) samplers. Additionally, in 8 households, personal exposures and area concentrations were measured in the same way for the same duration, but with no cooking (that is, food was provided for participants). In the same 8 households, we then asked participants to cook with only liquid petroleum gas (LPG) for 24 hours; measurements were repeated (analysis ongoing). A preliminary summary for this exercise is in Table 2 and Figure 4.
Table 2: Distributional statistics for personal and area PM2.5 sampling in January 2016 24-h µg/m3 PM2.5
| Location | Mean | SD | Min | Median | Max | N | |
| Cooking | Area | 626 | 321 | 117 | 503 | 1530 | 41 |
| No cooking | Area | 228 | 24.1 | 207 | 218 | 275 | 7 |
| Cooking | Personal | 488 | 185 | 186 | 456 | 1050 | 46 |
| No Cooking | Personal | 189 | 15.2 | 169 | 191 | 206 | 8 |
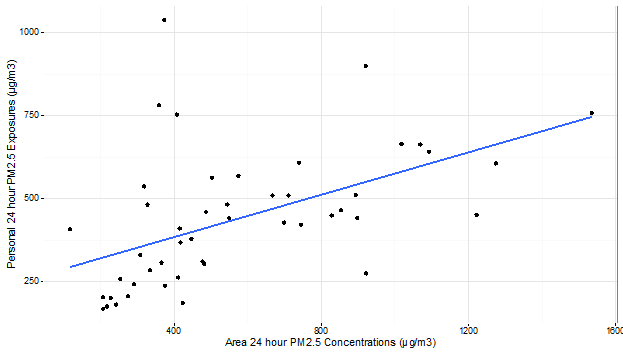
Figure 4: Personal vs area PM2.5 measurements in Haryana. 24 hour average area concentrations of PM2.5 in µg/m3 are on the X axis; 24 hour average personal exposures to PM2.5 in µg/m3 are on the y axis. The blue line is a linear model fit to the data; shaded areas are the standard errors. R2 = 0.33.
To reduce the difficult of performing personal exposure assessment, teams from Berkeley and INCLEN worked together to create an inexpensive, comfortable vest for cooks to wear that could unobtrusively hold all sampling equipment. We used a commercially available fleece vest as a template to which additional loops and pockets were added to hold sampling equipment and route tubing through the device. The vests were well-received and compliance for this short sampling activity was high.
Ambient Air Pollution. Ambient PM2.5 concentrations were assessed using the Metone E-Sampler, an outdoor sampler that collects simultaneous gravimetric and real-time PM2.5 data and a number of meteorological parameters, including wind speed and direction, relative humidity, and temperature. E-Samplers were located in two locations, one in the center of a small, 100 household village and one on the outskirts of the village. Figure 5 contains a graphical representation of typical data from an E-Sampler.
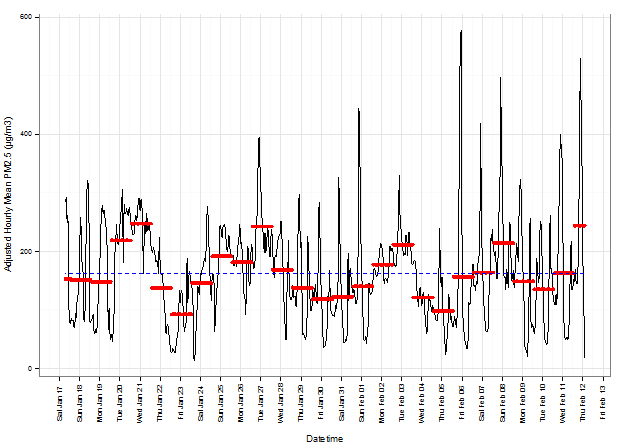
Figure 5: Adjusted E-Sampler PM2.5 data. The black line is the continuous trace of PM2.5 concentrations. Red lines are daily averages. The blue dotted line at approximately 160 µg/m3 is the overall mean for the sampling period. The minimum during this period was 14 µg/m3; the maximum was 576 µg/m3.
E-Sampler deployment required development of rugged, fluctuation-resistant power sources. To this end, each sampler is deployed with an array of solar panels connected to a 24-hour battery backup, which in turn is connected to line power. Additionally, an internal, 6 hour backup battery is placed in each E-Sampler as a backup. Field teams visit and service the samplers at least twice per week, cleaning inlets, performing flow checks, replacing internal pump and purge filters, and replacing pumps as needed. While the device is fairly rugged, it has suffered numerous pump failures during the highly polluted North Indian winters.
Future Activities:
Ambient monitoring and SUMs measurements will continue through the end of the current winter season (in February or March of 2017). We are evaluating the possibility of another round of personal exposure assessment this winter. We anticipate finishing the emissions inventories and continuing analyses of emissions measurements, with a focus on those inventories and samples most needed to enable California Institute of Technology to perform the proposed atmospheric modeling.
Journal Articles:
No journal articles submitted with this report: View all 11 publications for this projectSupplemental Keywords:
Cookstoves, emissions, ambient air pollution, air pollution, IndiaProgress and Final Reports:
Original AbstractThe perspectives, information and conclusions conveyed in research project abstracts, progress reports, final reports, journal abstracts and journal publications convey the viewpoints of the principal investigator and may not represent the views and policies of ORD and EPA. Conclusions drawn by the principal investigators have not been reviewed by the Agency.