U.S. flag

An official website of the United States government

Here’s how you know

Dot gov

Official websites use .gov
A .gov website belongs to an official government organization in the United States.

HTTPS

Secure .gov websites use HTTPS
A lock (LockA locked padlock) or https:// means you have safely connected to the .gov website. Share sensitive information only on official, secure websites.

  • Environmental Topics
  • Laws & Regulations
  • Report a Violation
  • About EPA
Contact Us

Grantee Research Project Results

2014 Progress Report: Using Advanced Statistical Techniques to Identify the Drivers and Occurrence of Historical and Future Extreme Air Quality Events in the United States from Observations and Models

EPA Grant Number: R835228
Title: Using Advanced Statistical Techniques to Identify the Drivers and Occurrence of Historical and Future Extreme Air Quality Events in the United States from Observations and Models
Investigators: Heald, Colette L. , Brown, Barbara G , Hodzic, Alma , Reich, Brian , Cooley, Dan , Gilleland, Eric
Current Investigators: Heald, Colette L. , Hodzic, Alma , Reich, Brian , Cooley, Dan
Institution: Massachusetts Institute of Technology , North Carolina State University , Colorado State University
Current Institution: Massachusetts Institute of Technology , Colorado State University , National Center for Atmospheric Research , North Carolina State University
EPA Project Officer: Chung, Serena
Project Period: June 1, 2012 through May 31, 2015 (Extended to May 31, 2016)
Project Period Covered by this Report: June 1, 2014 through May 31,2015
Project Amount: $749,931
RFA: Extreme Event Impacts on Air Quality and Water Quality with a Changing Global Climate (2011) RFA Text |  Recipients Lists
Research Category: Air Quality and Air Toxics , Climate Change , Watersheds , Air , Water

Objective:

Extreme weather events can be accompanied by extreme air quality degradation with associated costs to human health and society. The relationship between extreme weather and air quality is poorly understood, and relatively untested in models. Given expected changes to climate, we will quantify this hazard based on the observational record and verify with what fidelity models reproduce the relationships between extreme weather and air quality for present day and then project how these might change in the future.

Progress Summary:

This third year of the project has focused on finalizing previous work on the application of statistical approaches to observational analysis and the initiation of new investigations of how these are represented in models. The CSU team led by Dan Cooley has developed a spatial extension of its approach for applying extreme value theory to ozone concentrations and is working on two publications describing the results from this project. They are also collaborating with the NCAR team to apply this analysis framework to the WRF-Chem model output. The MIT team led by Colette Heald completed a study that applied the quantile regression approach to identifying the meteorological drivers of both O3 and PM2.5 from observations over the United States. This team now is investigating how global models reproduce this behavior, with a focus on the ozone response.

Key Findings 

Extreme Value Analysis (CSU, NCAR) 
 
The goal of the efforts led by the CSU team (in collaboration with the MIT and NCSU groups) is to understand the meteorological conditions that lead to extreme ground level ozone conditions. As ozone forms as a secondary pollutant from the combination of NOx and VOCs interacting with sunlight, it is well known that ozone is strongly correlated with both temperature and solar radiation. However, exploratory analysis shows that these covariates alone are not enough to distinguish a day with a high level of ozone from one where ozone is at its most extreme levels. Our work this year has been to fully develop and refine the method that was discussed in last year’s report. We provide details below. Our proposed method relies on a framework provided by extreme value theory. Extreme value theory is the branch of statistics that specifically aims to characterize the upper tail. We use a framework that allows us to characterize the tail dependence between variates and typical dependence metrics such as correlation characterize dependence in the center of the distribution. However, dependence can change in different levels of the distribution and there are metrics better suited for measuring dependence in the tail. 
 
We have devised a statistical method for performing data mining for extreme behavior. No such method previously existed. There are two pieces to our data mining procedure: the first involves maximizing the tail dependence between a set of covariates and the ozone response, and the second is a model selection procedure. 
 
Our procedure to optimize the tail dependence finds the maximal tail dependence between all possible linear combinations of meteorological covariates and the ozone response. To obtain convergence, the optimization procedure required that we use a smooth threshold that previously had not been considered in extreme value theory. For statistical rigor, we found conditions on the amount of smoothing that guarantee consistency of our estimator. A simulation study shows that our method, because it is tailored to address extreme behavior, out performs other regression approaches such as linear regression, logistic regression, or quantile regression. 
 
The model selection procedure aims to find which combination of covariates best describes the extreme behavior. The tail dependence metric focuses on the largest observations only (we are using the top 3%) and would be maximized if regression parameters could be found such that the concordance between the linear combination and the ozone completely agree. We use a cross validation procedure, adapted to our measure of tail dependence, to perform model selection. A simulated annealing procedure allows for an automated search of the model space. 
 
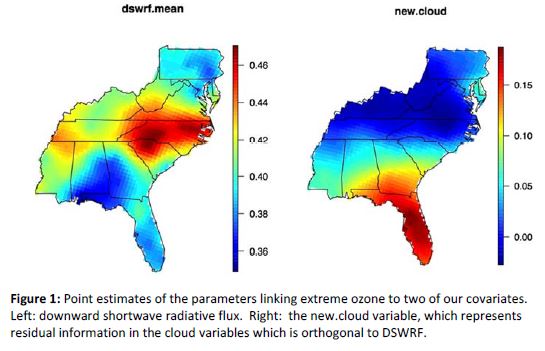
We have applied the method to ozone data from both Atlanta and Charlotte in order to compare responses from the two cities. Figure 1 shows the meteorological covariates that appear in the best scoring models. While the expected meteorological drivers of air temperature and wind speed appear in nearly all of the best scoring models, some other somewhat surprising meteorological drivers also seem to play a role in the most extreme ozone days. For example, precipitation appears in many of the best scoring models, and this is somewhat contrary to Jacob and Winner [2009], who found little effect on ground level ozone from precipitation. We also find that CAPE and relative humidity seem to be related to extreme ozone and this has spurred conversation within the project team about what role these meteorological variables play. The similar results from Atlanta and Charlotte give credence to the method.
 
 
Publication of the first manuscript has proved to be more challenging than anticipated. The manuscript went through two revisions before being ultimately rejected by the first journal to which it was submitted. The manuscript represents a significant departure from standard extremes studies, and ultimately we were unable to convince one reviewer of its merit, although the other reviewer was fully supportive. The manuscript has been submitted to another top statistics journal, and a revision of the manuscript is
currently being reviewed.
 
A spatial extension of the analysis has been performed. We estimate the drivers of extreme ozone at over 100 stations. Then, we apply a spatial model that accounts for the level of uncertainty associated with the parameter estimates at the stations. The spatial model allows us to produce maps of point estimates for the drivers’ parameters along with measures of their uncertainty. This work appeared in Brook Russell’s thesis. A manuscript is in preparation.
 
The NCAR/CSU team is investigating whether the meteorological variables that drive extreme ozone behavior for the observational (station) data are the same for those that drive extreme ozone behavior in WRF-Chem simulations. We examine both observational records and WRF-Chem output for 10 summers in the past 1996-2005 at 8 cities. Thus far, we have found that marginally, the distributions of extreme ozone between the observations and WRF-Chem output can differ considerably (Figure 2). We are employing the methodology used in the Russell, et al. (2015) manuscript to understand how extreme ozone relates to 8 meteorological variables found to be primary drivers. 
 

Comparing Observed and Modeled Sensitivities of Ozone Air Quality Extremes to Meteorological Drivers (MIT) 
 
Over the previous years of the project, the MIT team (PI Colette Heald, and postdoc Dr. Will Porter) focused on developing a robust, quantitative approach to characterizing the response of air quality to meteorological drivers that can be applied to both observations and models. We have been using quantile regression as a means of directly contrasting the response at either low, high, or median levels of ozone. This also is a relatively straightforward method that does not require some of the extensive variable transformations and regularizations imposed, for example, by extreme value theory. The overall goals of this project are: (1) to determine which meteorological drivers ozone and PM2.5 respond to most strongly, (2) how this differs for extreme ozone vs. median ozone levels, and (3) whether models reproduce the observed behavior.
 
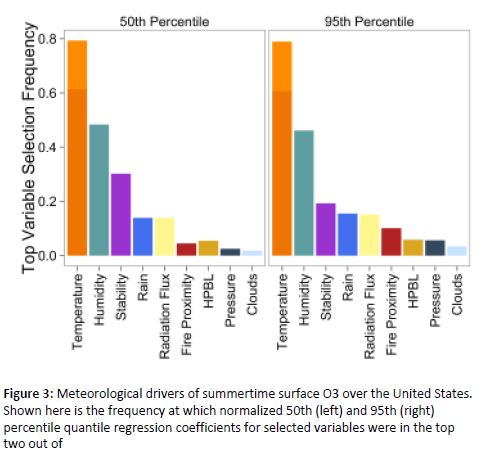
Our objective here was to find a computationally efficient way of analyzing data from across the United States, but without pre-selecting for expected results. Our variable selection and filtering approach are described in our paper (Porter, et al., 2015). We applied this methodology to analyze the meteorological drivers for surface O3 and PM2.5 observed at sites across the United States over the past decade. We contrasted the results by pollutant type, season, and pollutant level. Figure 3 shows an example of the results for summertime ozone. We find that temperature and high relative humidity are key drivers of summertime ozone, whereas wintertime ozone levels are most commonly associated with incoming radiation flux (not shown). PM2.5 concentrations also are driven by temperature, but wind speed and tropospheric stability metrics are also important predictors for PM2.5. We also find key differences in sensitivities across regions and quantiles. For example the nationally averaged sensitivities of 95th percentile summertime ozone to temperature are 0.9 ppb/deg, while the mean sensitivity of the 50th percentile summertime ozone is only 0.6 ppb/deg. Figure 4 shows how the sensitivity of ozone to temperature varies across the ozone distribution (contrasting 5th, 50th and 95th) but how a variable such as downwelling shortwave radiation flux exhibits similar sensitivities across the distribution of ozone concentrations. While the variable selection process is a key element of developing a robust analysis, quantile regression, which has not been broadly applied in the air pollution/atmospheric chemistry community, offers a simple and direct way to contrast the response of air pollutants to drivers across the distribution of observed concentrations. 

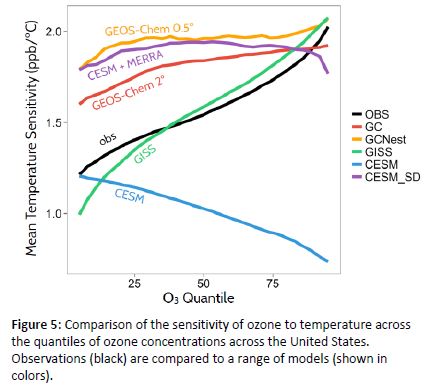
Following this analysis, we have turned to our investigation of how models reproduce the observed behavior. Here, we focus on temperature as the key driver of summertime ozone. Figure 5 presents our surprising initial comparison of the sensitivity of simulated ozone to temperature from various models to that observed. The model simulations shown here are for different years, with different meteorological drivers and emissions and thus cannot be directly compared. Nevertheless, they suggest a range of very different model responses to temperature, including one model (CESM), which exhibits a negative tendency of sensitivity with ozone levels. This result has profound implications for the ability of models to capture the ozone response to a warming climate. Figure 5 also includes a comparison of the ozone response at different spatial resolutions (0.5°x0.5° vs. 2°x2.5°) demonstrating that the varying response across the quantiles does not appear to be sensitive to resolution (although the absolute magnitude of the sensitivity is enhanced with resolution). We currently are using the GEOS-Chem model to diagnose the temperature sensitivity to ozone and attribute this to PAN decomposition, biogenic emissions, soil NOx emissions, temperature dependence of reactions, and the temperature/RH dependence of stomatal conductance (and the impact on dry deposition). We plan to summarize these results and submit a publication on these results in the next several months. 
 
 
Spatial Analysis (NCSU)
 
The thesis work of NC State Statistics PhD student Sam Morris was funded by this grant. Sam plans to defend in Spring 2016. In his primary paper, he has developed a computationally efficient method for spatial interpolation of extreme ozone events. The scientific objective of this work is to produce a map of the probability of extreme ozone events using monitor data from EPA monitors as well as CMAQ output. The classic extreme value analysis of these data would rely on a complex mathematical concept called a max-stable process. As an alternative, Sam’s approach uses a spatial student t distribution. He shows that this method is far faster than the implementation of a max-stable process, and actually provides better predictive performance in this application. We hope this method will prove to be useful for large-scale spatial modeling of extreme events including air pollution. This paper has been submitted to Biometrics.
 
In addition to modeling air pollution events, we have conducted research on the health effects of extreme air pollution. In a paper recently submitted (Wilson, et al., 2015), we develop a non-linear response surface to characterize the health risk of ozone exposure, including potentially greater effect for extreme days, and use this relationship to project health effects under changing climate and exposure regimes. This work has been submitted to the Journal of Exposure Science and Environmental Epidemiology.

Future Activities:

In the coming year, we anticipate the completion of the overall project and the submission of a number of papers describing these results. 
 
We also anticipate final publication of the CSU team’s paper describing the extreme value analysis methods. We will submit the second CSU publication detailing the spatial analysis before January 2016. In the winter and spring of 2015-1016, Miranda Fix (PhD student in CSU’s statistics department) under the direction of Cooley (CSU), Hodzic-Roux (NCAR), and Gilleland (NCAR), will complete the comparative analysis at the 8 cities for the observational data and WRF-Chem output. The manuscript will be drafted in the Spring of 2016.The MIT team expects to complete the global modeling investigation of this project within the next 6 months, culminating in a journal publication. Dr. Will Porter will be presenting these results at the AGU Fall Meeting in San Francisco. In the next reporting period, the NCSU team will revise and resubmit the current papers as well as complete an ongoing project on using extreme value analysis methods to analyze rare binary data, such as rare air pollution events. 


Journal Articles on this Report : 5 Displayed | Download in RIS Format

Publications Views
Other project views: All 38 publications 12 publications in selected types All 12 journal articles
Publications
Type Citation Project Document Sources
Journal Article Porter WC, Heald CL, Cooley D, Russell B. Investigating the observed sensitivities of air-quality extremes to meteorological drivers via quantile regression. Atmospheric Chemistry and Physics 2015;15(18):10349-10366. R835228 (2014)
R835228 (Final)
  • Full-text: ACP-Full Text PDF
    Exit
  • Abstract: ACP-Abstract
    Exit
  • Other: ResearchGate-Full Text PDF
    Exit
  • Journal Article Reich BJ, Shaby BA. A hierarchical max-stable spatial model for extreme precipitation. Annals of Applied Statistics 2012;6(4):1430-1451. R835228 (2013)
    R835228 (2014)
    R835228 (Final)
  • Full-text from PubMed
  • Abstract from PubMed
  • Associated PubMed link
  • Full-text: Project Euclid-Full Text PDF
    Exit
  • Abstract: Project Euclid-Abstract
    Exit
  • Other: NC State University-Full Text PDF
    Exit
  • Journal Article Reich BJ, Chang HH, Foley KM. A spectral method for spatial downscaling. Biometrics 2014;70(4):932-942. R835228 (2013)
    R835228 (2014)
    R835228 (Final)
    R834799 (2014)
    R834799 (2015)
    R834799 (2016)
    R834799 (Final)
  • Full-text from PubMed
  • Abstract from PubMed
  • Associated PubMed link
  • Full-text: Europe PMC-Full Text HTML
    Exit
  • Abstract: Wiley-Abstract
    Exit
  • Other: ResearchGate-Full Text PDF
    Exit
  • Journal Article Reich B, Cooley D, Foley K, Napelenok S, Shaby B. Extreme value analysis for evaluating ozone control strategies. Annals of Applied Statistics 2013;7(2):739-762. R835228 (2012)
    R835228 (2013)
    R835228 (2014)
    R835228 (Final)
  • Full-text from PubMed
  • Abstract from PubMed
  • Associated PubMed link
  • Full-text: Project Euclid-Full Text PDF
    Exit
  • Abstract: Project Euclid-Abstract
    Exit
  • Other: NC State University-Full Text PDF
    Exit
  • Journal Article Sun W, Reich BJ, Cai TT, Guindani M, Schwartzman A. False discovery control in large-scale spatial multiple testing. Journal of the Royal Statistical Society: Series B, Statistical Methodology 2015;77(1):59-83. R835228 (2013)
    R835228 (2014)
    R835228 (Final)
  • Full-text from PubMed
  • Abstract from PubMed
  • Associated PubMed link
  • Full-text: University of Pennsylvania-Full Text PDF
    Exit
  • Abstract: Wiley Online-Abstract
    Exit
  • Progress and Final Reports:

    Original Abstract
  • 2012 Progress Report
  • 2013 Progress Report
  • Final Report
  • Top of Page

    The perspectives, information and conclusions conveyed in research project abstracts, progress reports, final reports, journal abstracts and journal publications convey the viewpoints of the principal investigator and may not represent the views and policies of ORD and EPA. Conclusions drawn by the principal investigators have not been reviewed by the Agency.

    Project Research Results

    • Final Report
    • 2013 Progress Report
    • 2012 Progress Report
    • Original Abstract
    38 publications for this project
    12 journal articles for this project

    Site Navigation

    • Grantee Research Project Results Home
    • Grantee Research Project Results Basic Search
    • Grantee Research Project Results Advanced Search
    • Grantee Research Project Results Fielded Search
    • Publication search
    • EPA Regional Search

    Related Information

    • Search Help
    • About our data collection
    • Research Grants
    • P3: Student Design Competition
    • Research Fellowships
    • Small Business Innovation Research (SBIR)
    Contact Us to ask a question, provide feedback, or report a problem.
    Last updated April 28, 2023
    United States Environmental Protection Agency

    Discover.

    • Accessibility
    • Budget & Performance
    • Contracting
    • EPA www Web Snapshot
    • Grants
    • No FEAR Act Data
    • Plain Writing
    • Privacy
    • Privacy and Security Notice

    Connect.

    • Data.gov
    • Inspector General
    • Jobs
    • Newsroom
    • Open Government
    • Regulations.gov
    • Subscribe
    • USA.gov
    • White House

    Ask.

    • Contact EPA
    • EPA Disclaimers
    • Hotlines
    • FOIA Requests
    • Frequent Questions

    Follow.