Grantee Research Project Results
Final Report: Biowall’s Impact on Indoor Air Quality and Energy
EPA Grant Number: SU835730Title: Biowall’s Impact on Indoor Air Quality and Energy
Investigators: Hutzel, William J
Institution: Purdue University
EPA Project Officer: Hahn, Intaek
Phase: II
Project Period: August 15, 2014 through August 14, 2016
Project Amount: $90,000
RFA: P3 Awards: A National Student Design Competition for Sustainability Focusing on People, Prosperity and the Planet - Phase 2 (2014) Recipients Lists
Research Category: P3 Challenge Area - Sustainable and Healthy Communities , Sustainable and Healthy Communities
Objective:
With the rise of energy efficient homes, indoor air quality (IAQ) poses a difficult challenge between balancing energy conservation and the need to maintain a healthy indoor air environment. Maximizing house insulation and making a residence airtight are basic approaches to reduce energy consumption for heating and cooling. However, this can create stale air inside a house that needs to be supplemented with fresh air at regular intervals. Standards such as ASHRAE 62.2 (Ventilation and Acceptable Indoor Air Quality in Low-Rise
Residential Buildings) came into place to define the minimum ventilation requirements based on the building's square footage and the number of its occupants. But, in spite of adapting ventilation standards and using outside air ventilation to address IAQ, improvements are still needed to achieve buildings that are optimal for human comfort, health, and productivity.
IAQ is still a serious issue in buildings, as the Environmental Protection Agency (EPA) classified the problem as one of its main health concerns. The main contributors to the pollution in indoor air are the volatile organic compounds (VOCs) that are emitted from many household products and construction materials. For instance, adhesives and paint can emit Toluene and Benzene, while new clothing and carpets off-gas formaldehyde, and these are just some examples of the many types of VOCs found in buildings. Therefore, properly designed ventilation systems have become essential in residential buildings, especially the airtight ones.
In addition to ventilation, there is also opportunity for innovative air cleaning devices to improve indoor air quality. Studies have shown that plants can eliminate VOCS both in their rhizosphere and phyllo sphere through phytoremediation. A Biowall was designed and built take advantage of these helpful air cleaning characteristics. The medium in which the plants 

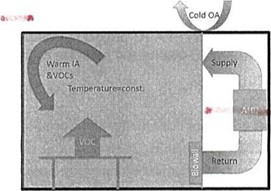
Figure I illustrates how poor IAQ is addressed by a Biowall. It shows how a modern airtight home minimizes the interaction of cold outdoor air (OA) with warm indoor air (IA). But due to VOC emissions from various sources the IA between becomes stale and polluted. The Biowall is installed in the return duct of a home's HVAC system to clean the air and then send it back through the home's Air Handler (AHU).
Figure 1. A Biowall was designed and built to improve IAQ in homes.
Summary/Accomplishments (Outputs/Outcomes):
This project built a new Biowall test apparatus, conducted experiments on its air cleaning potential in a laboratory setting, and deployed a new full scale Biowall into a research home:
Improved Biowall Test Apparatus
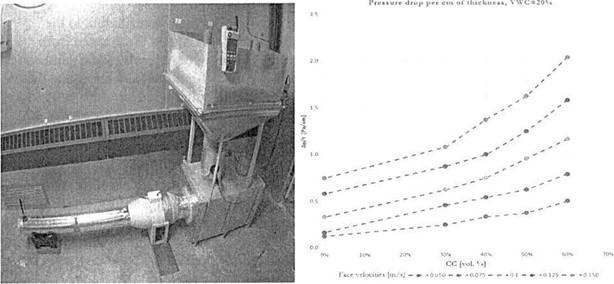
Figure 2 shows a new test apparatus was built and used to carry out a series of tests to help refine the overall Biowall design. The device was used to look specifically at the interaction between the plants/growth media and the ventilation air using a single vertical plenum with plants placed in a horizontal box with growth media. The test apparatus was placed in an environmental chamber and used to test various growth media compositions and select one that would keep the pressure drop across the Biowall at a minimum and also maintain sufficient moisture in the filter bed for optimal plant health.
Figure 2. Test apparatus position in the environmental chamber and pressure drop per cm. of thickness.
The results from this testing were also used to optimize the irrigation strategy, identify 
Full Scale Biowall Development
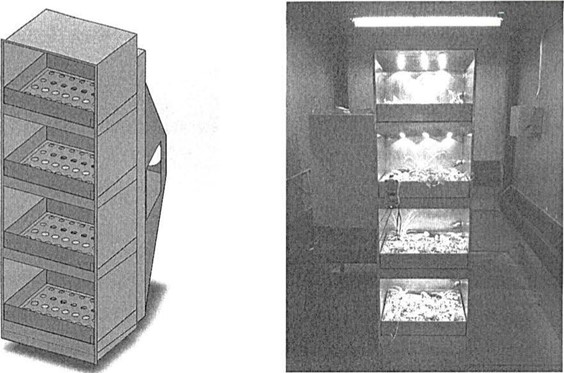
Building on experiments with the Biowall test apparatus, a new full scale Biowall was designed and built. Figure 3 shows the CAD rendering (left) and the actual device as it was tested in the laboratory (right). The device is a stainless steel plenum that has four removable trays of plants. An automation system monitors the plants and reduces the amount of day to day interactions by the homeowner by controlling the lights, watering, and airflow.
Figure 3. A full scale Biowall was evaluated in a laboratory setting.
A gas dispersal system was developed to evaluate the VOC removal capability of the
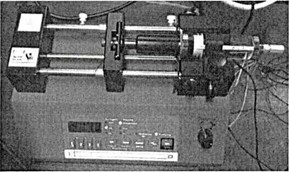
Biowall. Figure 4 shows this device, which used a syringe pump with an atomizing nozzle to inject a precise amount of gas-phase Toluene into an environmental chamber. A LabVIEW data acquisition system was used to measure and regulate the ppm level of Toluene during a test. Repeated testing and data collection showed that the Biowall was effective at reducing the Toluene levels in the environmental chamber.
Figure 4. A computer controlled syringe pump and nozzle was used for VOC dispersal,
An example of a laboratory-based Biowall VOC removal test using Toluene is shown in Figure 5. The graph shows a normalized concentration of Toluene from 0 to 100% on the vertical axis. The horizontal axis is the duration of the test in hours. The different decay curves are the results of different tests. The upper curve, show in blue, is the natural decay of Toluene without a Biowall present. The blue curve shows that Toluene levels remained at 70% of their original concentration many hours after the injection. The other curves show the impact of the Biowall at reducing VOC levels using different fan speeds and different moisture levels for the growth media.
Figure 5: Biowall decay tests using Toluene with high speed (B WH) and Low Speed (BWL).
The Biowall with a low fan speed showed a faster decay rate than the Biowall with a high fan speed. The Biowall with a low fan speed (labelled BWL on the graph) removed up to 90% of the initial concentration within the first two to three hours of the test, In contrast, the Biowall with a high fan speed (labelled B WH on the graph) removed up to 80% of the initial concentration within the first three to four hours of the test. The reason behind the difference between the two speeds is likely due to the empty bed residence time (EBRT), which is the time taken for the contaminated air to pass through the tray. Since the Biowall with a low fan speed has a higher EBRT, the low fan speed provides more time for the contaminated air to be absorbed by the growth media.
Additionally, the water content of the growth media influenced the test results for both fan 


Additional research was done to improve the operation of the Biowall by evaluating plant health under a variety of operating conditions. Control programs were developed to automated the lights, watering and fan on the Biowall. The effectiveness of these programs was evaluated over an extended period and at a variety of test conditions. Figure 6 is an image of one the Biowall's trays. The image of the left is an image of a plant tray at the start of the experiment, the image on the right is an image of the plants at the end of the period. From the images it can be seen that growth occurred in all six plants, but the degree of growth was difTerent in different plants.
Figure 6. Optimization of plant health in a Biowall,
Community Outreach
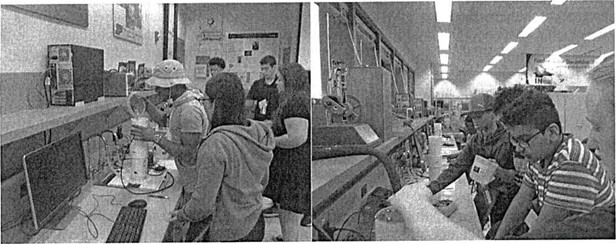
The Biowall research team hosted workshops for high school students who attended summer camps at Purdue during the summers of 2015 and 2016. Eight camp sessions were held with participation by more than 300 high school students. Figure 7 shows high school students working on a Biowall pressure test apparatus that was constructed to measure the pressure drop across the Biowall growth media. The students learned that the pressure drop was 
Figure 7. Biowall summer camp outreach.
ReNEWW house installation
The Biowall has been installed into a research house that is located close to the Purdue campus. The ReNEWW house is an on-going project sponsored by Whirlpool Corporation to showcase a variety of next generation technologies for homes. This project is significant because it is specifically addressing sustainability in existing homes.
Figure 8 has several views of the RENEW W house. The image to the left is the exterior of the ReNEWW showing the photovoltaic array on the roof. The middle image is the drawing for the Biowall installation. The image to the left shows the fully operational Biowall.
Figure 8. Biowall installed into the RENEWW house.
Data is being collected on the HVAC, IAQ, and aesthetic characteristics of the Biowall in the ReNEWW house. The information collected here will further improve the Biowall design that is being commercialized.
Conclusions:
This EPA P3 project has evaluated Biowall concepts in a laboratory and in a home. The laboratory research was conducted first and provided ideas and design concepts that were incorporated into the full scale Biowall that was installed in a home. The Biowall has been shown to remove VOC's from air, thereby improving indoor air quality. The device has the potential to save energy by reducing the need for outside air that is expensive to heat and 

The next phase of this work after the EPA P3 project is full scale commercialization. We are actively seeking partnerships with developers, contractors, and corporations interested in developing and marketing products that promote sustainability in the built environment, particularly residential. The Biowall has potential to improve indoor air quality, save energy, and promote green lifestyles to homeowners.
Journal Articles on this Report : 2 Displayed | Download in RIS Format
| Other project views: | All 6 publications | 2 publications in selected types | All 2 journal articles |
|---|
| Type | Citation | ||
|---|---|---|---|
|
|
Newkirk DW, Hutzel WJ, Dana M, Qu M. Energy modeling of a botanical air filter. ASHRAE Transactions 2015;128(1):8. |
SU835730 (2015) SU835730 (Final) |
Exit |
|
|
Newkirk D, Evans JS, Alraddadi OS, Kelemen CG, Mietusch R, Xue Y, Rajkhowa B. Plant-assisted air-conditioning systems for a better tomorrow. IEEE Potentials 2015;34(1):11-17. |
SU835730 (2015) SU835730 (Final) |
Exit |
Supplemental Keywords:
Indoor Air Quality, VOC, net zero energyRelevant Websites:
Progress and Final Reports:
Original AbstractP3 Phase I:
Biowall’s Impact on Indoor Air Quality and Energy | Final ReportThe perspectives, information and conclusions conveyed in research project abstracts, progress reports, final reports, journal abstracts and journal publications convey the viewpoints of the principal investigator and may not represent the views and policies of ORD and EPA. Conclusions drawn by the principal investigators have not been reviewed by the Agency.


