
Grantee Research Project Results
Final Report: Tracking Semivolatile Organic Compounds Indoors: Merging Models and Field Sampling to Access Concentrations, Emissions, and Exposures
EPA Grant Number: R835641Title: Tracking Semivolatile Organic Compounds Indoors: Merging Models and Field Sampling to Access Concentrations, Emissions, and Exposures
Investigators: Bennett, Deborah H. , Young, Thomas M , Shin, Hyeong-Moo
Institution: University of California - Davis
EPA Project Officer: Aja, Hayley
Project Period: September 1, 2014 through August 31, 2017 (Extended to August 31, 2018)
Project Amount: $900,000
RFA: New Methods in 21st Century Exposure Science (2013) RFA Text | Recipients Lists
Research Category: Chemical Safety for Sustainability
Objective:
Objective of Research: The environmental health community has growing concerns about many of the semivolatile organic compounds (SVOCs) introduced into residential environments resulting in exposures to these compounds and their transformation products. Methods for conducting rapid toxicological assessments are currently being utilized to help evaluate the hazards. Similar methods are needed in exposure science in order to determine safe levels for use by consumers. To address this need, we propose here assessments based on effective merging of measurements and models. The goals of this project are to (1) measure concentrations of a broad spectrum of target and non‐target SVOCs in indoor dust to estimate emission rates and exposures, (2) refine and evaluate a multi‐ compartment indoor fate, transport, and exposure model, and (3) evaluate air‐to‐skin transdermal uptake models
The report is organized by the objective, with the full text listed in the grant provided.
Summary/Accomplishments (Outputs/Outcomes):
Objective 1: Measure concentrations of a broad spectrum of SVOCs in indoor dust to estimate emission rates and exposures
- Develop a novel analytical workflow for rapid assessment of a broad spectrum of SVOCs in dust, skin, and polyurethane foam using high resolution mass spectrometry. We will use the new generation of liquid chromatography time-of-flight mass spectrometry (LC-TOF-MS) and gas chromatography (GC)- TOF-MS instrumentation to identify and quantify a far more comprehensive set of SVOCs in dust.
- Collect indoor dust samples and measure concentrations of a broad spectrum of SVOCs . By collecting dust from homes and using newly developed applications that combine analyses for pre-selected target compounds as well as other non-target compounds in the sample, we will identify exposure concentrations for a comprehensive set of SVOCs.
- Use measured dust concentrations and inverse modeling to estimate emission rates that can be used to estimate human residential exposures . Combining field data with our indoor mass-balance model allows us to determine corresponding emission rates, a critical model input with little to no existing data. With these emission rates, we will use our indoor exposure model to estimate chemical exposures that can then be compared to toxicological levels of concern and identify candidate compounds for source reduction to improve public health.
- Conduct factor analysis on dust concentrations to look for common source profiles. This technique will help us understand potential sources of concern and will be substantially aided by the larger set of potential marker compounds that may be diagnostic for particular sources.
Introduction
Indoor environments have been recognized as an important research area to understand the impact of chemical exposures on human health 1, because people spend most of their time indoors 2 and some studies reported consistently higher concentrations of chemicals of concern indoors versus outdoors 3,4. Consequently, the need to develop methods to better characterize indoor chemical exposures has become a high priority in the field of exposure science 5-9. In indoor environments, consumer products are major sources of human exposure to semivolatile organic compounds (SVOCs), including ingredients in insecticides, plasticizers, flame retardants, water- and oil-repellents, and personal care products (PCPs) 10. SVOCs released from their original sources are fairly persistent indoors, and are redistributed over time and partitioned to indoor air, settled dust, and other indoor surfaces 11,12. As a result, individuals are exposed to SVOCs via inhalation, dermal uptake, and non-dietary ingestion of settled dust 5.
For SVOCs with low vapor pressures, their levels in indoor dust are known as an alternate marker of chemical exposure with common indoor sources (furniture, plastics, PCPs, pesticides, etc.) 13. Studies found that concentrations in dust for some of these SVOCs were correlated with those in indoor air and other indoor surfaces, as well as those measured in biological samples 14-19. Therefore, dust concentrations have been used as a surrogate for human exposure in epidemiologic studies 20-23. Dust levels were also used to reconstruct total (non-dietary) residential exposure by applying equilibrium partitioning models to estimate corresponding concentrations in the gas-phase (both inhalation and air- to-skin dermal uptake) and in airborne particles (inhalation) 13. However, a complete picture of the chemical fingerprint of dust (i.e., identity and quantity of all chemicals present) is missing, because most previous studies analyzed known chemical classes via a targeted analytical approach 13,24-28.
With recent developments in high-resolution mass spectrometry, it is possible not only to look for known compounds (targets) for which authentic standards are available, but also to screen for expected compounds from a database or library (suspects) and even to identify previously unknown compounds (non-targets) through careful examination of the high resolution mass spectra.29
While screening methods by liquid chromatography high-resolution mass spectrometry (LC-HRMS) have been applied often for aqueous media30-35, non-target screening studies in other environmental media such as household dust are still rare. So far, the most thorough investigation of non-targets in dust has been done by Rager et al. (2016)36 who investigated more than 50 dust samples by LC time of-flight (TOF) MS. They linked the proposed formulas to EPA's Distributed Structure-Searchable Toxicity (DSSTox) database. However, their identification was only based on molecular formula match, as they did not acquire MS/MS data. A recent study by Ouyang et al. (2017)37 applied two-dimensional (LCxLC)- ToF MS in order to get a better separation of the non-target features. However, as they only looked into one dust sample, the generalizability of these results is limited. Other non-target studies specifically looked at flame retardants or brominated azo dyes in household dust38-40. Hilton et al. (2010)41 used two dimensional GCxGC-MS coupled to electron ionization (EI) to investigate non-target chemicals in dust including phthalates, polycyclic aromatic hydrocarbons, chlorinated compounds, brominated compounds, and nitro compounds.
Taking a closer look at the chemicals previously detected in dust and the analytical methods with which the chemicals were analyzed, it becomes clear that dust contains chemicals with diverse physico- chemical properties and structures. Chemicals range from very polar and non-volatile surfactants to non-polar and semi-volatile brominated flame retardants. This is also reflected in the number of analytical studies that have investigated chemicals in dust; roughly the same number of methods are based on LC-MS compared to GC-MS. To date there is no study that comprehensively investigated chemicals by both platforms (LC-MS and GC-MS) at the same time. Hence, a complete picture of the chemical fingerprint in household dust is missing, as is a comparison of the strengths and weaknesses of the two analytical approaches.
This research gap is addressed in the present study, which uses a target, suspect and non-target screening workflow for polar to semi-polar chemicals analyzed by LC-HRMS as well as a target and non- target screening method for non-polar chemicals analyzed by GC-HRMS. A total of 38 household dust samples were collected in California, and the findings of the detected chemicals are discussed. The differences between the non-target screening approaches on both platforms (LC-HRMS and GC-HRMS) are critically discussed and the complementary roles of the two platforms are acknowledged. We present SVOC concentrations analyzed in our dust samples and calculate source strengths.
Materials and Methods:
Dust sampling and Extraction
Dust samples from 38 households in the areas of Sacramento and Fresno, CA, were collected from the main living area with the High Volume Small Surface Sampler (HVS3) using a standard protocol42 and stored in a PTFE container at -20°C until extraction. Dust samples were sieved (106 µm) and 100 mg were sonication extracted using hexane:acetone (3:1 v/v) and acetone (100%). The extract was evaporated, filtered and split into a GC-fraction and a LC-fraction which were run on the corresponding instruments.
Targeted Chemical List Selection
A total of 76 chemicals to be analyzed by GC-Q/TOF and 56 chemicals to be analyzed by LC-Q/TOF were selected for this study. The selection comprised one or multiple indicator compounds from substance classes identified previously28,43-48 or compounds present in consumer products listed in the Consumer Product Chemical Profiles CPCP database49. The target list consisted of pentabromodiphenyl ether (BDE), organophosphate flame retardants (OP-FR), phenols, polycyclic aromatic hydrocarbons (PAH), phthalates, UV filters, components of fragrances, pesticides, plasticizers, parabens, biocides, polyfluorinated compounds, surfactants and skin oils.
GC-Q/TOF and LC-Q/TOF analysis
The analysis on the GC-Q/TOF was carried out on an Agilent 7890B gas chromatograph using a HP-5MS (30 m x 0.25 mm, 025 µm) column coupled to an Agilent Q/TOF 7200B running in electron ionization (EI) mode. A 78 min runtime with a linear temperature gradient from 35°C to 325°C was chosen to separate all 76 target chemicals and all major peaks in the analysis of a dust extract.
The analytical method for the LC-Q/TOF was taken from Moschet et al (2017)50 for water extracts. In brief, a C18 column (2.5x100 mm, 1.8 µm, Zorbax Eclipse Plus, Agilent Technologies, Inc.) was used for separation with the following mobile phases: positive ionization mode: A) ultrapure water plus 0.1% formic acid, B) acetonitrile plus 0.1% formic acid; negative ionization mode: A) ultrapure water plus 1 mM ammonium fluoride, B) acetonitrile. Ammonium fluoride in ultrapure water was chosen in negative mode because it had >10x higher sensitivity for phenolic compounds such as bisphenol A compared to other buffers tested. The injection volume was 10 µL. An Agilent 6530 Q/TOF (Agilent Technologies, Inc.) was used in positive and negative ionization mode. Acquisition was done in All-Ions fragmentation mode using collision energies (CE) 0, 10, 20, and 40 eV (scan rate: 4 spectra/sec) for the target and suspect screening (see below). The 0 eV channel was used to collect precursor ion information while the higher CE channels were used to obtain fragment ion information simultaneously.
Method Validation
The optimized extraction and analytical method was validated by extracting a triplicate of the NIST SRM 2585 dust (standard reference material). A spike recovery experiment was done by adding a mixture (500 ng) of all 132 target compounds to the NIST SRM 2585 dust, letting the solvent dry overnight, and extracting following the procedure described above. Absolute recovery was calculated by dividing the area of the pre-spiked sample by the area of a post-spiked sample, i.e., a NIST dust extract spiked immediately before instrumental analysis. This experiment was also conducted in triplicate. Finally, a triplicate of a method blank was extracted using an inert silica material (MIN-U-SIL®, U.S. Silica Holdings Inc., Frederick, USA) as a dust surrogate. The same method validation approach was used on both analytical platforms.
Targeted Quantification Method
Quantification of the target chemicals on both LC-Q/TOF and GC-Q/TOF employed Agilent MassHunter Quantitative Analysis (B.07). In LC-Q/TOF, the [M+H]+ or [M-H]- were used as quantifiers and - depending on the compound - the one or two most abundant fragments from the library spectra were used as qualifiers in the All-Ion scans (exact mass window ± 20ppm). In GC-Q/TOF, the most abundant fragment was used as quantifier and two further fragments used as qualifiers (exact mass window: ± 25ppm).
Non-Target Screening by GC-Q/TOF
The 38 samples including method blanks were re-run in one randomized sequence using the same acquisition method as described above. Before and after the sequence, an alkane mix was run to calculate the retention time index (RI) of all non-target features.
In a first step, non-target features were extracted by spectral deconvolution using Agilent Unknowns Analysis software. The software calculates a score based on the quality of the deconvolution (component shape quality). The software runs in batch mode, but corresponding features between samples are not grouped together (no binning and alignment). In a second step, the software compares spectra for each feature using a spectral library and calculates a match score. In this study, the NIST 14 library51 was used (unit mass resolution). All compounds with a component shape quality >60, a NIST library match factor >60 and a chromatographic peak width between 3 and 15 seconds were selected (parameters calculated by the MassHunter Unknown Analysis software).
In a next step, features that were the same between the samples were grouped together manually because the software did not support this step in an automated way. This was done by comparing the candidate names as well as "mass - retention time combinations'. In general, mass deviations of ±50 ppm and RT deviations of ±0.2 min were found to be acceptable limits based on the results of the target compounds that were identified in the non-target workflow. Unfortunately, the library match name of the same compound in two samples can be different if two compounds in the library have similar fragment spectra. Also, the reference mass (ion with highest intensity) can be different if two fragments have similar intensities.
Long-chain alkanes, their acids, esters and similar compounds were neglected from the further selection as they were considered as not relevant for this project. For the selected compounds, the calculated RI was compared with the NIST library value (experimental or estimated). A deviation of ±2% in RI was considered acceptable based on the experience with the target compounds that were also detected by the non-target approach. If the NIST library only contained an estimated RI, a deviation of ±10% in RI was acceptable. The second criterion was set arbitrarily because the confidence interval of the estimation by NIST varies significantly depending on the compound properties. All compounds with intensities lower than ten times the intensity in the method blank were discarded.
Suspect Screening by LC-Q/TOF
Suspect screening was conducted using the Agilent MassHunter Qualitative Analysis software (version B.07) by applying the "Find by Formula" workflow following the method described in Moschet et al. (2017)50. Two curated spectral libraries, Agilent Forensic Toxicology Personal Compound Database and Library (PCDL) and Agilent Water Contaminant LC/MS PCDL, containing 8,000 and 1,450 compounds with MS/MS spectra were used. Briefly, compounds for which a chromatographic peak was found for their main adduct (mass accuracy: ±10 ppm) and for which the isotope pattern gave a good match (score
> 70/100)50 were selected. Next, the exact masses from the five main fragments in the PCDL's MS/MS library spectra (CE 10, 20, 40) were searched in the high energy scans by the software. If one or more fragments were present and co-eluting with the parent (determined based on a coelution score in the software), the compound was automatically flagged as "qualified". Compounds "qualified" in at least five out of the 38 samples and for which the intensity was higher than ten times the intensity in the method blank were manually inspected. If possible, a reference standard was purchased for these tentatively identified compounds (confidence level 252) for unambiguous confirmation.
Non-Target Screening by LC-Q/TOF
- Recursive Feature Extraction
All samples including the method blanks and the NIST reference dust were re-run in triplicate in positive and negative modes in randomized order. For five samples, three individual extraction replicates were run in addition. This resulted in 149 injections in both positive and negative modes. The acquisition followed procedures described above, but only the full scan (CE=0 eV) was acquired with a scan rate of
1.5 spectra/sec. Agilent Profinder software (version B.08.00) was used to extract non-target compounds by the "Batch Recursive Feature Extraction' workflow. In brief, the software searches and identifies molecular features in the first sample. A feature is a group of corresponding ions, i.e., adducts and isotopes of the same compound, that form a chromatographic peak at a certain RT. All detected features are stored in a list with their exact monoisotopic mass and RT. Next, the software searches all features in the subsequent samples. The detected features in all samples are compared, the exact masses and RT are aligned and the corresponding features are binned together. This results in a list of features and their presence in corresponding samples. In a second step, the average exact masses and RT of the consensus feature list are scanned in each sample to check if any feature has been missed in the first round.
- Selection of relevant features
The feature list was imported into Mass Profiler Professional (MPP, Version 14.0, Agilent Technologies, Inc.) which is a statistical analysis software package designed to evaluate high-resolution mass spectrometry data. To improve robustness, features were discarded if they were not found in at least two out of three replicates or if the highest intensity in the samples was less than ten times the intensity of the blank sample. In order to focus on compounds ubiquitously present in dust, all features present in at least 37 of the 38 samples were selected for further identification.
- Compound identification using in-silico fragmentation
The samples with the highest intensities of the selected features were re-run in targeted MS/MS mode (CE=20) by triggering the [M-H] - or [M+H] + mass of the selected feature at the measured RT. Using the MS/MS information, the features were tentatively identified (if possible) using two in-silico fragmentation software packages: Agilent Molecular Structure Correlator (MSC) and the program MetFrag 53 (online version https://msbi.ipb-halle.de/MetFragBeta/ and MetFragR http://c- ruttkies.github.io/MetFrag/projects/metfragr). Both software tools have the same principle, but a different algorithm and different filtering and weighting options. Briefly, input parameters for both programs are the exact mass of the [M-H] - or [M+H] + ion and the list of the acquired MS/MS fragment masses and relative intensities. The software searches all compounds with the corresponding exact mass (± the chosen mass error, in this case ±10 ppm) in a database. In this study, MSC searched the ChemSpider database (www.chemspider.com), and MetFrag was set to search PubChem (https://pubchem.ncbi.nlm.nih.gov). In a next step, the fragmentation pattern of every candidate is simulated based on a given fragmentation algorithm and a match score between the acquired and predicted MS/MS spectra is calculated. If no other criteria are selected, the candidates are ranked based on this fragmenter score. In MSC, candidates can be ranked by the number of data sources in ChemSpider. MetFrag has more options in this respect. The number of references and patents from PubChem can be integrated in a weighted score and the user can define the importance of each score by a weighting factor. In addition, a suspect list (csv. file containing InChIKeys) can be added. In this case, a candidate that is listed on the suspect list is ranked higher compared to a candidate that is not listed. These weighting options help in selecting the correct compound if there are multiple candidates with similar fragmenter scores due to similar structures. In this study, the weighting factor for the fragmenter score was 1.0, for the number of references 0.125, for the number of patents 0.125, and for the suspect list 0.25. The suspect list in this study was a merged list of all suspect exchange lists from the NORMAN network (http://www.norman- network.com/?q=node/236 54), an unpublished temporary list from DSSTox (desalted compounds, received from Mark Strynar, EPA) and the CPCP database 49 (>18,000 compounds). The online version of MetFrag cannot be used in a batch mode. Therefore, MetFragR was used and a batch version was programmed to run batches of 20 compounds.
The candidate list for each feature was manually checked and the most plausible structure was selected. In cases where it was determined to be necessary or advantageous, additional lines of evidence were considered, e.g. plausibility check of the retention time based on the predicted logK ow value or the MS/MS match score from the fragmentation prediction software CFM-ID (http://cfmid.wishartlab.com) 55.
Chemical use categorization
Chemicals identified in the current study were classified into the most appropriate and primary use categories to understand distribution and concentration by different use categories. For most compounds, we relied on databases such as CPCPdb and the U.S. National Library of Medicine's Household Product Database ( https://householdproducts.nlm.nih.gov/index.htm) to find the most common and primary use of the compounds. For compounds with multiple uses, we also relied on web searches to categorize them.
Statistical analysis
Statistical analyses were performed using Microsoft Excel 2017. For concentrations between the limit of quantification (LOQ) and the limit of detection (LOD), we assigned a value of LOQ divided by 2. For concentrations below LOD, we assigned a value of LOD divided by the square root of 2 56. The variability of chemical concentrations in residential dust across homes provides important insight into sources of particular compounds. Chemicals with low variability are likely to be found in a wide range of products and/or in widely used products, while those with high variability are likely to have more specific sources or to be associated with more episodic activities (e.g., house-level pest control activities). We examined the variability of concentrations for all compounds that were confirmed with a reference standard and detected in more than 50% of samples.
Source Strength
We then use a fugacity-based indoor mass balance model to estimate the whole-house emissions rates of SVOCs that would account for the measured dust concentrations. The method follows Shin et al. (2013)57.
Results and Discussion:
Method Validation Procedure for Targeted Analytes
Method validation showed good absolute recoveries (extraction recovery of a triplicate spike sample) above 75% for more than 80% of the 76 GC-Q/TOF target compounds and above 50% for more than 80% of the 56 LC-Q/TOF compounds. The extraction was somewhat biased towards non-polar compounds by the selected solvents (hexane:acetone 3:1 and 100% acetone). However, more polar solvents such as methanol would not have meshed well with a single sequential extraction because of its immiscibility with hexane and its elevated boiling point. Nevertheless, method detection limits (MDL) were generally lower for LC-Q/TOF compounds. In total, 50% of all compounds had MDLs below 10 ng/g dust and 80% had MDLs below 100 ng/g dust. These MDLs are comparable with MDLs from previous literature studies58-61. Compounds with higher MDLs either had extremely high concentrations in the dust (phthalates, organophosphate flame retardants, skin oils) and background contamination in the method blank or they had limited sensitivity in GC EI-MS mode (pyrethroids, phenols). Precision (standard deviation of replicates) was <20% for 95% of all compounds. In addition, the accuracy of the concentrations could be checked for 14 compounds for which certified concentrations in the SRM 2585 dust were available (i.e., deviation of the measured value from the certified value). For 12 out of 14 compounds, accuracy was < 25%. The only exceptions were phenanthrene and pyrene, for which concentrations were underestimated by 33% and 26%, respectively. In LC-Q/TOF, ion suppression due to matrix load was low for most compounds measured in negative ionization mode (90% < factor of two), but higher for compounds measured in positive ionization mode (60% > factor of two). Therefore, the use of appropriate internal standards was absolutely necessary to accurately quantify the compound concentrations.
Overall, the quality control parameters of this simple and extremely broad extraction method followed by two untargeted analytical methods show that the compound classes previously described to be present in dust can be efficiently and accurately extracted and detected.
Results of GC-Q/TOF Non-Target Screening
The deconvolution of the GC-EI-MS chromatograms produced about 3000 to 5000 features per sample; roughly 300 of these compounds per sample had a NIST library hit (component shape quality > 60, library match factor > 60). An example compound, octyl methoxycinnamate (CASRN: 5466-77-3) - a UV- filter later confirmed with a reference standard - is shown in Figure 1.1A. The perfect deconvolution (component shape quality: 99) is indicated by the co-elution plot of the five main fragments. The good match with the hit in the NIST library (match factor: 87.5) is underlined by the differential plot. In addition, the experimentally derived RI in the NIST library perfectly matches with the measured RI in this study. The compound was detected in 36 out of 38 dust samples.
The manual grouping and prioritization (see method section) led to 75 compounds with detections in multiple samples. Twenty-six of them were discarded due to high presence in the blank or RI deviation above the selected criterion. Twenty-two of the remaining 48 compounds were target compounds (BDE, OP-FR, pyrethroids, phthalates) that were already confirmed; the remaining 27 were identified uniquely through this non-targeted workflow. For instance, 7,9-Di-tert-butyl-1-oxaspiro(4,5)deca-6,9-diene-2,8- dione (CASRN: 82304-66-3) - a leachable from plastics - has not been reported in dust before, but is of increasing interest because of detections in water (leached from pipes) and in airborne particles62. For 17 of the non-targets, a reference standard could be purchased and all identifications were confirmed by matching RT. For the remaining 10 compounds, no reference standard could be purchased; they remain tentatively identified with confidence level 252 based on matching EI spectra and RI values.
Results of LC-Q/TOF Suspect Screening
The screening of the LC-Q/TOF chromatograms acquired in the All-Ions fragmentation workflow with two PCDLs containing almost 10,000 chemicals with MS/MS spectral information led to 97 tentatively identified compounds after applying the automatic filter criteria and after manual inspection. The approach is discussed in detail for water samples in Moschet et al. (2017)50. Seventeen of them were already quantified in the target screening, six were target chemicals from the GC-Q/TOF and two were non-targets identified by GC-Q/TOF. For 52 suspects, a reference standard was purchased; 43 of them were unambiguously confirmed by matching RT; 9 were rejected due to non-matching RT. The remaining 28 compounds remain tentatively confirmed with confidence level 252.
One example of a positively identified compound is the fungicide imazalil (CASRN: 35554-44-0, molecular formula C14H14Cl2N2O), which is used to preserve citrus fruits and is likely to be carcinogenic to humans (Figure 1.1B). The mass error was +4.5 ppm and the isotope pattern explains the two Cl-atoms which resulted in an isotope match score of 97 out of 100. In addition, the five main fragments (see SI-6) co-elute with the [M+H]+. The compound was unambiguously confirmed by matching retention time of a reference standard. It was detected in 29 of the 38 dust samples.
These results show the efficiency of suspect screening using curated spectral libraries and automated software workflows, allowing identification of dozens of compounds without procuring thousands of standards or optimizing target methods. For example, 21 pharmaceuticals - e.g. diphenylhydramine (CASRN: 58-73-1), miconazole (CASRN: 22916-47-8), diclofenac (CASRN: 15307-86-5) - which have previously not been investigated in house dust, were detected by this approach.
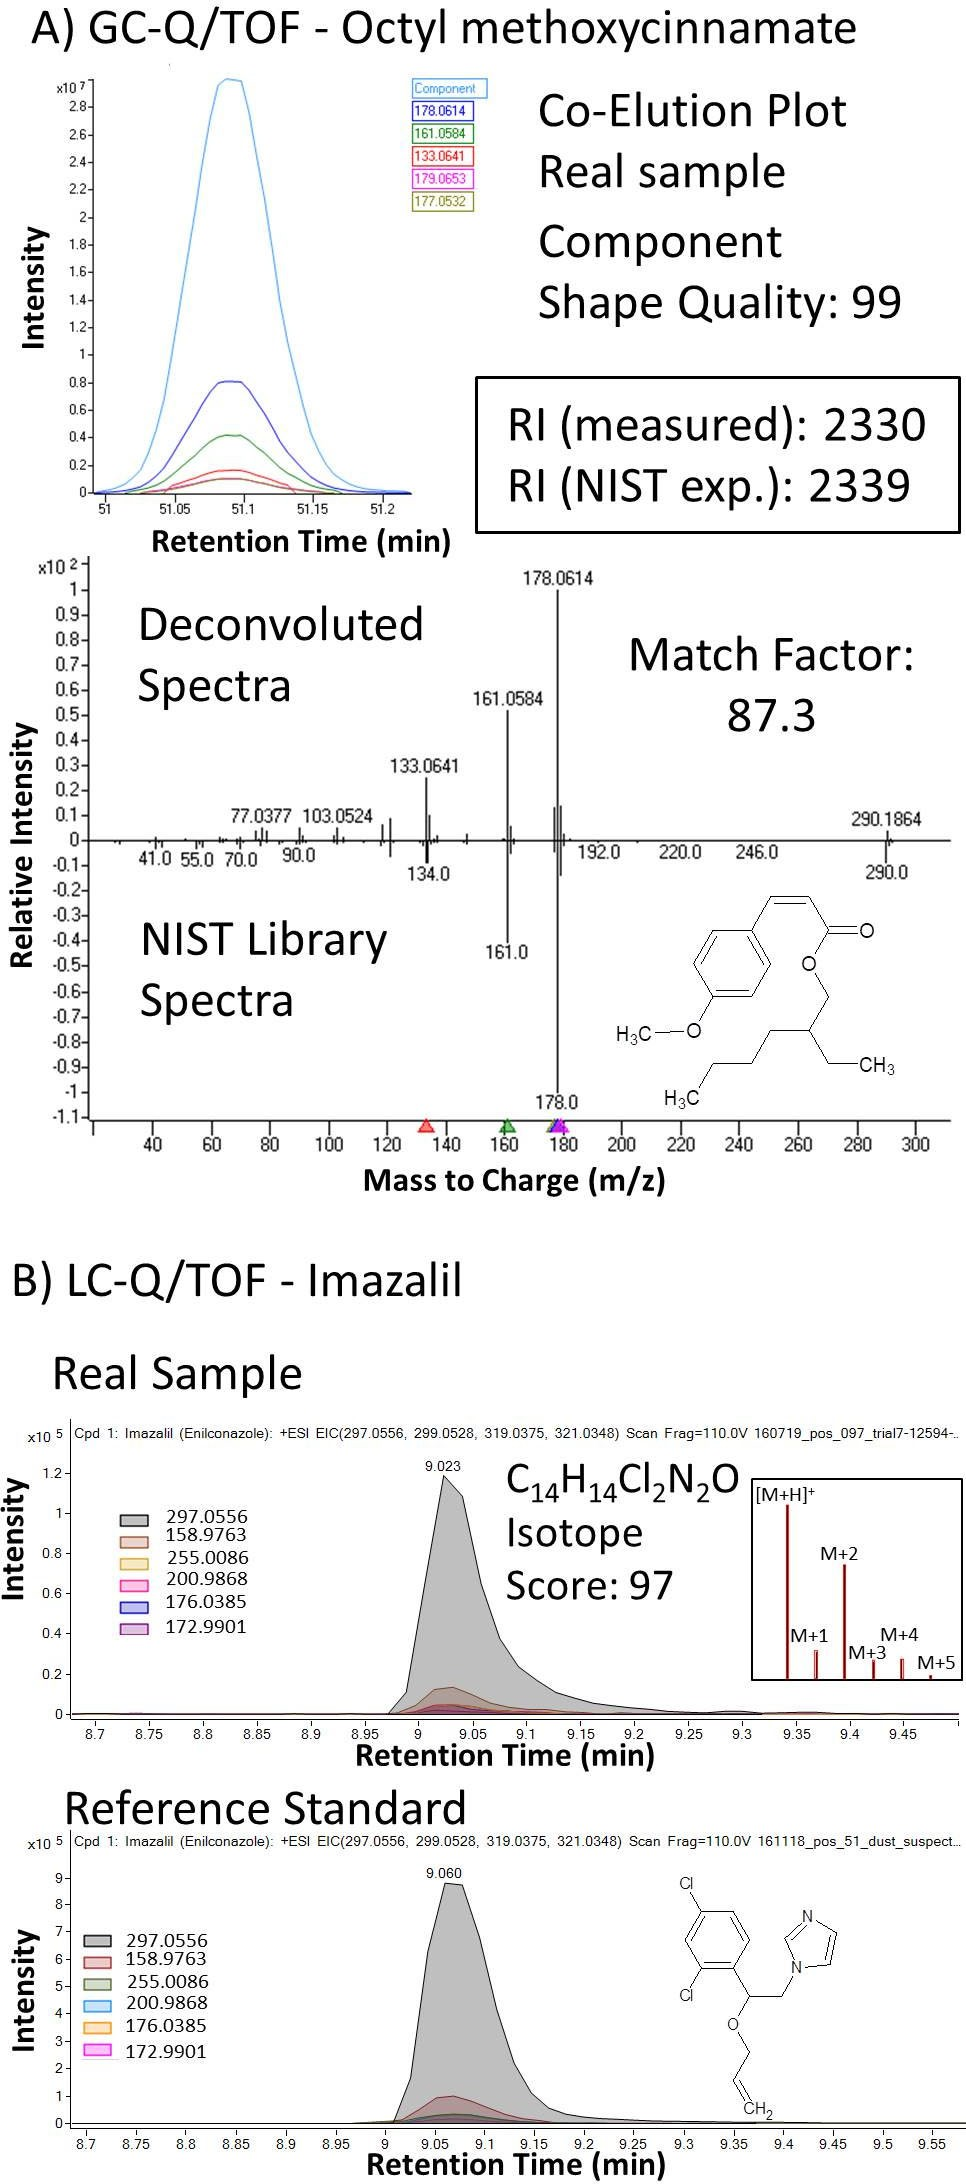
Figure 1.1. A) Example of the UV-filter octyl methoxycinnamate (CASRN: 5466-77-3) detected by GC- Q/TOF (non-target screening). Top: Co-elution plot of five main deconvoluted fragments in a real sample. Bottom: Differential plot between deconvoluted spectra and the NIST library spectra. The match factor was calculated by MassHunter Unknown Analysis software. The identity of the compound was later confirmed by a reference standard. RI: retention time index, exp.: experimental; B) Example of the fungicide imazalil (CASRN: 35554-44-0) detected by LC-Q/TOF (suspect screening). [M+H]+ and five main fragments from the All-Ions scans in a real sample (top) and in the reference standard (bottom). Inset: Isotope pattern match including the monoisotopic mass [M+H]+and five isotopes (M+1 to M+5). Black lines reflect the measured isotopes, red boxes reflect the theoretical isotope pattern.
Results of LC-Q/TOF Non-Target Screening
- Quality Control in Non-Target Screening using LC-Q/TOF
The recursive feature extraction of the 149 triplicate injections detected 13,340 individual features in negative mode and 14,588 features in positive mode, respectively. Features that were only found in one out of three replicates (roughly 30% of total features) and features present in the blank (roughly 10%) were discarded leading to a new total number of features of 7,701 in negative mode and 9,326 in positive mode. Identification of all these features is not feasible35so a statistical analysis, explained below, was used to focus on relevant compounds.
As classical quality control using validation parameters (e.g. recovery, accuracy) is not possible when doing non-targeted analysis, data quality assessment needs to be demonstrated differently; two proxies for this are described below. Only after the reproducibility and accuracy of the screening approach is verified should statistical analysis or compound identification be performed.
The first approach is to examine the reproducibility of features among replicate samples, e.g., using principal component analysis (PCA; see Figure 1.2 for negative ionization mode). The plot shows that the injection replicates cluster close together (triangles with the same color). The clustering is clearly visible, although components 1 and 2 only explain <10% of the variation, which is due to the fact that several thousand features are compared. This shows that i) RT and mass accuracies were stable over the four day run of the 149 injections and ii) that the recursive feature extraction algorithm grouped the features accurately and reproducibly. The RT shifts of the internal standards throughout the sequence were <0.2 min in negative mode and <0.4 min in positive mode.
The extraction replicates of the five selected samples (squares in Figure 1.2, indicated with a colored circle) also grouped within similar distances to the injection replicates of the same samples. This means that dust is homogenous enough to obtain similar results when extracting different sub-samples multiple times.
The second approach is to check for known chemicals in the untargeted feature list. Most of the targets and suspects that were detected in the dust samples were found as features in the unfiltered feature list (40 out of 48 compounds with >5 detections in negative mode, 21 of 30 compounds in positive mode). Reasons for missing a compound could be that it fell below the selected intensity threshold or due to occurrence in the blank. The automated criteria were set more stringently than when manually evaluating the data; thus, the manual evaluation leads to lower detection limits.30
However, the fact that most target compounds were found shows that relevant compounds were isolated using the recursive extraction algorithm and not just compounds with much higher intensities such as surfactants (see next section).
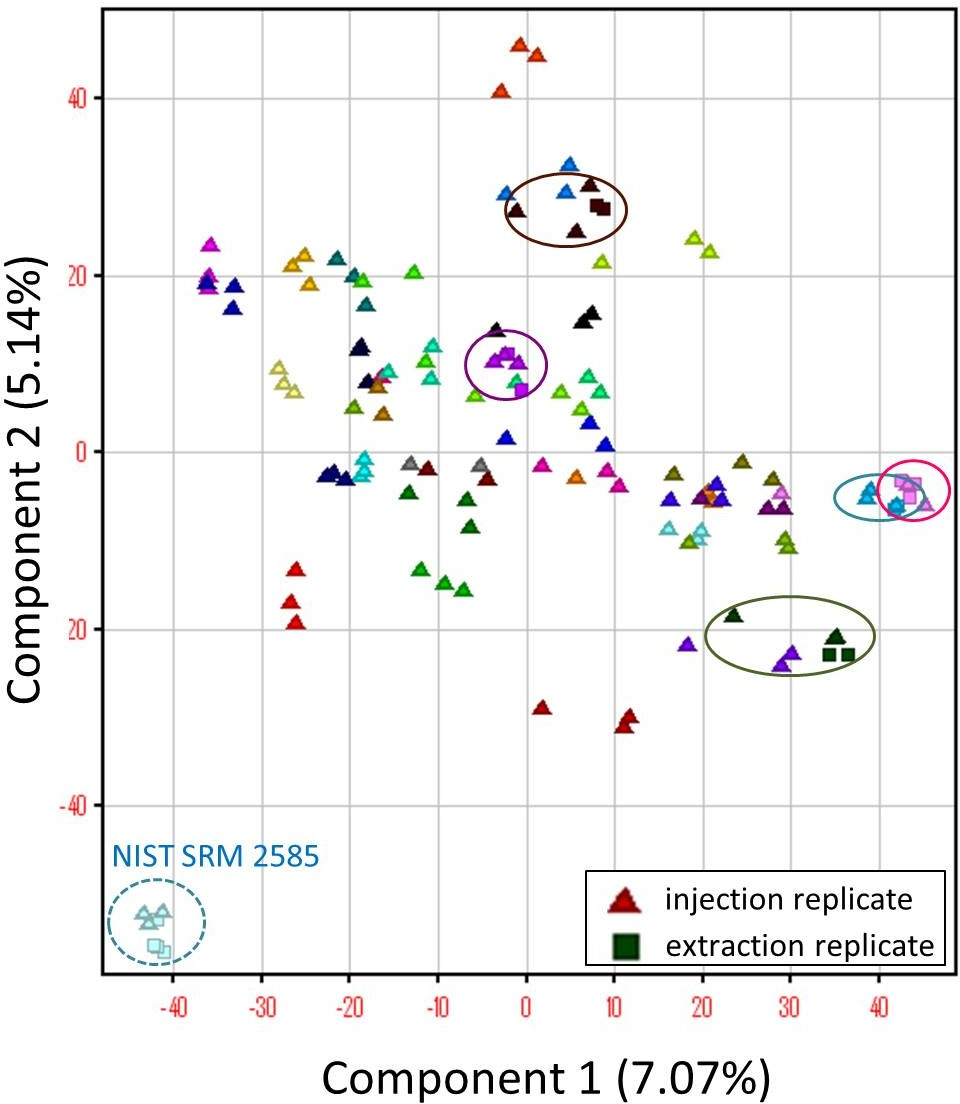
Figure 1.2. Principal component analysis (PCA) of the detected non-target features in 38 dust samples and the NIST SRM 2585 dust sample on the LC-Q/TOF in negative ionization mode. Different colors indicate different samples. Each sample was injected in triplicate (triangles). Total number of features: 7,701 (blank subtracted). Samples indicated with a colored circle had additional extraction replicates (squares). The indicated light blue sample is the NIST SRM 2585 reference dust sample.
Homologous Series Identification
The total ion chromatogram of the dust samples suggested that homologous series of compounds were present, so all features were searched for homologues using the software EnviHomolog (www.envihomolog.eawag.ch)63. Interestingly, 50% of the features in negative mode and 30% of the features in positive mode were identified as homologues by the software (SI-8). Most prominent in negative mode were homologues with a mass defect of 44.0262, i.e. (-CH2CH2O)n (~50% of the homologues). The most prominent homologues in positive mode were identified with a mass defect of 14.0156, i.e. (-CH2)n (~40% of the homologues). Cleaning agents usually contain surfactants with a homologous series of compounds. They have been detected in different environmental media (e.g.64), and it is expected that surfactants end up in the dust. Examples of surfactants with (-CH2CH2O)n chains are alcohol polyethoxylates (AEOs) and polyethyleneglycols (PEGs); examples of surfactants with (-CH2)n chains are linear alkylbenzenesulfonates (LASs) and sulfophenyl carboxylic acids (SPCs)31,65,66 One way to identify expected surfactants is to use the NORMAN exchange list54 that contains surfactants previously identified in waste water31 using a suspect screening approach. Although numerous other types of surfactants and also other compounds with homologous series such as polyfluorinated or polyhalogenated compounds might be present in dust67, the identification of these individual compounds is outside the scope of this study.
- Compound Identification using In-Silico Fragmentation Software
As it is impossible to identify several thousands of non-target features35, we have chosen to prioritize features that were ubiquitous in the dust samples. Therefore, features present in ≥ 37 out of 38 samples were selected and identified, if possible (see method section). These included 611 features in negative mode and 284 in positive mode. To further refine that selection, ubiquitous features with stable intensities amongst the samples (coefficient of variation CV<75%) and features with significant intensity fluctuations amongst the samples (CV>200%) were selected. This led to 129 features in negative mode and 99 features in positive mode. Good MS/MS spectra were acquired for 57 features in negative mode and 75 features in positive mode. The remaining features had insufficient intensity or no/poor fragments.
The features with good MS/MS spectra were examined using the two in-silico fragmentation software packages MSC and MetFrag. An example of a compound identified by using both packages is the ionic surfactant N-Lauroylsarcosine (mass 270.2068, RT 10.5 min), which is used in shampoos and shaving foam and which has not been detected in house dust before. MS/MS information first helped to confirm the molecular formula with both MSC and MetFrag producing top candidates with the formula C15H29NO3. The isotope pattern score of 99.7 in the MS full scan supported this. In MSC, the top candidate N-Lauroylsarcosine (CASRN: 15535-18-9) had a fragment match score of 87.5 (mass error -1.2 ppm) with 95% of the fragments being explained by its structure. In MetFragR, the compound had a fragmenter score of 70.7, only rank 33 among all candidates. However, the compound had the highest number of references and patents and was listed on the custom suspect list. Therefore, the compound had the highest rank with the weighted score. The estimated logKow (4.5, MetFrag output) is consistent with the measured RT of 10.5 min. N-Lauroylsarcosine reference standard was purchased, and its identity was confirmed with matching RT and MS/MS spectra.
This example illustrates how multiple pieces of evidence support correct identification. MetFrag was frequently favored over MSC due to its wider range of program capabilities. Nonetheless, both software packages are very useful in identifying chemicals through the non-targeted workflow.
Another tentative compound identification later confirmed with a reference standard was the emerging organofluorine compound 6:2/8:2 diPAP (Polyfluoroalkyl phosphoric acid diester, CASRN: 943913-15-3, see Figure 1.3). Although the isotope pattern of 6:2/8:2 diPAP is not distinctive because it does not contain Cl- or Br-atoms, the negative mass defect indicates the presence of multiple F-atoms. The eight top fragments of 6:2/8:2 diPAP could all be explained by its structure, with the compound receiving the highest fragmenter score by MetFrag. In this case, neither the suspect list nor the number of references/patents helped because none of the candidates had any entries. Two other emerging organofluorine compounds - 6:2 fluorotelomer sulfonic acid (6:2 FTSA, CASRN: 27619-97-2), 6:2diPAP (CASRN: 57677-95-9) - were detected by the non-target approach and later confirmed by a reference standard. Emerging organofluorine compounds, especially diPAPs, have recently been found in dust samples in high concentrations and detection frequencies68 and are an underestimated source of human exposure to polyfluorinated compounds.
Another example is the fungicide metabolite 4-hydroxychlorothalonil (CASRN: 28343-61-5), which has not been detected in house dust before. The isotope pattern indicated the presence of three Cl-atoms and the top five fragments could be explained by its structure. However, three structural isomers had the same fragmenter score by MetFrag. Of these, only 4-hydroxychlorothalonil was on the suspect list, accompanied with the highest number of references and patents.
With this approach, 75 compounds were tentatively identified with a proposed structure either in negative or positive ionization mode. Four of them were already identified by the target or suspect approach (bisphenol A, dexpanthenol, fipronil-sulfone, triclocarban). For 16 non-target candidates, a reference standard could be purchased. Twelve compounds were confirmed by matching RT and matching MS/MS spectra. In addition to the aforementioned compounds, these were: vanillin (CASRN: 121-33-5), genistein (CASRN: 446-72-0), palmidrol (CASRN: 544-31-0), linolenic acid (CASRN: 463-40-1), palmitic acid (CASRN: 57-10-3), leucine (CASRN: 61-90-5), and piperine (CASRN: 94-62-2). Four compounds were not confirmed (methyl-2-octynoate, cinnamic acid, diphenyl phosphate, dibutyl- phthalate). The remaining 55 compounds remain tentatively confirmed with confidence level 352. Sixteen additional compounds were identified only by a proposed molecular formula.
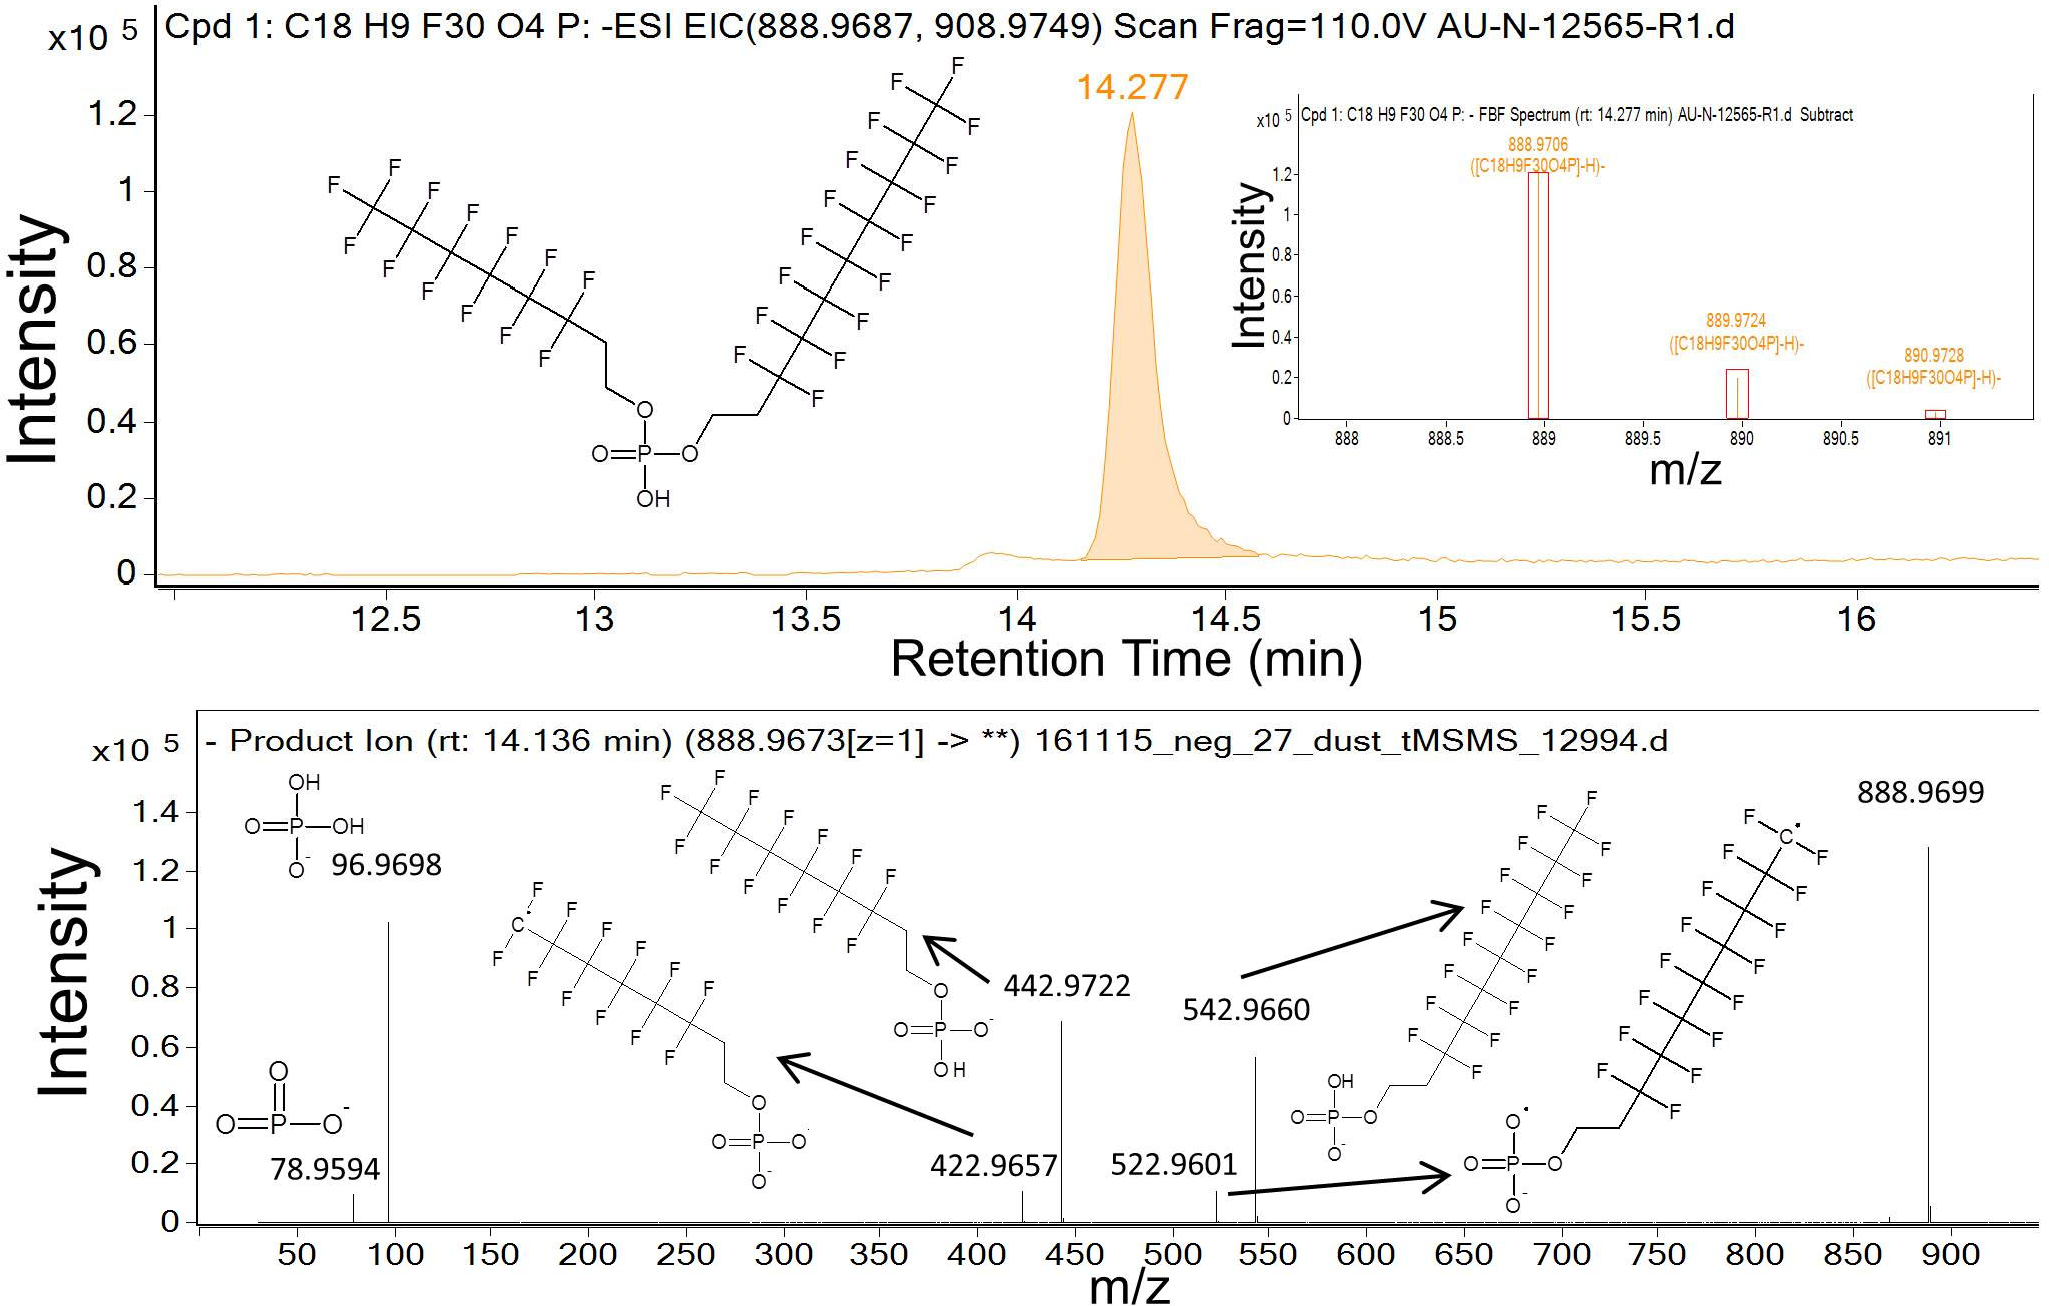
Figure 1.3. Chromatogram (top), isotope pattern (inset) and annotated MS/MS spectra (bottom) of 6:2/8:2 diPAP (CASRN: 943913-15-3) identified by the in-silico fragmentation software MetFrag by a complete non-target approach in LC-Q/TOF negative ionization mode. MetFrag fragmenter score: 177, number of explained peaks: 8, number of references/patents (PubChem): 0/0, suspect list: no, mass error of precursor mass: 1.3 ppm, mass error of fragment masses: 0.2 ppm (m/z 542.9659) to 4.7 ppm (m/z 78.9590). The estimated logKow (10.6, Jchem for Excel) is consistent with the measured RT of 14.1 min.. The feature was detected in ≥37 out of 38 samples and was later confirmed by a reference standard.
Comparison of LC-Q/TOF and GC-Q/TOF workflows for detecting unknown chemicals
The identification of compounds using GC and LC techniques provides complimentary yet unique capabilities while providing a complete chemical profile of dust samples. Both analyses provide several thousands of detected non-target features and it is important to prioritize the most relevant features35 either by statistical analysis or by previous knowledge about suspected occurrence of certain compounds.
The fact that LC-ESI-MS provides the molecular ion information while GC-EI-MS generally does not, necessitates distinct non-targeted screening workflows. Both platforms have advantages and drawbacks. The biggest advantage in GC-EI-MS is that the fragment spectra are very reproducible and that libraries containing over 200,000 compounds are available. In addition, relative RT are very reproducible, so that normalized RI can be calculated when using a standard column and a simple temperature gradient. Both help to tentatively identify known unknowns with high confidence when the compound is in the library, saving significant time, labor and cost by avoiding the need to procure, prepare and analyze every analytical standard. In this respect, a good deconvolution software package and/or a good separation is essential to obtain the correct spectrum. As a drawback, relatively few curated and reliable accurate mass library spectra are presently available. Another drawback is the low or missing molecular ion, which would otherwise allow use of the suspect screening approach used for LC-Q/TOF. Also, this makes it much more difficult to detect unknown unknowns, i.e., compounds that do not have an EI spectrum in the library.
LC-Q/TOF software processing tools are more advanced, making it easier to bin and align non-target features in multiple samples. For compound identification - or for compounds lacking MS/MS spectra - the approach of acquiring MS/MS spectra and running an in-silico fragmentation is promising, though still largely a manual effort. Interestingly, the hardware and software tools from classical GC-MS and LC- MS are increasingly being integrated into a single, simpler platform to maximize data processing and integrity. For example, a GC-HRMS operated with a soft ionization source (low energy EI, PCI, APCI)40,69 generates data that are comparable with LC-ESI-MS/MS data. On the other hand, the All-Ions fragmentation workflow uses elements from the GC-EI-MS where multiple fragments are co-eluted to form a specific spectrum. Further advances in joint non-target screening by LC-HRMS and GC-HRMS depend critically on the optimization of the different software tools.
The results of this study show that both instrument types - LC-Q/TOF and GC-Q/TOF - are indispensable for a complete identification of chemicals in a sample. In the 38 dust samples, we detected and identified 86 compounds by GC-Q/TOF (59 targets and 27 non-targets) as well as 204 compounds by LC- Q/TOF (42 targets, 79 suspects, 83 non-targets,)). The actual number of compounds present in the dust is much higher, though. For example, many hydrocarbons were detected on GC-Q/TOF, and numerous surfactants were detected by LC-Q/TOF. These chemicals were not further investigated.
The detected and identified compounds are shown in Figure 1.4. As expected, GC-amenable compounds are generally in the higher logDow range than LC-amenable compounds. However, there are quite a few exceptions: e.g. diPAPs, dioctadecylamine with high logDow detected by LC-Q/TOF, or triethyl citrate and coumarin with lower logDow detected by GC-Q/TOF. There is also an overlap of compounds that can be detected by both instrument types. Sixteen of the 86 compounds that were detected by GC-Q/TOF were also detected in a comparable number of samples by LC-Q/TOF (Target or Suspect screening approaches, see Figure 1.4). Vice versa, three compounds that were detected by LC-Q/TOF were also detected in a comparable number of samples by GC-Q/TOF. The chemicals detectable on both platforms were phthalates, organophosphate flame retardants, UV filters and fipronil and its metabolites, which is consistent with results from a collaborative trial in water samples.70
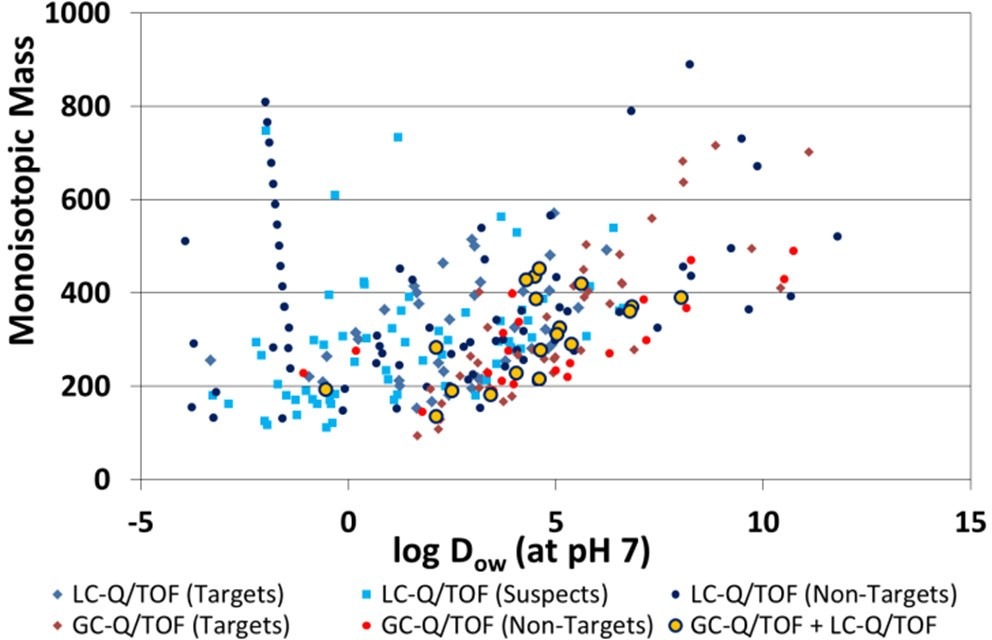
Figure 1.4. Physico-chemical properties of detected chemicals by LC-Q/TOF, GC-Q/TOF and compounds detected by both platforms with the different identification workflows (target, suspect, non-target). The logDow (at pH 7) was calculated by ChemAxon (JChem for Excel). The homologous series between mass 200-800 at logDow <0 are polyethylene glycol (PEG) surfactants that were detected by the LC-Q/TOF non- target approach.
Detected compounds in dust
By applying target, suspect screening, and non-target approaches to GCMS and LCMS, 271 compounds were detected in at least one of the 38 household dust samples. For 16 compounds, identification was not possible and only molecular formula (e.g., C4H7FO) could be assigned with high confidence 71. Among the 257 compounds that could be identified with structure and formula, 163 were unambiguously confirmed and quantified by reference standards, and 94 compounds were tentatively assigned by matching literature or library spectra. We confirmed that 30 target compounds were not detected in any samples. The majority (~70%) of these non-detected compounds were biocides, including fungicides, herbicides, and insecticides.
Using targeted analysis with GCMS and LCMS, we could definitively detect and quantify concentrations of chemical classes commonly found in indoor dust samples, including fragrances, parabens, insecticides, phthalates, OP-FRs, PBDEs, other FRs and plasticizers, PAHs, PFAS, phenols, and skin oils (see Table 1.1). BDE-29 has been widely detected in California house dust 72,73. However, we could not detect BDE-29 in our samples on our instruments, because it is a very large (molecular weight
= 959 g/mole) and completely non-polar (logP = 11.25) compound and is not volatile enough to get mobilized on the GC column we used. Thus, it could not be efficiently measured on our instruments. For plasticizers and skin oils (e.g., squalene) that are also ubiquitous in blanks, detections and concentrations reported in the current study were further confirmed by discarding all concentrations that were not at least 10 times higher than those in the blanks 71.
Tentatively identified compounds using the three screening approaches (GC non-target, LC non-target, LC suspect) were largely those used as cosmetic ingredients, natural compounds originating from plants, animals, or humans, food-related compounds, fungicides, pharmaceuticals, and surfactants. A large portion of previously unknown UV filters and compounds used in PCPs was also detected via suspect and non-target screening approaches.
Table 1 .1. Summary of detected compounds by different analytical instruments and approaches. Values in parentheses indicate the number of compounds confirmed by a reference standard.
| Chemical uses/sources | Chemical class | GC Target | LC Target | GC non-target | LC non-target | LC susect | Total |
|---|---|---|---|---|---|---|---|
| Cosmetic/ PCPs | Cosmetic Ingredients | 0 | 1 | 6(5) | 2(0) | 0(0) | 9(6) |
| Fragerances | 3 | 0 | 0(0) | 0(0) | 0(0) | .)3) | |
| Parabens | 0 | 4 | 0(0) | 0(0) | 0(0) | 4(4) | |
| UV Filters | 2 | 1 | 3(3) | 0(0) | 2(2) | 8(8) | |
| PCPs | 0 | 3 | 2(2) | 1(0) | 2(1) | 8(6) | |
| Flame Retardents | PBDEs | 7 | 0 | 0(0) | 0(0) | 0(0) | 7(7) |
| OP-FRs | 7 | 0 | 0(0) | 0(0) | 1(1) | 1(20) | |
| Other FRs | 3 | 0 | 0(0) | 0(0) | 2(2) | 5(5) | |
| Plasticizers | Phthalates | 8 | 0 | 0(0) | 0(0) | 0(0) | 8(8) |
| Other Plasticizers | 1 | 4 | 3(3) | 0(0) | 1(1) | 9(9) | |
| Biocides | Pesticides | 0 | 0 | 1(1) | 1(1) | 0(0) | 2(2) |
| Incecticides | 8 | 11 | 1(1) | 0(0) | 1(1) | 21(20) | |
| Fungelcides | 0 | 4 | 0(0) | 0(0) | 8(7) | 12(11) | |
| Herbacides | 0 | 5 | 0(0) | 0(0) | 0(0) | 5(5) | |
| Food Sources | Food additives | 0 | 0 | 3(3) | 1(1) | 4(4) | 8(6) |
| Food preservatives | 0 | 0 | 0(0) | 0(0) | 1(0) | 1(0) | |
| Sweeteners | 0 | 0 | 0(0) | 0(0) | 4(3) | 4(3) | |
| Natural Sources | Fatty acids | 0 | 0 | 0(0) | 4(2) | 1(0) | 5(2) |
| Human metabolites | 0 | 0 | 2(2) | 8(2) | 5(0) | 15(4) | |
| Natural compounds | 0 | 0 | 2(2) | 1(1) | 1(0) | 4(3) | |
| Skin oils | 1 | 1 | 0(0) | 0(0) | 0(0) | 2(2) | |
| Other or various uses/sources | PFAS | 0 | 10 | 0(0) | 4(3) | 1(1) | 15(14) |
| PAHs | 7 | 0 | 0(0) | 0(0) | 0(0) | 7(7) | |
| Phenols | 8 | 0 | 0(0) | 0(0) | 1(1) | 9(9) | |
| Pharmaceuticals | 0 | 0 | 0(0) | 2(1) | 27(11) | 29(12) | |
| Surfactants | 0 | 1 | 0(0) | 0(0) | 0(0) | 1(1) | |
| Various solid items | 0 | 1 | 0(0) | 0(0) | 0(0) | 1(1) | |
| Identified with structure, but use information is unknown | 0 | 0 | 1(1) | 14(0) | 1(0) | 16(1) | |
| Total | 55 | 46 | 24(22) | 67(12) | 65(33) | 257(168) |
Abbreviations: OP-FRs: organphosphate flame retardants, PCPs: personal care products
PAH's: polycyclic aromatic hudrocarbons, PBDEs: polybrominatted diphenyl ethers, PFAS:
polyfluorinated alkyl substances, UV filters: untraviolet filter
Newly-measured compounds in household dust
In the present study, 118 compounds were identified and quantified for the first time in household dust (Figure 1.5). Some of these compounds were previously measured in U.S. wastewater samples via target analysis, but had not been measured in indoor dust. The majority of these compounds was detected via LC non-target (46%) and LC suspect (29%) approaches (see inset of Figure 1.5). These newly-measured compounds mainly comprised surfactants (n = 24), pharmaceuticals (n = 19), compounds with unknown use information (n = 16), and human metabolites (n = 12). We also identified 10 biocides (4 insecticides, 6 fungicides) and 6 phenols (some are also used as biocides) in dust for the first time via GC target and/or LC target analyses.
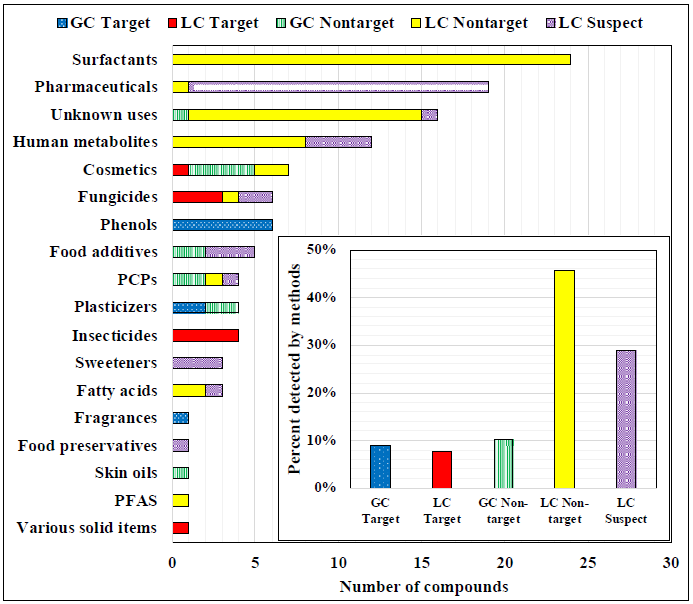
Figure 1.5 . Number of newly-measured compounds in household dust (n = 118) by use category and by different analytical instruments and approaches.
Measured dust concentrations
Eighty-eight compounds were detected in more than 50% of samples, 57 compounds in more than 90% of samples, and 33 compounds in all samples. To investigate which compound classes were in high concentration, we summarized measured median concentrations for the 88 compounds in more than 50% of samples by five levels (<500, 500-1,000, 1,000-5,000, 5,000-10,000, >10,000 ng/g of dust; Figure 1.6). A large number of UV filters, phthalates, and OP-FRs were detected in our dust samples and some of them were at concentrations above 10,000 ng/g of dust. Fungicides, PBDEs, insecticides, PCPs, PFAS, and pharmaceuticals were also abundant in our samples, but most measured at concentrations below 500 ng/g of dust. Median concentrations greater than 10,000 ng/g of dust were observed in four compounds that comprise or are found in skin surface lipids (cis-hexadec-6-enoic acid, squalene, cholesterol, vitamin E); two phthalates (bis(2-ethylhexyl) phthalate; DEHP), dioctyl terephthalate; DOTP); two cosmetic ingredients (linoleic acid, glycerol tricaprylate); one OP-FR (tris(1-chloro-isopropyl) phosphate; TCIPP); and one UV filter (oxybenzone). Solid consumer products (i.e., DEHP, DOTP, TCIPP) and PCPs (i.e., oxybenzone) are well-known sources of SVOCs. High concentrations of other compounds in the current study highlight the roles that humans and their activities, and possibly pets, play as sources of SVOCs in the indoor environment.
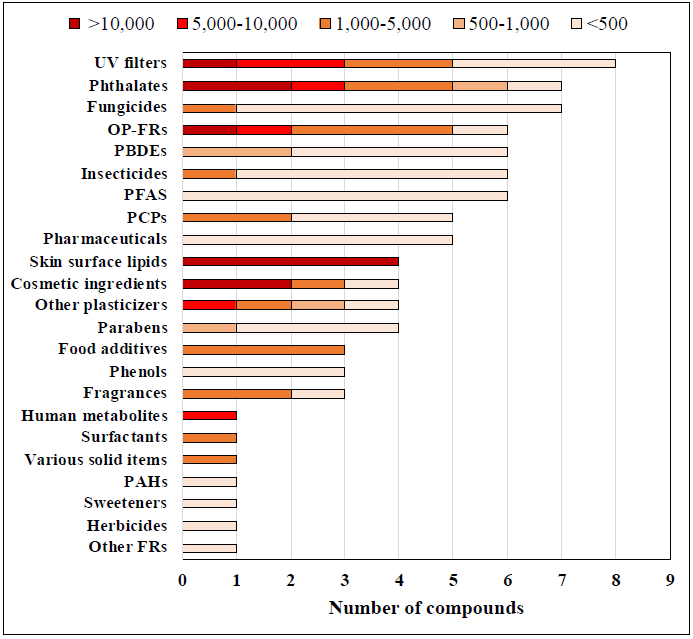
Figure 1.6 . Summary of median concentrations (ng/g of dust) for 88 compounds (target + suspect + non- target) detected in more than 50% of samples.
Variability and magnitude of individual compounds across samples
Figure 1.7 displaying distributions of targeted compounds only. This figure excludes two phenols (tetrachloro phenols, cresol) that were detected in most samples (above LOD) but that were below LOQ. Overall, dust concentrations varied by almost three orders of magnitude across household samples and by almost four orders of magnitude across compounds. PFAS were measured in the lowest concentrations and had relatively large variability in concentrations among target compounds. DEHP was shown to have the smallest variability (CV = 0.35) across the samples.
Unexpectedly, three compounds, including one used as a surfactant (alcohol ethoxylates), one used in various solid items including rubber footwear and automobile tires (1,3-diphenylguanidine), and one used as a disinfectant or a surfactant (dodecyl dimethyl ammonium chloride) were also measured in high concentrations, with medians greater than 2,500 ng/g of dust (empty boxes in Figure 1.7). Except for tri-n-butyl phosphate (TNBP), OP-FRs were measured in higher concentrations than PBDEs, and bisphenol S (BPS) was measured in higher concentrations than bisphenol A (BPA), consistent with recent changes in consumer use due to changes in product formulation and regulations affecting PBDEs and BPA.

Figure 1.7 . Distributions of dust concentrations (ng/g of dust) for 56 target compounds detected in more than 50% of samples. Two skin oils (cis-hexadec-6-enoic acid, squalene) were grouped into "cosmetics' with linoleic acid in this figure. Compounds with asterisk (*) indicate the first measurement in household dust (n =13).
Calculated Source Strengths
Based on the measured concentrations, the source strength of the compounds was calculated using a fugacity-based model, as shown in Figure 1.8.
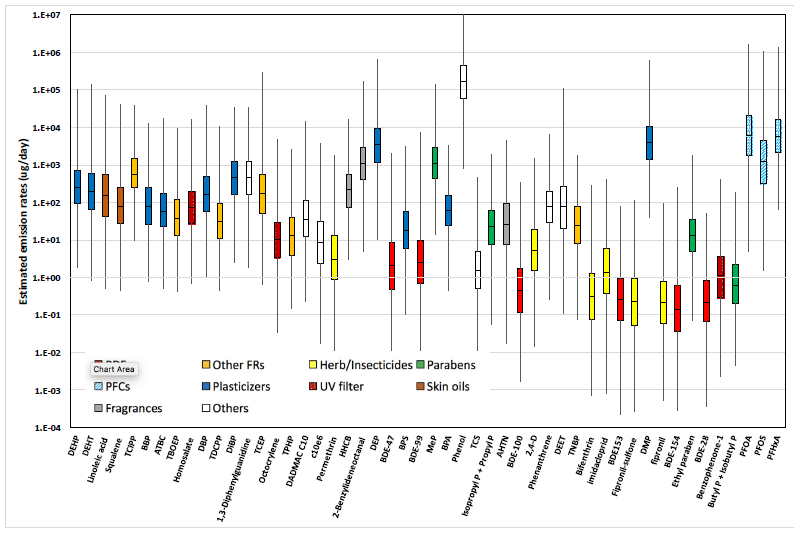
Figure 1.8 . Calculated source strengths of targeted compounds measured in house dust.
Implications
A major achievement of this study was the identification and quantification of a large number of SVOCs with high confidence (78% of compounds were fully confirmed with a reference standard or tentatively confirmed with a matching mass spectral library). We were able to expand the list of compounds present in indoor dust because both LCMS and GCMS with all available analytical approaches were applied at the same time. For example, 75% of newly-measured chemicals were observed via LC non- target or LC suspect approaches and the newly-measured compounds in our study mainly comprised surfactants, pharmaceuticals, and human metabolites.
Our study also supports the idea that dust can serve as a marker of use. The presence of food additives or preservatives in dust indicates that they exist outside their intended use, which is to be consumed via direct food intake. Skin oils and cholesterol were ubiquitously measured in Danish homes and daycare centers 74. In addition to these compounds, we observed cosmetic ingredients and vitamin E with median concentrations greater than 10,000 ng/g and some food additives (e.g., caffeine, sorbic acid). In a separate study in which we analyzed skin wipe samples 75, 11 compounds (triethyl citrate, butylated hydroxytoluene, cholesta-3,5-diene, vitamin E, cholesterol, tridecanoic acid, arachidonic acid, palmidrol, palmitic acid, pentadecanoic acid, linolenic acid) were detected, and they were also detected in our dust samples. This indicates that human activity, including cosmetics, skin sloughing, dropping food residue or debris unintentionally on floors, could be sources of these compounds.
The measured dust concentrations of 144 compounds in the current study can be used to improve our understanding of residential chemical exposure via non-dietary exposure routes 76. Some compounds detected in our study have exposure routes via direct oral intake (e.g., pharmaceuticals), direct dermal uptake (e.g., cosmetics, fragrances, pharmaceuticals, PCPs, UV filters) or direct food intake (e.g., food additives, preservatives). Except for these compound classes, non-dietary exposure routes for others that occur indoors include inhalation (gas-phase, airborne particles), air-to-skin dermal uptake (gas- phase), and non-dietary dust ingestion (settled dust). Chemical properties (volatility, octanol-air partition coefficient) determine the compound's distribution among gas-phase, airborne particles, and settled dust. Accurate determination of concentrations in each of these three indoor media are essential to characterize indoor residential exposure. In the absence of measurements in the gas-phase and for airborne particles, measured dust concentrations can be used to estimate concentrations by applying the partitioning relationships between settled dust and the gas-phase and between the gas-phase and airborne particles 11,12. Subsequently, total exposures via inhalation, transdermal uptake, and dust ingestion can be estimated by applying standard human exposure factors (inhalation rate, exposed skin surface area, etc.) to the measured dust concentrations and the estimated gas- and particle-phase concentrations 13. In addition, estimated total exposures from measured dust concentrations can be used in high-throughput screening and prioritization of indoor chemicals by exploring their association with toxicity potential.
Our findings have important implications. Because some compounds are used variously in indoor environments and do not fall into a single use category, it is difficult to characterize their sources and source strengths. However, measured dust concentrations can be used to determine overall source strength of SVOCs aggregated from all sources, because dust is known to be a reservoir of chemicals used indoors 57. In addition, our results can be representative of those in the general population and thus can be used to compare with those reported in other studies to examine overall time trends in dust concentrations or spatial variability 77.
Objective 2: Refine and evaluate a multi-compartment indoor fate, transport, and exposure mo
References:
- Mitchell, C. S., Zhang, J. F. J., Sigsgaard, T., Jantunen, M., Lioy, P. J., Samson, R. & Karol, M. H. Current state of the science: Health effects and indoor environmental quality. Environmental Health Perspectives 15, 958‐964, doi:0.1289/ehp.8987 (2007).
- Klepeis , N. E., Nelson, W. C., Ott, W. R., Robinson, J. P., Tsang, A. M., Switzer, P., Behar, J. V., Hern, S. C. & Engelmann, W. H. The National Human Activity Pattern Survey (NHAPS): a resource for assessing exposure to environmental pollutants. Journal of Exposure Analysis and Environmental Epidemiology 11, 31‐252, doi:10.1038/sj.jea.7500165 (001).
- Adgate , J. L., Church, T. R., Ryan, A. D., Ramachandran, G., Fredrickson, A. L., Stock, T. H., Morandi, M. T. & Sexton, K. Outdoor, indoor, and personal exposure to VOCs in children. Environmental Health Perspectives 112, 186‐1392, doi:10.1289/ehp.7107 (2004).
- Esplugues , A., Ballester, F., Estarlich, M., Llop, S., Fuentes‐Leonarte, V., Mantilla, E. & Iniguez, C. Indoor and outdoor air concentrations of BTEX and determinants in a cohort of one‐year old children in Valencia, Spain. Science of the Total Environment 09, 63‐69, doi:10.1016/j.scitotenv.2010.09.039 (2010).
- Shin, H. M., McKone, T. E. & Bennett, D. H. Intake Fraction for the Indoor Environment: A Tool for Prioritizing Indoor Chemical Sources. Environmental Science & Technology 46, 10063‐10072, doi:10.1021/es3018286 (2012).
- Zhang, X., Arnot, J. A. & Wania, F. Model for screening‐level assessment of near‐field human exposure to neutral organic chemicals released indoors. Environmental Science & Technology 48, 12312‐12319, doi:10.1021/es502718k (2014).
- Wenger, Y., Li, D. & Jolliet, O. Indoor intake fraction considering surface sorption of air organic compounds for life cycle assessment. International Journal of Life Cycle Assessment 1, 919‐931, doi:10.100/s11367‐012‐0420‐0 (2012).
- Little, J. C., Weschler, C. J., Nazaroff, W. W., Liu, Z. & Hubal, E. A. C. Rapid methods to estimate potential exposure to semivolatile organic compounds in the indoor environment. Environmental Science & Technology 46, 11171‐1117, doi:10.1021/es301088a (2012).
- Isaacs, K. K., Glen, W. G., Egeghy, P., Goldsmith, M. R., Smith, L., Vallero, D., Brooks, R., Grulke,
C. M. & Ozkaynak, H. SHEDS‐HT: An Integrated Probabilistic Exposure Model for Prioritizing Exposures to Chemicals with Near‐Field and Dietary Sources. Environmental Science & Technology 48, 12750‐12759, doi:10.1021/es502513w (2014).
- Weschler, C. J. & Nazaroff, W. W. Semivolatile organic compounds in indoor environments.
Atmospheric Environment 42 , 9018‐9040, doi:10.1016/j.atmosenv.2008.09.052 (2008).
- Weschler, C. J. & Nazaroff, W. W. SVOC partitioning between the gas phase and settled dust indoors. Atmospheric Environment 44, 3609‐3620, doi:10.1016/j.atmosenv.2010.06.029 (2010).
- Weschler, C. J., Salthammer, T. & Fromme, H. Partitioning of phthalates among the gas phase, airborne particles and settled dust in indoor environments. Atmospheric Environment 42, 1449‐ 1460, doi:10.1016/j.atmosenv.2007.11.014 (2008).
- Dodson, R. E., Camann, D. E., Morello‐Frosch, R., Brody, J. G. & Rudel, R. A. Semivolatile Organic Compounds in Homes: Strategies for Efficient and Systematic Exposure Measurement Based on Empirical and Theoretical Factors. Environmental Science & Technology 49, 1‐122, doi:10.1021/es502988r (2015).
- Meeker, J. D., Cooper, E. M., Stapleton, H. M. & Hauser, R. Urinary Metabolites of Organophosphate Flame Retardants: Temporal Variability and Correlations with House Dust Concentrations. Environmental Health Perspectives 121, 580‐585, doi:10.1289/ehp.1205907 (2013).
- Coakley, J. D., Harrad, S. J., Goosey, E., Ali, N., Dirtu, A. C., Van den Eede, N., Covaci, A., Douwes,
J. & t Mannetje, A. Concentrations of polybrominated diphenyl ethers in matched samples of indoor dust and breast milk in New Zealand. Environment International 59, 255‐261, doi:10.1016/j.envint.2013.06.020 (2013).
- Shin, M. Y., Lee, S., Kim, H. J., Lee, J. J., Choi, G., Choi, S., Kim, S., Kim, S. Y., Park, J., Moon, H. B., Choi, K. & Kim, S. Polybrominated Diphenyl Ethers in Maternal Serum, Breast Milk, Umbilical Cord Serum, and House Dust in a South Korean Birth Panel of Mother‐Neonate Pairs. International Journal of Environmental Research and Public Health 13, doi:10.3390/ijerph13080767 (20).
- Hammel, S. C., Hoffman, K., Lorenzo, A. M., Chen, A., Phillips, A. L., Butt, C. M., Sosa, J. A., Webster, T. F. & Stapleton, H. M. Associations between flame retardant applications in furniture foam, house dust levels, and residents' serum levels. Environment International 107, 181‐189, doi:10.1016/j.envint.20.07.015 (20).
- Hoffman, K., Garantziotis, S., Birnbaum, L. S. & Stapleton, H. M. Monitoring Indoor Exposure to Organophosphate Flame Retardants: Hand Wipes and House Dust. Environmental Health Perspectives 123, 160‐165, doi:10.1289/ehp.1408669 (2015).
- Watkins, D. J., McClean, M. D., Fraser, A. J., Weinberg, J., Stapleton, H. M. & Webster, T. F. Associations between PBDEs in office air, dust, and surface wipes. Environment International 59, 124‐132, doi:10.1016/j.envint.2013.06.001 (2013).
- Bamai , Y. A., Araki, A., Kawai, T., Tsuboi, T., Saito, I., Yoshioka, E., Cong, S. & Kishi, R. Exposure to phthalates in house dust and associated allergies in children aged 6‐12 years. Environment International 96, 16‐23, doi:10.1016/j.envint.16.08.025 (16).
- Johnson, P. I., Stapleton, H. M., Mukherjee, B., Hauser, R. & Meeker, J. D. Associations between brominated flame retardants in house dust and hormone levels in men. Science of the Total Environment 445, 177‐184, doi:10.1016/j.scitotenv.2012.12.017 (2013).
- Meeker, J. D., Johnson, P. I., Camann, D. & Hauser, R. Polybrominated diphenyl ether (PBDE) concentrations in house dust are related to hormone levels in men. Science of the Total Environment 407, 3425‐3429, doi:10.1016/j.scitotenv.2009.01.030 (2009).
- Philippat , C., Bennett, D. H., Krakowiak, P., Rose, M., Hwang, H. M. & Hertz‐Picciotto, I. Phthalate concentrations in house dust in relation to autism spectrum disorder and developmental delay in the CHildhood Autism Risks from Genetics and the Environment (CHARGE) study. Environmental Health 14, doi:10.1186/s12940‐015‐0024‐9 (2015).
- Ao , J. J., Yuan, T., Ma, Y. N., Gao, L., Ni, N. & Li, D. Identification, characteristics and human exposure assessments of triclosan, bisphenol‐A, and four commonly used organic UV filters in indoor dust collected from Shanghai, China. Chemosphere 184, 575‐583, doi:10.1016/j.chemosphere.2017.06.033 (2017).
- Hwang, H. M., Park, E. K., Young, T. M. & Hammock, B. D. Occurrence of endocrine‐disrupting chemicals in indoor dust. Science of the Total Environment 404, 26‐35, doi:10.1016/j.scitotenv.2008.05.031 (2008).
- Lankova , D., Svarcova, A., Kalachova, K., Lacina, O., Pulkrabova, J. & Hajslova, J. Multi‐analyte method for the analysis of various organohalogen compounds in house dust. Analytica Chimica Acta 854, 61‐69, doi:10.1016/j.aca.2014.11.007 (2015).
- Dodson, R. E., Perovich, L. J., Covaci, A., Van den Eede, N., Ionas, A. C., Dirtu, A. C., Brody, J. G. & Rudel, R. A. After the PBDE Phase‐Out: A Broad Suite of Flame Retardants in Repeat House Dust Samples from California. Environmental Science & Technology 46, 13056‐13066, doi:10.1021/es303879n (2012).
- Rudel , R. A., Camann, D. E., Spengler, J. D., Korn, L. R. & Brody, J. G. Phthalates, Alkylphenols, Pesticides, Polybrominated Diphenyl Ethers, and Other Endocrine‐Disrupting Compounds in Indoor Air and Dust. Environmental Science & Technology 37, 4543‐4553, doi:10.1021/es0264596 (2003).
- Krauss, M., Singer, H. & Hollender, J. LC-high resolution MS in environmental analysis: from target screening to the identification of unknowns. Analytical and Bioanalytical Chemistry 397, 943‐951, doi:10.1007/s00216‐010‐3608‐9 (2010).
- Moschet , C., Piazzoli, A., Singer, H. & Hollender, J. Alleviating the reference standard dilemma using a systematic exact mass suspect screening approach with liquid chromatography‐high resolution mass spectrometry. Anal Chem 85, 10312‐10320, doi:10.1021/ac4021598 (2013).
- Schymanski , E. L., Singer, H. P., Longree, P., Loos, M., Ruff, M., Stravs, M. A., Ripolles Vidal, C. & Hollender, J. Strategies to characterize polar organic contamination in wastewater: exploring the capability of high resolution mass spectrometry. Environ Sci Technol 48, 1811‐1818, doi:10.1021/es4044374 (2014).
- Gago‐Ferrero, P., Schymanski, E. L., Bletsou, A. A., Aalizadeh, R., Hollender, J. & Thomaidis, N. S. Extended Suspect and Non‐Target Strategies to Characterize Emerging Polar Organic Contaminants in Raw Wastewater with LC‐HRMS/MS. Environ Sci Technol 49, 12333‐12341, doi:10.1021/acs.est.5b03454 (2015).
- Gomez, M. J., Gomez‐Ramos, M. M., Malato, O., Mezcua, M. & Fernandez‐Alba, A. R. Rapid automated screening, identification and quantification of organic micro‐contaminants and their main transformation products in wastewater and river waters using liquid chromatography‐ quadrupole‐time‐of‐flight mass spectrometry with an accurate‐mass database. J Chromatogr A 1217, 7038‐7054, doi:10.1016/j.chroma.2010.08.070 (2010).
- Wang, M. & Helbling, D. E. A non‐target approach to identify disinfection byproducts of structurally similar sulfonamide antibiotics. Water Res 102, 241‐251, doi:10.1016/j.watres.2016.06.042 (2016).
- Hollender, J., Schymanski, E. L., Singer, H. P. & Ferguson, P. L. Nontarget Screening with High Resolution Mass Spectrometry in the Environment: Ready to Go? Environmental Science & Technology 51, 11505‐11512, doi:10.1021/acs.est.7b02184 (2017).
- Rager, J. E., Strynar, M. J., Liang, S., McMahen, R. L., Richard, A. M., Grulke, C. M., Wambaugh, J. F., Isaacs, K. K., Judson, R., Williams, A. J. & Sobus, J. R. Linking high resolution mass spectrometry data with exposure and toxicity forecasts to advance high‐throughput environmental monitoring. Environment International 88, 269‐280, doi:10.1016/j.envint.2015.12.008 (2016).
- Ouyang, X., Weiss, J. M., de Boer, J., Lamoree, M. H. & Leonards, P. E. G. Non‐target analysis of household dust and laundry dryer lint using comprehensive two‐dimensional liquid chromatography coupled with time‐of‐flight mass spectrometry. Chemosphere 166, 431‐4, doi: http ://dx.doi.org/10.1016/j.chemosphere.2016.09.107(2017).
- Ionas , A. C., Ballesteros Gómez, A., Leonards, P. E. G. & Covaci, A. Identification strategies for flame retardants employing time‐of‐flight mass spectrometric detectors along with spectral and spectra‐less databases. Journal of Mass Spectrometry 50, 1031‐10, doi:10.1002/jms.3618 (2015).
- Peng, H., Saunders, D. M. V., Sun, J., Jones, P. D., Wong, C. K. C., Liu, H. & Giesy, J. P. Mutagenic Azo Dyes, Rather Than Flame Retardants, Are the Predominant Brominated Compounds in House Dust. Environmental Science & Technology 50, 12669‐12677, doi:10.1021/acs.est.6b054 (2016).
- Megson , D., Robson, M., Jobst, K. J., Helm, P. A. & Reiner, E. J. Determination of Halogenated Flame Retardants Using Gas Chromatography with Atmospheric Pressure Chemical Ionization (APCI) and a High‐Resolution Quadrupole Time‐of‐Flight Mass Spectrometer (HRqTOFMS). Analytical Chemistry 88, 116‐11411, doi:10.1021/acs.analchem.6b01550 (2016).
- Hilton, D. C., Jones, R. S. & Sjodin, A. A method for rapid, non‐targeted screening for environmental contaminants in household dust. J Chromatogr A 1217, 6851‐6856, doi:10.1016/j.chroma.2010.08.039 (2010).
- Roberts, J. W., Budd, W. T., Ruby, M. G., Bond, A. E., Lewis, R. G., Wiener, R. W. & Camann, D. E. Development and field testing of a high volume sampler for pesticides and toxics in dust. Journal of exposure analysis and environmental epidemiology 1, 143‐155 (1991).
- Ma, W.‐L., Subedi, B. & Kannan, K. The Occurrence of Bisphenol A, Phthalates, Parabens and Other Environmental Phenolic Compounds in House Dust: A Review. Current Organic Chemistry 18, 2182‐2199 (2014).
- Mercier, F., Glorennec, P., Thomas, O. & Le Bot, B. Organic contamination of settled house dust, a review for exposure assessment purposes. Environ Sci Technol 45, 6716‐6727, doi:10.1021/es200925h (2011).
- Stapleton, H. M., Klosterhaus, S., Eagle, S., Fuh, J., Meeker, J. D., Blum, A. & Webster, T. F. Detection of Organophosphate Flame Retardants in Furniture Foam and U.S. House Dust. Environmental Science & Technology 43, 7490‐7495, doi:10.1021/es9014019 (2009).
- Papachlimitzou , A., Barber, J. L., Losada, S., Bersuder, P. & Law, R. J. A review of the analysis of novel brominated flame retardants. J Chromatogr A 1219, 15‐28, doi:10.1016/j.chroma.2011.11.029 (2012).
- Negreira , N., Rodríguez, I., Rubí, E. & Cela, R. Determination of selected UV filters in indoor dust by matrix solid‐phase dispersion and gas chromatography-tandem mass spectrometry. Journal of Chromatography A 1216, 5895‐5902, doi: http ://dx.doi.org/10.1016/j.chroma.2009.06.020 (2009).
- Weschler, C. J. Roles of the human occupant in indoor chemistry. Indoor Air 26, 6‐24, doi:10.1111/ina.12185 (2016).
- Goldsmith, M. R., Grulke, C. M., Brooks, R. D., Transue, T. R., Tan, Y. M., Frame, A., Egeghy, P. P., Edwards, R., Chang, D. T., Tornero‐Velez, R., Isaacs, K., Wang, A., Johnson, J., Holm, K., Reich, M., Mitchell, J., Vallero, D. A., Phillips, L., Phillips, M., Wambaugh, J. F., Judson, R. S., Buckley, T. J. & Dary, C. C. Development of a consumer product ingredient database for chemical exposure screening and prioritization. Food Chem Toxicol 65, 269‐279, doi:10.1016/j.fct.2013.12.029 (2014).
- Moschet , C., Lew, B. M., Hasenbein, S., Anumol, T. & Young, T. M. LC‐ and GC‐QTOF‐MS as Complementary Tools for a Comprehensive Micropollutant Analysis in Aquatic Systems. Environmental Science & Technology 51, 1553‐1561, doi:10.1021/acs.est.6b05352 (2017).
- NIST. NIST Standard Reference Database 1A, < http://www.nist.gov/srd/nist1a.cfm> (2016).
- Schymanski , E. L., Jeon, J., Gulde, R., Fenner, K., Ruff, M., Singer, H. P. & Hollender, J. Identifying small molecules via high resolution mass spectrometry: communicating confidence. Environ Sci Technol 48, 2097‐2098, doi:10.1021/es5002105 (2014).
- Ruttkies , C., Schymanski, E. L., Wolf, S., Hollender, J. & Neumann, S. MetFrag relaunched: incorporating strategies beyond in silico fragmentation. J Cheminform 8, 3, doi:10.1186/s13321‐ 016‐0115‐9 (2016).
- NORMAN Network. NORMAN Suspect List Exchange, < http://www.norman‐ network.com/?q=node/236> (2017).
- Allen, F., Greiner, R. & Wishart, D. Competitive fragmentation modeling of ESI‐MS/MS spectra for putative metabolite identification. Metabolomics 11, 98‐110, doi:10.1007/s11306‐014‐0676‐ 4 (2015).
- Hornung, R. W. & Reed, L. D. Estimation of Average Concentration in the Presence of Nondetectable Values. Applied Occupational and Environmental Hygiene 5, 46‐51, doi:10.1080/1047322X.1990.10389587 (1990).
- Shin, H. M., McKone, T. E., Nishioka, M. G., Fallin, M. D., Croen, L. A., Hertz‐Picciotto, I., Newschaffer, C. J. & Bennett, D. H. Determining source strength of semivolatile organic compounds using measured concentrations in indoor dust. Indoor Air 24, 260‐271, doi:10.1111/ina.12070 (2014).
- Mercier, F., Gilles, E., Saramito, G., Glorennec, P. & Le Bot, B. A multi‐residue method for the simultaneous analysis in indoor dust of several classes of semi‐volatile organic compounds by pressurized liquid extraction and gas chromatography/tandem mass spectrometry. Journal of Chromatography A 1336, 101‐111, doi: http ://dx.doi.org/10.1016/j.chroma.2014.02.004(2014).
- Canosa , P., Perez‐Palacios, D., Garrido‐Lopez, A., Tena, M. T., Rodriguez, I., Rubi, E. & Cela, R. Pressurized liquid extraction with in‐cell clean‐up followed by gas chromatography‐tandem mass spectrometry for the selective determination of parabens and triclosan in indoor dust. J Chromatogr A 1161, 105‐112, doi:10.1016/j.chroma.2007.05.089 (2007).
- Fraser, A. J., Webster, T. F., Watkins, D. J., Strynar, M. J., Kato, K., Calafat, A. M., Vieira, V. M. & McClean, M. D. Polyfluorinated compounds in dust from homes, offices, and vehicles as predictors of concentrations in office workers' serum. Environ Int , 128‐136, doi:10.1016/j.envint.2013.08.012 (2013).
- Liao, C., Liu, F., Guo, Y., Moon, H. B., Nakata, H., Wu, Q. & Kannan, K. Occurrence of eight bisphenol analogues in indoor dust from the United States and several Asian countries: implications for human exposure. Environ Sci Technol 46, 9138‐9145, doi:10.1021/es302004w (2012).
- Alam, M. S., West, C. E., Scarlett, A. G., Rowland, S. J. & Harrison, R. M. Application of 2D‐GCMS reveals many industrial chemicals in airborne particulate matter. Atmospheric Environment 65, 101‐111, doi: https ://doi.org/10.1016/j.atmosenv.2012.10.014 (2013).
- Loos, M. & Singer, H. Nontargeted homologue series extraction from hyphenated high resolution mass spectrometry data. Journal of Cheminformatics 9, 12, doi:10.1186/s13321‐017‐ 0197‐z (2017).
- Ferguson, P. L., Iden, C. R. & Brownawell, B. J. Analysis of nonylphenol and nonylphenol ethoxylates in environmental samples by mixed‐mode high‐performance liquid chromatography-electrospray mass spectrometry. Journal of Chromatography A 938, 79‐91, doi: https ://doi.org/10.1016/S0021 ‐9673(01)01091‐3 (2001).
- Lara‐Martín, P. A., González‐Mazo, E. & Brownawell, B. J. Multi‐residue method for the analysis of synthetic surfactants and their degradation metabolites in aquatic systems by liquid chromatography-time‐of‐flight‐mass spectrometry. Journal of Chromatography A 1218, 4799‐ 4807, doi: http ://dx.doi.org/10.1016/j.chroma.2011.02.031(2011).
- Corada ‐Fernandez, C., Lara‐Martin, P. A., Candela, L. & Gonzalez‐Mazo, E. Tracking sewage derived contamination in riverine settings by analysis of synthetic surfactants. Journal of Environmental Monitoring 13, 2010‐2017, doi:10.1039/C1EM10150A (2011).
- Myers, A. L., Jobst, K. J., Mabury, S. A. & Reiner, E. J. Using mass defect plots as a discovery tool to identify novel fluoropolymer thermal decomposition products. Journal of Mass Spectrometry 49, 291‐296, doi:10.1002/jms.3340 (2014).
- De Silva, A. O., Allard, C. N., Spencer, C., Webster, G. M. & Shoeib, M. Phosphorus‐Containing Fluorinated Organics: Polyfluoroalkyl Phosphoric Acid Diesters (diPAPs), Perfluorophosphonates (PFPAs), and Perfluorophosphinates (PFPIAs) in Residential Indoor Dust. Environmental Science & Technology 46, 12575‐12582, doi:10.1021/es303172p (2012).
- Portolés , T., Mol, J. G. J., Sancho, J. V. & Hernández, F. Use of electron ionization and atmospheric pressure chemical ionization in gas chromatography coupled to time‐of‐flight mass spectrometry for screening and identification of organic pollutants in waters. Journal of Chromatography A 1339, 145‐153, doi: http ://dx.doi.org/10.1016/j.chroma.2014.03.001(2014).
- Schymanski , E. L., Singer, H. P., Slobodnik, J., Ipolyi, I. M., Oswald, P., Krauss, M., Schulze, T., Haglund, P., Letzel, T., Grosse, S., Thomaidis, N. S., Bletsou, A., Zwiener, C., Ibanez, M., Portoles, T., de Boer, R., Reid, M. J., Onghena, M., Kunkel, U., Schulz, W., Guillon, A., Noyon, N., Leroy, G., Bados, P., Bogialli, S., Stipanicev, D., Rostkowski, P. & Hollender, J. Non‐target screening with high‐resolution mass spectrometry: critical review using a collaborative trial on water analysis. Anal Bioanal Chem 407, 6237‐6255, doi:10.1007/s00216‐015‐8681‐7 (2015).
- Moschet , C., Anumol, T., Lew, B. M., Bennett, D. H. & Young, T. M. Household dust as a repository of chemical accumulation: New insights from a comprehensive high‐resolution mass spectrometry study. Environmental Science & Technology In press (2018).
- Guo, W. H., Park, J. S., Wang, Y. Z., Gardner, S., Baek, C., Petreas, M. & Hooper, K. High polybrominated diphenyl ether levels in California house cats: House dust a primary source? Environ Toxicol Chem 31, 301‐306, doi:10.1002/etc.1700 (2012).
- Shen, B., Whitehead, T. P., McNeel, S., Brown, F. R., Dhaliwal, J., Das, R., Israel, L., Park, J. S. & Petreas, M. High Levels of Polybrominated Diphenyl Ethers in Vacuum Cleaner Dust from California Fire Stations. Environmental Science & Technology 49, 4988‐4994, doi:10.1021/es505463g (2015).
- Weschler, C. J., Langer, S., Fischer, A., Beko, G., Toftum, J. & Clausen, G. Squalene and Cholesterol in Dust from Danish Homes and Daycare Centers. Environmental Science & Technology 45, 3872‐3879, doi:10.1021/es103894r (2011).
- Alfonso‐Garrido, J., Bennett, D. H., Parthasarathy, S., Moschet, C., Young, T. M. & McKone, T. E. Exposure Assessment For Air‐To‐Skin Uptake of Semivolatile Organic Compounds (SVOCs) Indoors. Environmental Science & Technology, doi:10.1021/acs.est.8b05123 (2018).
- Shin, H. M., Ernstoff, A., Arnot, J. A., Wetmore, B. A., Csiszar, S. A., Fantke, P., Zhang, X. M., McKone, T. E., Jolliet, O. & Bennett, D. H. Risk‐Based High‐Throughput Chemical Screening and Prioritization using Exposure Models and in Vitro Bioactivity Assays. Environmental Science & Technology 49, 60‐6771, doi:10.1021/acs.est.5b00498 (2015).
- Mitro , S. D., Dodson, R. E., Singla, V., Adarnkiewicz, G., Elmi, A. F., Tilly, M. K. & Zota, A. R. Consumer Product Chemicals in Indoor Dust: A Quantitative Meta‐analysis of US Studies. Environmental Science & Technology 50, 10661‐10672, doi:10.1021/acs.est.6b02023 (2016).
- Allen, J. G., McClean, M. D., Stapleton, H. M. & Webster, T. F. Critical factors in assessing exposure to PBDEs via house dust. Environ. Int. 34, 1085‐1091, doi:10.1016/j.envint.2008.03.006 (2008).
- Julien, R., Adamkiewicz, G., Levy, J. I., Bennett, D., Nishioka, M. & Spengler, J. D. Pesticide loadings of select organophosphate and pyrethroid pesticides in urban public housing. Journal of Exposure Science and Environmental Epidemiology 18, 167‐174, doi:10.1038/sj.jes.7500576 (2008).
- Vojta , P. J., Friedman, W., Marker, D. A., Clickner, R., Rogers, J. W., Viet, S. M., Muilenberg, M. L., Thorne, P. S., Arbes, S. J. & Zeldin, D. C. First national survey of lead and allergens in housing: Survey design and methods for the allergen and endotoxin components. Environ. Health Perspect. 110, 527‐532 (2002).
- Wu, N., Herrmann, T., Paepke, O., Tickner, J., Hale, R., Harvey, E., La Guardia, M., McClean, M. D. & Webster, T. F. Human exposure to PBDEs: Associations of PBDE body burdens with food consumption and house dust concentrations. Environ. Sci. Technol. 41, 1584‐1589, doi:10.1021/es0620282 (2007).
- Wei, W., Boumier, J., Wyart, G., Ramalho, O. & Mandin, C. Cleaning practices and cleaning products in nurseries and schools: to what extent can they impact indoor air quality? Indoor Air, doi:10.1111/ina.12236 (2015).
- Morawska , L., He, C., Johnson, G., Guo, H., Uhde, E. & Ayoko, G. Ultrafine Particles in Indoor Air of a School: Possible Role of Secondary Organic Aerosols. Environ. Sci. Technol. 43, 9103‐9109, doi:10.1021/es902471a (2009).
- Nazaroff , W. W. & Weschler, C. J. Cleaning products and air fresheners: exposure to primary and secondary air pollutants. Atmos. Environ. 38, 21‐2865, doi:10.1016/j.atmosenv.2004.02.040 (2004).
- Singer, B. C., Coleman, B. K., Destaillats, H., Hodgson, A. T., Lunden, M. M., Weschler, C. J. & Nazaroff, W. W. Indoor secondary pollutants from cleaning product and air freshener use in the presence of ozone. Atmos. Environ. 40, 6696‐6710, doi:10.1016/j.atmosenv.2006.06.005 (2006).
- ACI. Consumer Product Ingredient Safety. (American Cleaning Institute, Washington, DC, 2010).
- USEPA. Exposure and Fate Assessment Screening Tool (E‐FAST): Version 2.0, documentation manual. ( U.S. Environmental Protection Agency, Springfield, VA, 2007).
- USEPA. Consumer exposure model (CEM) DRAFT user guide. ( U.S. Environmental Progection Agency, Washington, DC, 2015).
- Shin, H.‐M., McKone, T. E. & Bennett, D. H. Volatilization of Low Vapor Pressure ‐ Volatile Organic Compounds (LVP‐VOCs) during Three Cleaning Products‐Associated Activities: Potential Contributions to Ozone Formation. Chemosphere 153, 130‐137, doi:10.1016/j.chemosphere.2016.02.131 (2016).
- ten Berge, W. A simple dermal absorption model: Derivation and application. Chemosphere 75, 1440‐1445, doi:10.1016/j.chemosphere.2009.02.043 (2009).
- USEPA. Chemical and Product Categories (CPCat) database. ( U.S. Environmental Protection Agency, Washington, DC, 2016).
- USEPA. Estimation Program Interface SuiteTM for Microsoft Window, v 4.11. ( U.S. Environmental Protection Agency, Washington, DC, USA, 2016).
- Howard, C. & Corsi, R. L. Volatilization of chemicals from drinking water to indoor air: The role of residential washing machines. J. Air Waste Manag. Assoc. 48, 907‐914 (1998).
- Howard‐Reed, C., Corsi, R. L. & Moya, J. Mass transfer of volatile organic compounds from drinking water to indoor air: The role of residential dishwashers. Environ. Sci. Technol. 33, 2266‐ 2272, doi:10.1021/es981354h (1999).
- Shepherd, J. L., Corsi, R. L. & Kemp, J. Chloroform in indoor air and wastewater: The role of residential washing machines. J. Air Waste Manag. Assoc. 46, 631‐642 (1996).
- Singer, B. C., Destaillats, H., Hodgson, A. T. & Nazaroff, W. W. Cleaning products and air fresheners: emissions and resulting concentrations of glycol ethers and terpenoids. Indoor Air 16, 179‐191, doi:10.1111/j.1600‐0668.2005.00414.x (2006).
- Battelle. Measurement and Characterization of Aerosols Generated from a Consumer Spray Product. (Battelle, Richland, WA, 1999).
- Bennett, D. H. & Furtaw, E. J. Fugacity‐based indoor residential pesticide fate model. Environ. Sci. Technol. 38, 2142‐2152, doi:10.1021/es034287m (2004).
- Shin, H.‐M., McKone, T. E. & Bennett, D. H. Intake Fraction for the Indoor Environment: A Tool for Prioritizing Indoor Chemical Sources. Environ. Sci. Technol. 46, 10063‐10072, doi:10.1021/es3018286 (2012).
- McKone , T. E. (Livermore, CA, 1993).
- Clark, B., Henry, J. G. & Mackay, D. Fugacity analysis and model of organic‐chemical fate in a sewate‐treatment plant. Environ. Sci. Technol. 29, 1488‐1494, doi:10.1021/es00006a009 (1995).
- Isaacs, K. K., Glen, W. G., Egeghy, P., Goldsmith, M.‐R., Smith, L., Vallero, D., Brooks, R., Grulke,
C. M. & Özkaynak, H. SHEDS‐HT: an integrated probabilistic exposure model for prioritizing exposures to chemicals with near‐field and dietary sources. Environmental Science & Technology 48, 12750−12759, doi:10.1021/es502513w (2014).
- Beko , G., Weschler, C. J., Langer, S., Callesen, M., Toftum, J. & Clausen, G. Children's Phthalate Intakes and Resultant Cumulative Exposures Estimated from Urine Compared with Estimates from Dust Ingestion, Inhalation and Dermal Absorption in Their Homes and Daycare Centers. Plos One 8, doi:ARTN e62442 10.1371/journal.pone.0062442 (2013).
- Koch, H. M., Drexler, H. & Angerer, J. An estimation of the daily intake of di(2‐ ethylhexyl)phthalate (DEHP) and other phthalates in the general population. International Journal of Hygiene and Environmental Health 206, 77‐83, doi:Doi 10.1078/1438‐4639‐00205 (2003).
- USEPA. Exposure Factors Handbook. (U.S. Environmental Protection Agency, Washington, DC, 2011).
- Weschler, C. J. & Nazaroff, W. W. SVOC exposure indoors: fresh look at dermal pathways. Indoor Air 22, 356‐377, doi:10.1111/j.1600‐0668.2012.00772.x (2012).
- Roberts, E. M., English, P. B., Grether, J. K., Windharn, G. C., Somberg, L. & Wolff, C. Maternal residence near agricultural pesticide applications and autism spectrum disorders among children in the California Central Valley. Environ. Health Perspect. 115, 1482‐1489, doi:10.1289/ehp.10168 (2007).
- Schmidt, R. J., Tancredi, D. J., Ozonoff, S., Hansen, R. L., Hartiala, J., Allayee, H., Schmidt, L. C., Tassone, F. & Hertz‐Picciotto, I. Maternal periconceptional folic acid intake and risk of autism spectrum disorders and developmental delay in the CHARGE (CHildhood Autism Risks from Genetics and Environment) case‐control study. Am. J. Clin. Nutr. 96, 80‐89, doi:10.3945/ajcn.110.004416 (2012).
- Harrington, R. A., Lee, L.‐C., Crum, R. M., Zimmerman, A. W. & Hertz‐Picciotto, I. Prenatal SSRI Use and Offspring With Autism Spectrum Disorder or Developmental Delay. Pediatrics 133, E1241‐E1248, doi:10.1542/peds.2013‐3406 (2014).
- Rosenberg, R. E., Law, J. K., Yenokyan, G., McGready, J., Kaufmann, W. E. & Law, P. A. Characteristics and Concordance of Autism Spectrum Disorders Among 277 Twin Pairs. Arch. Pediatr. Adolesc. Med. 163, 907‐914 (2009).
- Grandjean, P. & Landrigan, P. J. Developmental neurotoxicity of industrial chemicals. Lancet 368, 2167‐2178, doi:10.1016/S0140‐6736(06)69665‐7 (2006).
- Arndt, T. L., Stodgell, C. J. & Rodier, P. M. The teratology of autism. Int. J. Dev. Neurosci. 23, 189‐ 199, doi:10.1016/j.ijdevneu.2004.11.001 (2005).
- Daniels, J. L. Autism and the environment. Environ. Health Perspect. 114, A396 (2006).
- Miodovnik , A. Environmental Neurotoxicants and Developing Brain. Mount Sinai Journal of Medicine: A Journal of Translational and Personalized Medicine 78, 58‐77, doi:10.1002/msj.20237 (2011).
- Chess, S. Follow‐up Report on Autism in Congenital Rubella. J. Autism Child. Schizophr. 7, 69‐81, doi:10.1007/bf01531116 (1977).
- Rodier , P. M., Bryson, S. E. & Welch, J. P. Minor malformations and physical measurements in autism: Data from Nova Scotia. Teratology 55, 319‐325, doi:10.1002/(sici)1096‐ 9926(199705)55:5<319::aid‐tera4>3.0.co;2‐u (1997).
- Landrigan , P. J., Lambertini, L. & Birnbaum, L. S. A Research Strategy to Discover the Environmental Causes of Autism and Neurodevelopmental Disabilities. Environ. Health Perspect. 120, A258‐A260, doi:10.1289/ehp.1104285 (2012). 118 CDC. Vol. 63 1‐24 (MMWR, 2014).
- Sparrow, S. S., Balla, D. A. & Cicchetti, D. V. Vineland Adaptive Behavior Scales. (1984).
- Moore, S. J., Turnpenny, P., Quinn, A., Glover, S., Lloyd, D. J., Montgomery, T. & Dean, J. C. S. A clinical study of 57 children with fetal anticonvulsant syndromes. J. Med. Genet. 37, 489‐497, doi:10.1136/jmg.37.7.489 (2000).
- Andersen, S. L., Laurberg, P., Wu, C. S. & Olsen, J. Attention deficit hyperactivity disorder and autism spectrum disorder in children born to mothers with thyroid dysfunction: a Danish nationwide cohort study. BJOG‐an International Journal of Obstetrics and Gynaecology , 1365‐1374, doi:10.1111/1471‐0528.12681 (2014).
- Khan, A., Harney, J. W., Zavacki, A. M. & Sajdel‐Sulkowska, E. M. Disrupted brain thyroid hormone homeostasis and altered thyroid hormone‐dependent brain gene expression in autism spectrum disorders. J. Physiol. Pharmacol. 65, 257‐272 (2014).
- Auyeung, B., Baron‐Cohen, S., Ashwin, E., Knickmeyer, R., Taylor, K., Hackett, G. & Hines, M. Fetal Testosterone Predicts Sexually Differentiated Childhood Behavior in Girls and in Boys. Psychol. Sci. 20, 144‐148, doi:10.1111/j.1467‐9280.2009.02279.x (2009).
- Auyeung, B., Baron‐Cohen, S., Ashwin, E., Knickmeyer, R., Taylor, K. & Hackett, G. Fetal testosterone and autistic traits. Br. J. Psychol. 100, 1‐22, doi:10.1348/000712608X311731 (2009).
Journal Articles on this Report : 3 Displayed | Download in RIS Format
| Other project views: | All 11 publications | 3 publications in selected types | All 3 journal articles |
|---|
| Type | Citation | ||
|---|---|---|---|
|
|
Alfonso‐Garrido J, Bennett DH, Parthasarathy S, Moschet C, Young TM, McKone TE. Exposure Assessment For Air‐To‐Skin Uptake of Semivolatile Organic Compounds (SVOCs) Indoors. Environmental Science & Technology 2019;53(3):1608‐1616 |
R835641 (Final) |
Exit |
|
|
Moschet C, Anumol T, Lew BM, Bennett DH Young TM. Household dust as a repository of chemical accumulation: New insights from a comprehensive high‐resolution mass spectrometry study. Environmental Science & Technology 2018;52(5):2878‐2887. |
R835641 (Final) |
Exit |
|
|
Shin H-M, McKone TE, Bennett DH. Model framework for integrating multiple exposure pathways to chemicals in household cleaning products. Indoor Air 2017;27(4):829-839. |
R835641 (2016) R835641 (2017) R835641 (Final) |
Exit |
Progress and Final Reports:
Original AbstractThe perspectives, information and conclusions conveyed in research project abstracts, progress reports, final reports, journal abstracts and journal publications convey the viewpoints of the principal investigator and may not represent the views and policies of ORD and EPA. Conclusions drawn by the principal investigators have not been reviewed by the Agency.