
Grantee Research Project Results
2015 Progress Report: Next Generation Volume Reduction Green Infrastructure Stormwater Control Measures in Support of Philadelphia's Green City Clean Waters Initiative
EPA Grant Number: R835556Title: Next Generation Volume Reduction Green Infrastructure Stormwater Control Measures in Support of Philadelphia's Green City Clean Waters Initiative
Investigators: Traver, Robert , Welker, Andrea , Wadzuk, Bridget , Clayton, Garrett M , Eisenman, Sasha W , Sen, Siddhartha
Current Investigators: Traver, Robert , Welker, Andrea , Wadzuk, Bridget , Clayton, Garrett M , Eisenman, Sasha W , Sen, Siddhartha , Sanders, Tonya , Hunter, James , Smith, Virginia , Shin, Hyeon-Shic
Institution: Villanova University , Morgan State University , Temple University
EPA Project Officer: Packard, Benjamin H
Project Period: September 1, 2013 through August 31, 2017 (Extended to August 31, 2018)
Project Period Covered by this Report: September 1, 2014 through August 31,2015
Project Amount: $1,000,000
RFA: Performance and Effectiveness of Green Infrastructure Stormwater Management Approaches in the Urban Context: A Philadelphia Case Study (2012) RFA Text | Recipients Lists
Research Category: Watersheds , Water
Objective:
In partnership with the Philadelphia Water Department, this project is focused on green infrastructure stormwater control measures (GI SCMs) to evaluate their performance and inform future designs in support of Philadelphia’s ‘Green City, Clean Waters’ program. The four project tasks are described in brief below.
Task 1: Evaluate the current generation of GI SCMs to develop, design, and validate the next generation of GI SCMs
Task 2: Evaluate benefits of GI SCMs to neighborhoods
Task 3: Develop a collaborative research environment for GI within the Philadelphia Community
Task 4: Disseminate results to include STEM educational outreach (K-12)
Progress Summary:
We are pleased to report that significant progress has been achieved over the reported period and the PI and Co-PIs are confident they will meet all goals and accomplishments of the project. As reported previously, access to the monitoring sites was delayed considerably due to an extended contractor delay and the need to obtain legal agreements to enter public school grounds. We met those challenges by revising our time line, and replacing two of our intended stormwater control measure monitoring sites.
Task 1: Evaluate the Current Generation of GI SCMs to Develop, Design, and Validate the Next Generation of GI SCMs
1. 1.1 Prioritize GI Research Needs with the Philadelphia Water Department
Status - This task was completed in Year 1.
1.1.2 Monitor and Analyze the Data Collected from the GI Constructed with Present-Day Designs
1.1.3 Work with PWD to Instrument Projects. (Formerly Work with PWD to Instrument Projects Already Scheduled for Construction)
Three sites have been instrumented as per the Quality Assurance Project Plan (QAPP) and are currently recording data. This task was at the 95% mark at the end of year 2 and is complete prior to the date of this report. Note that the QAPP was revised and approved at the beginning of the year.
Morris Leeds Tree Trench – This stormwater control measure consists of a stone bed with five stormwater tree pits (Figure 1). Runoff from a 26,000 ft2 drainage area enters the site through a Philadelphia Water Department “Green Inlet.” Instrumentation installed as per the QAPP includes a weather station, soil moisture meters in the tree pits, water level recorders in the stone infiltration bed and area velocity flow meters in the green inlet. The size of this tree trench is extremely large and the comparison of the soil moisture in the five tree pits provides for replicate analysis.
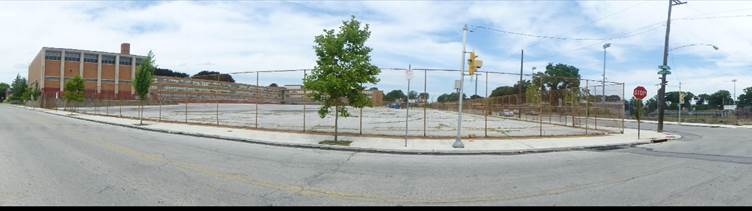
Figure 1 - Tree Trench - Morris Leeds
Giraffe Lot Philadelphia Zoo – West Bioinfiltration Rain Garden - This stormwater control measure consists of an 11,200 ft2 drainage area leading to a bioinfiltration rain garden with a footprint of 1280 ft2 without underdrain or stone bed (Figure 2). Inflow enters from the neighboring street, and overflows to the East Giraffe Lot Rain Garden via a grass swale. Instrumentation installed as per the QAPP includes a weather station, soil moisture meters, and water level instrumentation within the bowl, as well as H flume inflow and V notch weir overflow measuring stations.
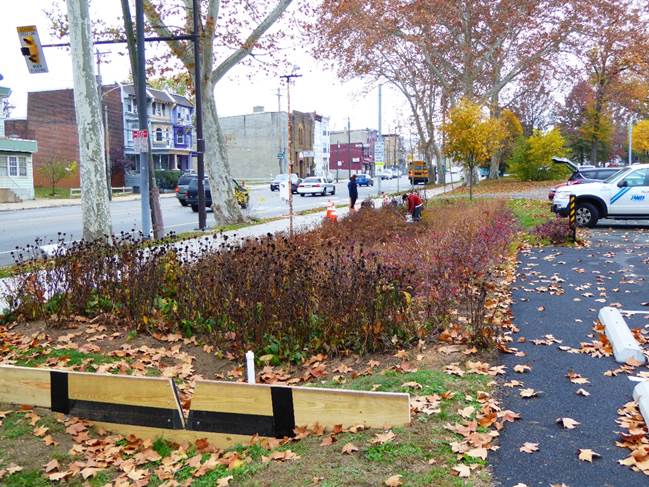
Figure 2- West Bioinfiltration Rain Garden - Giraffe Lot
Giraffe Lot Philadelphia Zoo – East Bioinfiltration Rain Garden - This stormwater control measure consists of a 12,500 ft2 drainage area leading to a bioinfiltration rain garden with a footprint of 810 ft2 (Figure 3). The site is unusual as the rock bed was built to the side instead of underneath the bed of the rain garden. Inflow enters from the neighboring street, and overflows from the West Giraffe Lot Rain Garden via a grass swale. Instrumentation installed as per the QAPP includes a weather station, soil moisture meters, water level instrumentation in both the bowl and rock bed, H flume and V notch weir inflow measurement, and “beehive” pipe organ overflow orifice measurement device for measuring outflow to the rock bed.
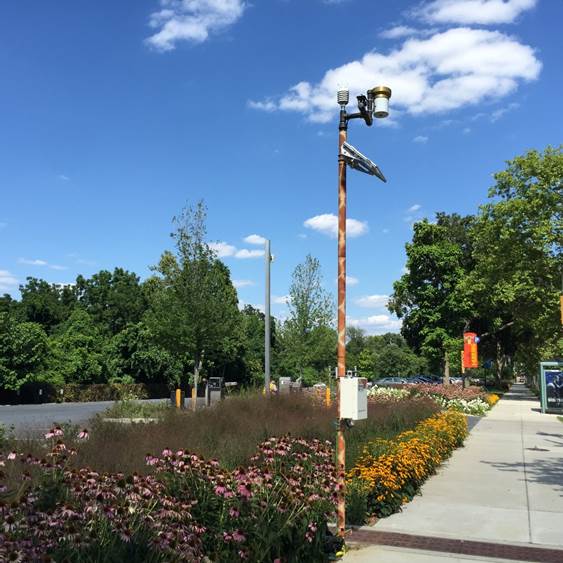
Figure 3 – East Bioinfiltration Rain Garden – Giraffe Lot
The instrumentation of the two stormwater control measures at the Philadelphia Zoo are replacements due to the delays in access due to contractor challenges. The change is of benefit to the project for multiple reasons. First, the linkage of the two sites (Figure 4) adds the benefit of a “treatment train,” as overflow from the upper site enters the lower site via a grass swale. Second, during construction of the lower site, the rock bed was moved to the side of the site instead of underneath, thus accidently mimicking a proposed next generation design concept. Finally, the site is adjacent to the Microsoft School of the Future, a LEED Philadelphia public high school that provides more STEM interaction possibilities, and one that already has a green roof and stormwater reuse incorporated within its campus.
Figure 4 - Rain Garden Configuration - Giraffe Lot (The west rain garden is to the left in this figure, and the east rain garden is to the right.)
During Year 2, the installation monitoring design was completed, to include laboratory testing of all flow measurement devices. Figure 5 shows the laboratory testing (left) and field installation (right) of the H flume in at the Giraffe Lot site. Note the design was selected to pass leaves and other debris easily, and to fit into the inlet channel. The area velocity flow meter underwent similar evaluation.
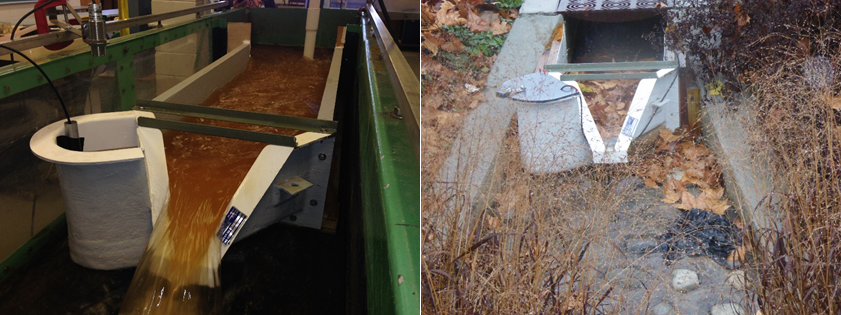
Figure 5 - H flume (Laboratory, left, and Field, right)
The largest challenge was to develop a methodology to measure flow rates in the “beehive” overflow risers that transfer overflow from the East Zoo site to the rock bed. After failing to find a commercially available solution, an innovative orifice insert, termed the organ orifice flow meter, was developed, tested, constructed and installed in the field. Figure 6 (left) shows the orifice insert, the center picture is the device undergoing testing in the laboratory, and the right pictures is the insert installed in the field. The mesh over the beehive grate is to prevent debris from entering the rock bed.
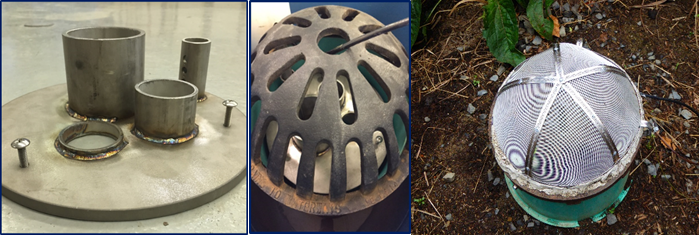
Figure 6- Pipe Organ Beehive Flowmeter
At the end of Year 2 two of the three sites were instrumented, and the third is on line at this time. It is expected that continual improvements in instrumentation and communication systems will be ongoing as discussed under task 1.2.5.
1.1.4 Monitor and Analyze Collected Hydrologic Data
This task was started in Year 1. As instrumentation was installed, data collection was initiated. Several examples are presented here (Figures 7-10). Figure 7 shows sample data from the weather station at Morris Leeds Tree Trench from a storm on August 11, 2015 of approximately 25 mm of precipitation. Figure 7 (left) is the rainfall, relative humidity, air temperature and pressure, and Figure 7 (right) is wind speed.
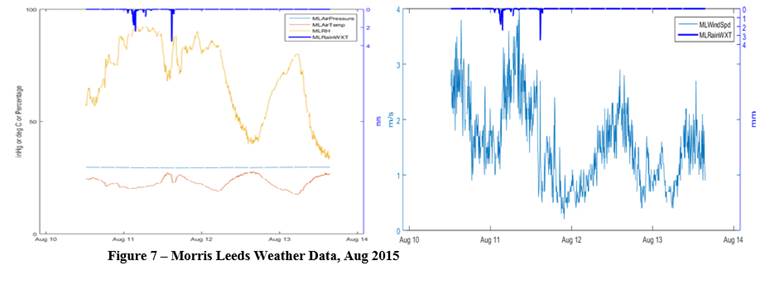
Figure 8 shows soil moisture meter data for two tree pits for the Aug 2015 event. Note the fast rise of soil moisture followed by a slow decline after the storm, indicating retained storage within the soil media and slow release.
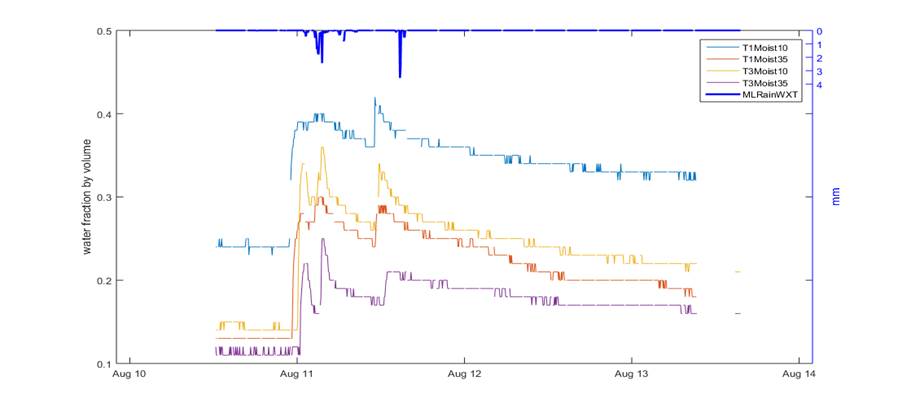
Figure 8 - Morris Leeds Soil Moisture Data, Aug 2015
Working with the Philadelphia Water Department, hydrant testing was conducted at the Morris Leeds site as a test of the instrumentation, and to simulate a larger storm event (Figure 9). For this test a flowmeter is attached to the hydrant, allowing for measured inflow entering the system. You can see the blue flowmeter in Figure 9 (left) and the resulting flow rate (green) and depth measurement (blue) to the right of the figure. This test allows for both a critical examination of the flowmeters, and sensors, and for simulating a larger storm event. This type of testing will be repeated for all sites in Year 3.
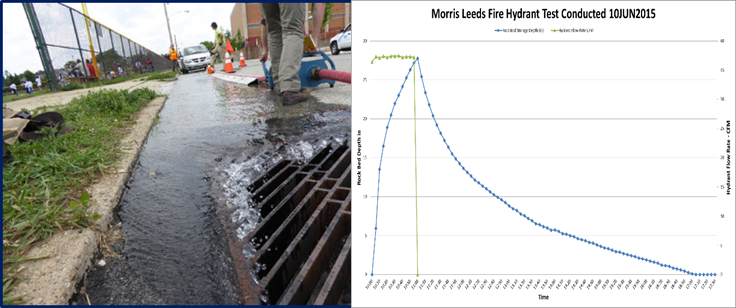
Figure 9 - Hydrant Testing - Morris Leeds
An October storm event is shown for the Zoo site (Figure 10). Due to the lack of recorded storm events at the end of the contract year, an October storm event of over 45 mm is displayed. Note the instantaneous rise of depth in the pond showing the impervious area connection.
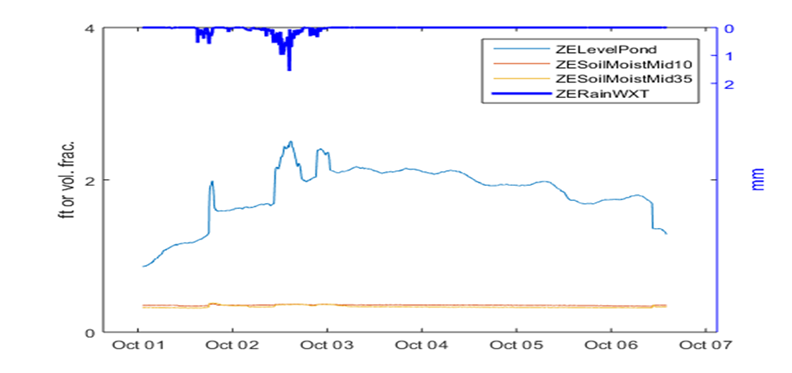
Figure 10 - Zoo Rain Garden Data Plot, Oct 2015
Work is underway on the development of a database structure to support storage and access to data. The database system is being designed to support data analysis as well. Other efforts include initial progress on the development of watershed hydrologic models to tie the rainfall to the inflows. At this time we are using the U.S. EPA SWMM model, and this task will continue in Year 3 to completion.
1.2.3 Monitor the Health of the Plants and Assess the Effect of Vegetation on GI Performance (Temple University Subcontract)
Temple University personnel are evaluating the evapotranspiration rates of trees in a GI tree trench and their level of water stress between rain events. To date, nearly 3000 data points have been collected of stomatal conductance from approximately 20 different species/cultivars of trees in GI installations at the Morris Leeds site from May (leaf expansion) through November (leaf senescence). Data also have been gathered to compare individuals of the same species that are growing in GI tree trenches and in traditional non-GI tree pits (Koelreuteria paniculata, Prunus serrulata, Quercus macrocarpa, Quercus robur 'Pyramich'). The Lowber Avenue tree trench has been measured 5 days a week from May-August and three days a week from September-November for stomatal conductance, leaf water potential (water stress) and leaf area index (canopy size and density). To our knowledge this is an unprecedented amount of data. Most data sets of this kind measure on one day in each season. All data has been regularly backed up onto Temple servers and is in the process of being analyzed the data for upcoming conference presentations. Two undergraduate honors students have been trained and contributed significant work to the project.
1.3 Develop Recommendations for and Implement Next Generation GI
This task will be initiated in Year 3. Recommendations will be developed based upon this research, related ongoing VUSP research, and literature available to the team, as well as observations and knowledge gained from working with the Philadelphia Water Department. Initial thoughts are that we can categorize the recommendations into three themes.
Inlet Hydraulics – The process of runoff entering the stormwater control measure is critical to the success of green infrastructure. Figure 11 demonstrates the importance of the inlet hydraulics by showing the effects of post-construction enhancements added by Philadelphia Water Department. For this site, hydrant testing revealed that some flow was bypassing the entrance. To correct this problem, the concrete was milled, and an asphalt cold patch was added to direct street runoff into the inlet.
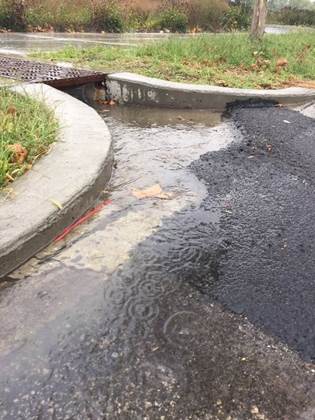
Figure 11 - Zoo Surface Inlet
Trash / Sedimentation – Trash and sedimentation are a challenge to green infrastructure, and can reduce effectiveness and longevity, and increase cost of maintenance. Both underground and inflow pathways can be restricted with trash. Figure 12 shows leaves reducing flows through a surface inlet at the Zoo site. Soda bottles and other trash also have been observed clogging entrances during storm events, reducing runoff entering from the contributing watersheds and increasing maintenance costs.
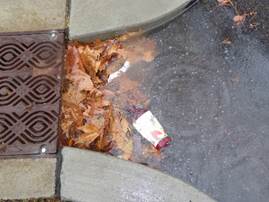
Figure 12 - Leafs Clogging Inlet
Soil / Rock Bed / Infiltrating Surface Configuration – A goal of this research is increased understanding of the relationships between soil and rock bed infiltration patterns. From other ongoing research, and reviews of current literature, the benefits of increased infiltration footprints and decoupled rock bed storage areas are of interest. During construction of the lower zoo rain garden, previously unknown utilities were located requiring a change to the stormwater control measure. The change caused the rock bed storage area to be built to the side of the unit instead of underneath. This configuration mimics the envisioned next generation SCM design, greatly aiding the research.
1.4 Develop Recommendations for Advanced Sensors
As part of this project, we have been faced with the challenging task of instrumenting existing sites (e.g., Morris Leeds). This was a change requested by the Philadelphia Water Department due to the extended project construction process. This presented a difficulty for monitoring since the SCM must either be retrofitted to enable power/data line integration or many battery operated sensing systems must be deployed. Regardless of which option is chosen, the expense of implementation is high, for the former because of the added cost of construction and for the latter because of the high cost of conventional instrumentation equipment (data loggers, batteries, etc.).
To overcome these issues, we have leveraged emerging low-cost, yet highly functional computer hardware and sensing technologies to enable the implementation of battery operated instrumentation systems (the second choice from above). Specifically, a low-cost, network capable data logger is being developed using low-cost computing hardware (Raspberry Pi and Arduino components). An illustration of a typical monitoring setup is shown in Figure 13. Local data loggers collect sensor information (seen in the tree trenches) and relay it to another system which is centrally located (seen on the weather station). Information can then be accessed either on- or off-site.
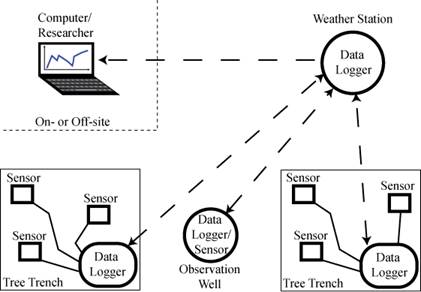
Figure 13 - Illustration of the GI Monitoring System. Dashed lines (- - -) represent wireless connections.
Progress to Date: To date, the low-cost data loggers have been developed and installed at Morris Leeds. They are currently collecting data as seen previously in Figure 8. An example box is shown in Figure 14. The data logger uses both a Raspberry Pi B+ board computer (Pi, for short) and an Arduino UNO microcontroller. The two components work together, with the Pi focused on high-level data processing, wireless communication (a WiFi dongle is attached to the Pi in Fig. 14), and data logging, and the Arduino focused on low-level data acquisition and communication with the sensors. With the ability to develop software for each site individually, this core is able to be used for a multitude of different applications.
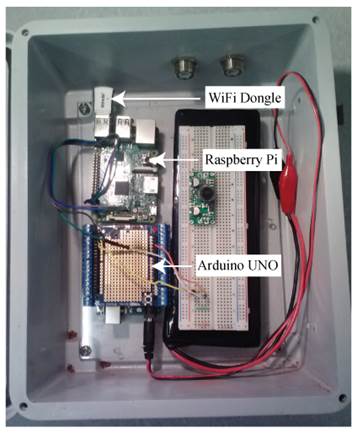
Figure 14 - Example physical data logger configuration
1.5 Monitor, Analyze, and Validate Next Generation Stormwater Control Measures Develop Recommendations for and Implement Next Generation GI
This task will be initiated in Years 3 and 4. We have the advantage that the Lower Zoo Rain Garden has the expanded footprint that we are looking for as part of the next generation site. We also are looking to instrument in Year 3 the Roosevelt Playground Sidewalk Planters, as the next generation comparison to the tree trench site, and to support task 1.4.
1.6 Extend the Results to the Subwatershed Scale
This is a future and concluding task.
Task 2: Evaluate Benefits of GI SCMs to Neighborhoods (Morgan State – Subcontract)
During Year 2, Morgan State has devised a detailed methodology. An expanded version and work plan are attached as Appendix A.
Benefit-Cost Analysis
The benefit-cost (B/C) analysis is a widely used decision making tool for public investment. Among mutually exclusive alternatives, the alternative with the highest B/C ratio given constraints is selected. For this study, it examines the current benefits and costs of mutually exclusive alternatives of GI (i.e., rain gardens, tree planters, bio-infiltration, green roofs, etc.) and projecting out 10 years the future cost (taking into consideration of a constant compound inflation rate based on the average of the past 10 years). All costs and benefits will be converted to the present value.
Housing Analysis
A hedonic price model will be used to assess the impact of GI on housing price or housing value (depends on the data availability). This study will differ from previous studies as they assess only housing that was currently for sale. This study will look at all housing units within a geographical area of the GI.
Ten blocks within Philadelphia that have a critical mass of GI infrastructure will be surveyed. It will be determined when the GI was put into place and housing value data from the previous year will be used as the baseline for a comparison.
The yearly housing values for that time moving forward will be noted and the hedonic price model will be used to see if there is a statistical significance in the housing price (taking into consideration inflation).
Visual Analysis
The goal is to create a system that can be used to evaluate streets. This system should help track the impact of the GI projects on street quality in Philadelphia.
American Planning Association guidelines provide “Characteristics and Guidelines for Great Streets.” It does not only focus on design standards, but also covers the importance of safety, social interaction, and sustainability, which brings a planners perspective to this research, instead of just focusing on the physical built environment. On some streets the impact of GI could be very small. Thus, it would be unfair to rate these projects with high quality streetscape design guidelines. Specifically, GI projects are not intended to create a space, but rather are intended to control rainwater and improve streets. Consequently, we will develop our own rating system. Our system would give credit to function, improvement, and efficiency as well as aesthetics, which will be a more holistic rating approach. It is anticipated that this methodology could be used by other cities evaluating the worth of GI.
Willingness to Pay
A survey will be used that will employ the adaptive choice-based conjoint (ACBC) analysis to assess residents’ acceptance of and willingness to pay for a various bundle of green infrastructure attributes, prices, etc. The advantage of this approach is that it allows residents to compare multiple features of GI and asks them to decide which features (i.e., shade, water filtration with runoff reduction, aesthetics, etc.) are most important to them and which combination of features are most appealing and, of course, how much are they willing to pay for these benefits. Another benefit of this method is its capability of estimating individuals’ preference structures (utility levels) of technology not yet in market or not widely penetrated.
Task 3: Development of a Collaborative Research Environment for Green Infrastructure within the Philadelphia Community
As discussed at the EPA STAR grant meeting, considerable progress also has been made on Task 3, Development of a GI Collaborative Research Environment within the Philadelphia Community. Previously a data format was developed and presented at the annual meeting, and it was agreed that the Annual meeting would be considered as an advisory council for the projects. Other activities include:
- The Morris Leeds School site was chosen to be coincident with the Swarthmore / UMBC grant effort. During Year 2 Villanova personnel worked to get permission from the Philadelphia School district for the Swarthmore instrumentation, and aided in its installation.
- Villanova continues to work with Temple University as an EPA STAR Grant subcontractor for blue / green roof monitoring of the Paseo Verde site.
- Villanova has organized a session for the 2016 ASCE EWRI conference on the EPA STAR grantees. All of the Grantees have submitted abstracts to the conference.
- Villanova invited all grantees to present at the 2015 Pennsylvania VUSP Stormwater Symposium held during October 2015 (next grant year).
- Villanova accepted an invitation to present at The Philadelphia Exchange Sept 2015 (Next Grant Year).
Task 4: Disseminate Results to Include STEM Outreach
Originally a research site at Roosevelt Playground was considered, but construction issues at this site did not enable us to move forward with it as a research facility in year one or two. However, at the playground, there is a recreational center (managed by the Philadelphia Parks and Recreation REACH Program) that houses an afterschool program and a summer camp. In spring 2015, we held monthly afterschool programs at the recreational center on topics revolving around the environment, stormwater and our monitoring program, such as lessons on the water cycle, wind and pollution (Fig 15). Some of these activities were aligned with and directly supported parallel outreach efforts by the Farm Philly organization, who helped students construct a community vegetable garden adjacent to our meteorological sensors. The group of students were mostly from the local area, are culturally diverse and range in age from 5-13. In summer 2015, we worked with the recreational center to host summer campers for a day at Villanova University, which included different lessons on stormwater and engineering topics. Students conducted experiments in the soils laboratory to understand soil moisture and soil types, studied fluid phenomenon and all participated in activities focused on Villanova’s rain gardens and green roof. The summer program reached approximately 25 students ranging in age between 5 and 13 from the neighborhood around Roosevelt Playground. It is planned that working with this recreational center will continue in future years.
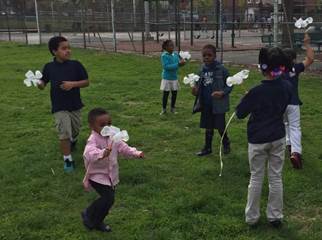
Figure 15 - Roosevelt Park after School Program
Contact also has been made with both the Morris Leeds Middle School, and the Microsoft School of the Future which is adjacent to the Zoo Rain Gardens. The Philadelphia Water Department “Green Stem” team is in touch with our sensor development team as well.
Future Activities:
Over the subsequent reporting period, the primary objectives will be to advance activities on all project tasks as appropriate. Some of the future activities have already been discussed in the Outputs and Outcomes section earlier. The overall task 1.3 will be of prime focus. We are projecting hydrant testing of all sites before winter. Over the winter we will d continue development of the watershed model. Temple has agreed to help us with LIDAR mapping of the watershed. (Note: some instrumentation will be off line in freezing weather to prevent damage).
Task 1.4 (Sensors) will be focusing on the following:
- Extending the battery life of the low-cost data logger boxes through the integration of solar panels and a potential migration to lower-power-draw electronics.
- Continued development of a smart well cap.
- Implementation of the wireless network capabilities discussed above. Note that this functionality has been proven in the laboratory setting, but has yet to be proven in the field. It also should be noted that we may move away from WiFi in favor of radio frequency (RF) communications depending on performance.
- Testing and possible implementation of low-cost sensing units, like the soil moisture meters being sold by Vegitronics. While these sensors are promising, the general consensus from users is that they are unreliable. Thus we plan to do an exhaustive test of this (and other) sensor performance to determine field readiness.
- Development of sensor fusion theory to determine when low-cost sensors (or a network of low-cost sensors) can provide equivalent measurement performance when compared to higher cost sensors.
It is expected that the Roosevelt site will be used as a test bed for this work.
The action plan by Morgan State (Task 2) will be initiated in Year 3, and is attached as an appendix to this document. Since significant social, economic, and demographic factors may play into the decision to invest in green infrastructure, Morgan State is planning to conduct a survey. They will not publish any identifiable information from the survey randomly aggregated, non-identifiable data will be published. Therefore all identities of participants will be masked. To insure that this approach is not categorized as Human Subjects research, Morgan State will have their work plan reviewed by their Institutional Review Board, and will submit the findings to U.S. EPA.
Task 3 will continue to be a priority for both Years 3 and 4, with the expectations of a special conference session on all of the U.S. EPA STAR Grant research projects at the 2016 ASCE ERWI Conference.
Task 4 also will continue, with expectations of continuing work with the Roosevelt Playground, and incorporating activities at both the Morris Leeds Middle School and Microsoft School of the Future High School. Outreach activities will include presentations at the VUSP – PA Stormwater Symposium (October), and the PWD Municipal Exchange (September). Dr. Traver has been invited to present on the project at the International LID conference in Beijing, and we expect more outreach opportunities to become available. The research website will be revisited and improved.
Journal Articles on this Report : 1 Displayed | Download in RIS Format
| Other project views: | All 19 publications | 5 publications in selected types | All 5 journal articles |
|---|
| Type | Citation | ||
|---|---|---|---|
|
|
Caplan JS, Galanti RC, Olshevski S, Eisenman SW. Water relations of street trees in green infrastructure tree trench systems. Journal of Urban Forestry & Urban Greening 2019;41:170-178. |
R835556 (2015) |
Exit |
Progress and Final Reports:
Original AbstractThe perspectives, information and conclusions conveyed in research project abstracts, progress reports, final reports, journal abstracts and journal publications convey the viewpoints of the principal investigator and may not represent the views and policies of ORD and EPA. Conclusions drawn by the principal investigators have not been reviewed by the Agency.