Rate of Land Development vs. Rate of Population Growth
The rate of land conversion to urban uses is due more to modern settlement patterns than to population growth. According to the U.S. Department of Agriculture's National Resources Inventory, developed land in the contiguous United States increased 34 percent between 1982 and 1997. During the same 15-year period, population grew by about 15 percent; thus land consumption occurred at more than twice the rate of population growth (USDA NRCS 2001; U.S. Census Bureau 2000).
More than a quarter of all the land conversion from rural to urban and suburban uses since European settlement occurred between 1982 and 1997 — a period of only 15 years. This graph demonstrates the potential for more than 68 million additional acres of land to be developed by 2025 if current trends continue.
Changes nationwide and by state are shown in the set of graphs, Changes in Population & Newly Developed Land from 1982-1997.
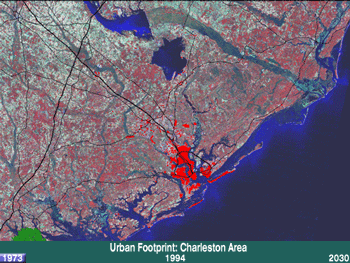
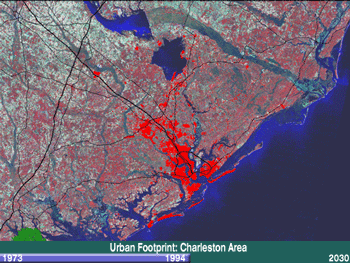
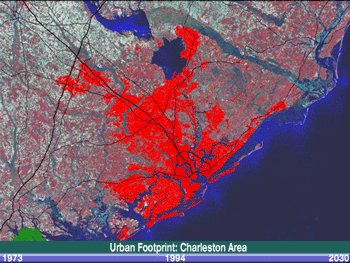
The graphic, Urban Expansion, shows the growth trend of urban land expansion outpacing population growth in select cities across the United States. Click on cities highlighted on the map to view time-lapse progressions of satellite imagery showing urban growth pushing the urban fringe outward.