
Grantee Research Project Results
Final Report: Towards a Verifiable Ammonia Emissions Inventory for Cattle Feedlots in the Great Plains
EPA Grant Number: R834551Title: Towards a Verifiable Ammonia Emissions Inventory for Cattle Feedlots in the Great Plains
Investigators: Ham, Jay M , Lamb, Brian , Johnson, Kristen , Pressley, Shelley N.
Institution: Colorado State University , Washington State University
EPA Project Officer: Chung, Serena
Project Period: April 1, 2010 through March 31, 2013 (Extended to March 31, 2014)
Project Amount: $499,875
RFA: Novel Approaches to Improving Air Pollution Emissions Information (2009) RFA Text | Recipients Lists
Research Category: Air Quality and Air Toxics , Air
Objective:
The goal of this study is to use novel field measurements and new modeling approaches to develop and evaluate methodology for measuring and predicting site-specific beef feedlot ammonia emissions in the Great Plains.
Summary/Accomplishments (Outputs/Outcomes):
Achievements can be categorized into several areas: 1) development of low-cost conditional sampling technology for making long-term measurements of ammonia at beef feedlots using passive samplers; 2) time-averaged NH3 concentration data from the conditional samplers were used in combination with inverse dispersion modeling to estimate seasonal and annual NH3 emissions from beef feedlots; 3) long term studies of NH3 emissions from a 25,000-head feedlot were used to quantify emissions and the fraction of the feed nitrogen lost to the atmosphere as NH3; 4) NH3-N isotopic signatures were measured near feedlots and other strong NH3 sources to study the how livestock NH3 differs from other sources; 6) detailed studies of the equilibrium constant and Henry constant for NH3 in manure were completed to determine how temperature affects NH3 volatilization from beef feedlot and dairy pens; and 7) integrated results suggest a simple top-down approach can be used to estimate the NH3 emissions inventory for beef feedlots in the High Plains of the U.S.
General Findings:
- A new type of conditional sampler network was perfected that uses Radiello passive ammonia samplers. Deployment of the cartridges was robotically controlled so the samplers were only exposed to air under a user-defined set of weather conditions namely when winds are blowing directly from the feedlot source with sufficient velocity for turbulent flow. A wireless network is used to control all the samplers. Concentrations measured with the passive samplers were compared to data from a long path IR laser and cavity ring down analyzer and found to be in good agreement. At one sample location, the network has operated for over two years with virtually no maintenance. Thus, this technology is ready to be published and open sourced for use within the livestock industry. This new technology could be used by the industry and their consults to make low-cost estimates of NH3 emissions on a year round basis.
- A network of the robotic Radiello samplers were deployed on the upwind and downwind edges of a 25,000-head feedlot near Fort Morgan, CO. The samplers were replaced at two-week intervals to give a seasonal depiction of concentrations and reveal NH3 hot spots at the operation. Concentration data were then used in an inverse dispersion model (FIDES) to estimate the areal NH3 emissions from the feedlot. These results were compared the livestock feeding data to determine what fraction of N inputs lost to the atmosphere. Results showed that NH3 losses were typically 50 to 70% of feed nitrogen.
- Data analysis was completed of a 2011 field campaign to survey the nitrogen isotopic signatures at feedlots, dairies, and other strong NH3 along the front range of Colorado. Wet deposition and the isotopic signature of nitrogen were also being monitored in nearby Rocky Mountain National Park (RMNP). Results showed that most livestock operations have very similar isotopic fractionation. The isotopic results from fertilizer application and wastewater treatment plants were similar. Thus, isotopes may have limited value when attempting to identify livestock sources contributing NH3 to a region or air mass.
- Feeding trials showed that the % crude protein the livestock diet had a dramatic effect on pen surface NH3 emissions. Reducing crude protein from the industry standard 13.5% to 11.62% reduced ammonia emissions by 20 to 40 % without affecting cattle weight gain.
- A laboratory study was conducted to determine the ammonia Henry constant (Kh) and ammonium acid dissociation constant (Ka) in feedlot slurries in order to improve our current understanding and modeling of ammonia loss from feedlots. Measurements within the bulk aqueous phase and in the air above a slurry were made to better determine how these parameters are impacted by temperature and ionic strength. Accurate sub models of Kh ad Ka for livestock waste are crucial for modeling NH3 volatilization from these systems when mechanistic models are employed.
- Results from this study showed ammonia emissions from beef feedlots are driven by rapid volatilization of urea from urine patches on the pen surface. Thus, emissions are governed strongly by the amount of excreted nitrogen, especially in the urine. Recall, beef cattle typically only retain about 15% of the feed nitrogen, the remaining 85% is excreted on the pen surface mainly as urea in the urine. Because there is much consistency in feedlot diets in the High Plains Cattle feeding region, it follows that the fraction of fed (or excreted N) nitrogen lost to the atmosphere is also relatively uniform across many feedlot operations. There is not strong evidence that manure management strongly affects feedlot scale emissions. The fraction of fed nitrogen lost to the air in this study (50 to 70%) was similar to other studies in the Texas Panhandle and Canada, despite large differences in temperatures. Thus, it is probably that relatively accurate inventories of beef feedlot NH3 losses can be obtained from monthly cattle on feed numbers (published monthly by state via National Ag Statistics Service or NASS) coupled with basic industry standard information on cattle weights and crude protein in the diets. More feedlot-specific (site specific) estimates of NH3 losses could be made from an individual feedlots data on dry matter intake and diet composition (nitrogen content). These data are routinely available at most feedlots. This top down / mass balance strategy is likely a more reasonable approach to estimating feedlot NH3 inventories than using a mechanistic model that is fraught with uncertainty in many input variables. Certainly the logistical simplicity of the top down approach could be a distinct advantage to feedlot managers and other who need more accurate inventory information for regulatory reporting and large scale modeling.
Results
Instrumentation and Measurement
Much progress was made on developing the passive conditional samplers deployed in a multi-nodal wireless network on the periphery of livestock operations. Using a weather based sampling protocol allows these units to both identify NH3 hot spots within feedlots and help quantify emissions via inverse modeling.
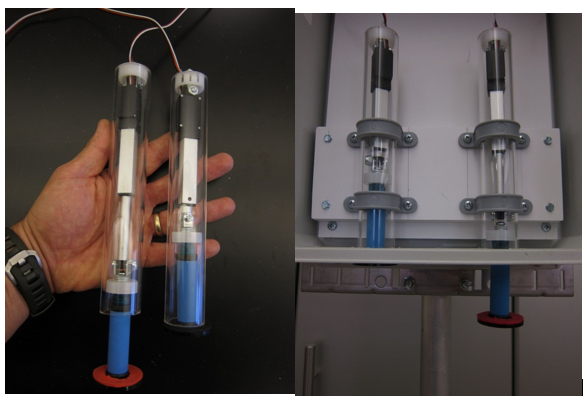
Figure 1. Two Radiello diffusive samplers for NH3 housed in the robotic mechanisms that control their exposure to the atmosphere. Shown are samplers in the open and closed positions (the rightmost picture shows installation in an environmental enclosure attached to a mast). A wireless datalogger system is used to control the linear actuators. Results are used to examine NH3 concentrations and N isotopic composition near cattle feedlots and other sources.
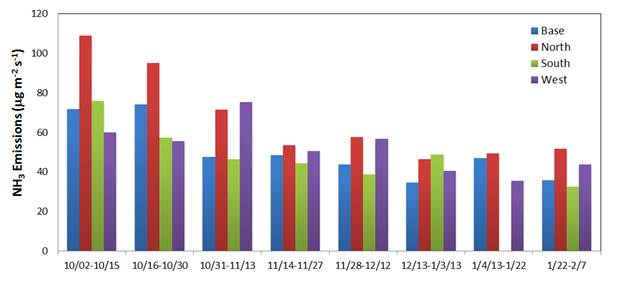
A sampling network was deployed and operated for two years at a 25,000 head feedlot near Fort Morgan, Colorado. Ammonia concentrations at the downwind boundary typically ranged between 1000 and 3000 ppb. These data were then used in combination with data from a sonic anemometer to estimate emissions using the FIDES model. Below is an example of the two-week average NH3 emissions at different locations on the downwind edge of the operation. Also shown is a table of daily emissions per unit area, per animal, and % of fed nitrogen.
| Dates | No. Days | Emissions (g m-2 d-1) | Emissin Factor (g head-1 d-1) | % Fed N |
|---|---|---|---|---|
| 10/02-10/15 | 14 | 6.8 | 140.1 | 78 |
| 10/16-10/30 | 14 | 6.1 | 124.9 | 69 |
| 10/31-11-13 | 13 | 5.2 | 106.7 | 59 |
| 11/14-11/27 | 14 | 4.3 | 87.2 | 48 |
| 11/28-12/12 | 15 | 4.3 | 87.3 | 48 |
| 12/13-1/3/13 | 22 | 3.7 | 75.5 | 42 |
| 1/4/13-1/22 | 198 | 3.8 | 77.8 | 43 |
| 1/23-2/7 | 16 | 3.5 | 72.6 | 40 |
Ammonia emissions as estimated from NH3 concentration data and weather data collected on the downwind side of a 25,000 head feedlot. Also shown are emissions as a function of feed nitrogen.
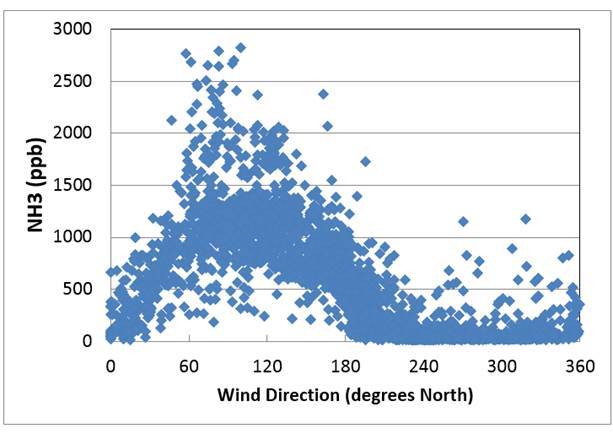
Figure 4. Ammonia concentration as function of wind direction measured on the west edge of a 25,000 head feedlot with a cavity ring down analyzer.
Results from the feedlot emissions studies showed:
- Concentrations of NH3 at this feedlot were slightly higher than observed at locations in KS and TX. This is likely caused by lower wind speeds, not higher emissions.
- Spatial variation in emissions can be large with the zone of highest flux being 80% greater than the zone with the lowest flux. While more research is needed, the highest emissions were seen near pens with younger cattle being fed more crude protein.
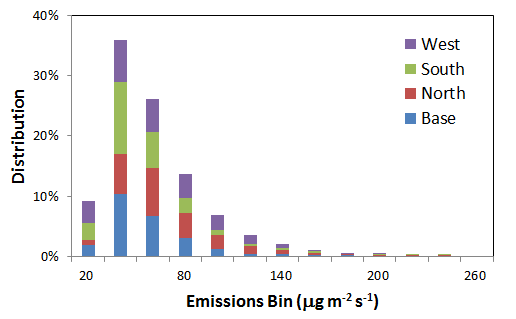
- The statistical distribution of emissions over the study period followed a log normal distribution.
- The emissions showed a seasonal trend with fluxes decreasing in winter at lower temperatures. However, emissions did not decrease as much as expected during very cold weather. Rapid volatilization from urine patches (initially at animal body temperature) may moderate the impact of cooler air temperatures. Also, laboratory studies suggest that the Henrys constant and the acid disassociation constant in feedlot manure may not decrease with temperature at the same rate predicted by pure aqueous models. Thus, the seasonal affect of temperature on feedlot ammonia emissions at more northern latitudes may be less than predicted by mechanistic modeling. That is, ammonia emissions from feedlots in northern Great Plains are still quite large in the winter despite cold temperatures.
- The fraction of fed nitrogen lost the air as NH3 ranged from 70% to 40% in with an overall average of 53%. This fractional loss of fed nitrogen is very similar to data reported in other studies from Canada and Texas.
- The use of passive conditional samplers in combination with inverse modeling provides a very low cost method for estimating NH3 emissions from feedlots. While not shown here, comparisons of this simple approach to bLS inverse modeling using windtrax 2.0 and high frequency concentration data (i.e., a complex research grade approach) showed good agreement. This technology could be transferred to the cattle feeding industry and their consulting engineers allowing seasonal monitoring of emissions.
Effect of dietary crude protein on NH3 emissions
The crude protein level in livestock diets is perhaps the most important management factor affecting NH3 losses from beef cattle feedlots. Unfortunately, little field data is available. Thus, a field study (partially supported by this grant) was conducted that showed reducing crude protein levels can lower NH3 losses from the pen surface by 20 to 40% (Galles et al., 2011). This is a crucial finding because the crude protein in the diet will be a key input any emissions prediction tool.
Figure from Galles et al. (2011) showing the effect of diet on pen surface NH3 emissions.
Figure 4. shows the cumulative ammonia emissions for each of the sampling days and each of the dietary CP treatments. Control: 13.5% CP; Oscillating N: 13.5% CP 4 days/wk and 11.62% CP 3 days/wk; and Reduced N: 11.62% CP.
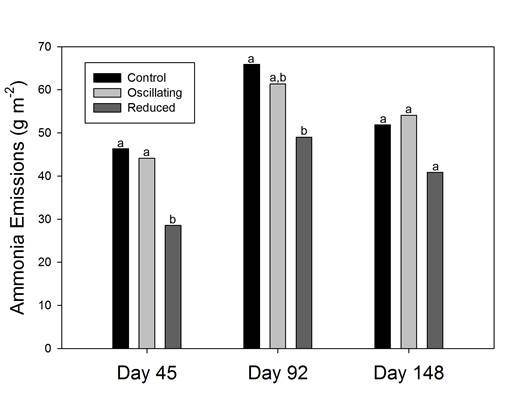
Figure 5. A review of the literature showed that the use of feed additives is more widespread than expected and could have a significant effect on N use efficiency and excreted N. If certain feed additives are removed from the market for human health reasons, it is likely that an unintended consequence will be increased NH3 losses to the atmosphere from feedlots.
Modeling Ammonia Emissions
This project has explored a wide range of modeling approaches. Initially the mosaic model of Ham (2010) was used because it simulated volatilization, nitrogen balances, and the energy balance of urine patches separately from the rest of the pen soil. However, like all NH3 volatilization models, results were very sensitive to the submodels used to estimate Kh and Ka as a function of temperature. For this reason, laboratory experiments were performed to make direct measurements of Kh and Ka in feedlot pen soils. Results showed that Ka and Kh could be simulated reasonable well using the standard models. However, some data showed the parameters did change as much as expected below temperatures of 15C. The very high ionic strength in the manure may alter the ammonium-ammonia equilibrium. Thus, Kh and Ka sub models that have been used it the literature to simulate NH3 losses from beef feedlots may not be correct at low temperatures (< 15C).
While using a mechanistic model has its advantages, there are many aspects of the beef feedlot system that suggest a simplistic top-down model may have adequate accuracy for approximating emissions and doing inventory calculations. This study and others are showing that about 50 to 60% of the fed nitrogen is lost to the atmosphere regardless of location (i.e., temperature) or manure management scheme (e.g., pen cleaning frequency). There is also remarkable consistency in feedlot diets and % crude protein across feedlots.
| Pen | Reported % CP | Analyzed % CP | Relative Diff |
|---|---|---|---|
| 1 | 13.7 | 12.7 | 0.08 |
| 2 | 13.7 | 13.4 | 0.02 |
| 3 | 13.2 | 13.2 | 0.00 |
| 4 | 13.2 | 13.3 | -0.01 |
| 5 | 13.9 | 14.3 | -0.03 |
| 6 | 13.2 | 13.6 | -0.03 |
| 7 | 13.2 | 14.0 | 0.06 |
| 8 | 13.9 | 14.2 | -0.02 |
| 9 | 13.9 | 14.2 | -0.02 |
| 10 | 14.6 | 14.1 | 0.03 |
| 11 | 13.2 | 14.0 | -0.06 |
| 12 | 13.2 | 13.2 | 0.00 |
As part of this project we measured the % crude protein (CP) in feed samples collected in the feed bunk and compared the results to the CP reported by the feedlot nutritionist or manager and found good agreement. Because most feedlots have excellent data on feed amounts, composition, and dry matter intake its follows that simply estimating fed nitrogen and assuming a 50 to 60 % is lost to the atmosphere is a very reasonable top down approach and is constrained by mass balance (i.e. the total feed nitrogen at the operation).
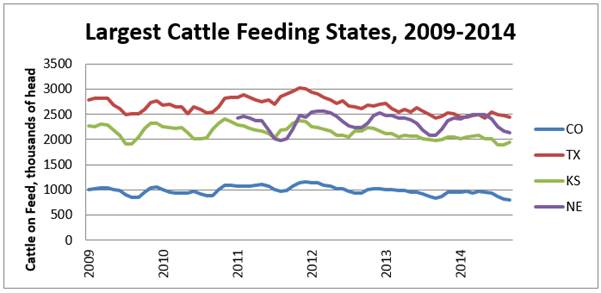
Figure 6. Cattle on feed data are readily available and provide a method for scaling up emissions to regional or national levels. Similar data are available for cattle weight and days on feed, all of which could be used to compose a simple top down algorithm for NH3 emissions based on fed or excreted nitrogen using industry standard diets information (e.g., 13.5% crude protein).
Using Nitrogen Isotopes to Track Feedlot Ammonia
The feedlot ammonia issue is under additional scrutiny in Colorado because atmospheric nitrogen deposition in Rocky Mountain National Park (RMNP) has been linked to livestock on the eastern plains. An isotope study was conducted to determine if different sources of ammonia along Front Range exhibit different levels of isotopic fractionation and thus could be used as source apportionment tool at deposition locations.
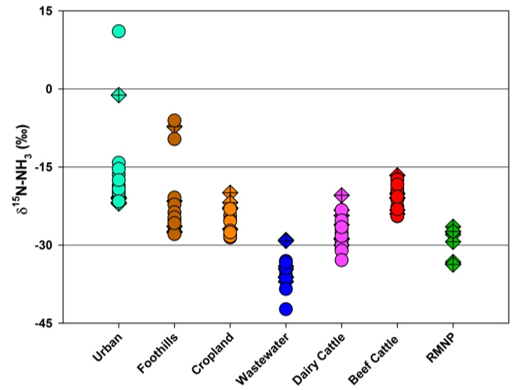
Figure 7. Data were collected at both livestock operations, crop land, wastewater treatment, urban, and within RMNP itself over the summer of 2011. The isotope data showed that most agricultural sources have very similar levels of fractionation; especially beef feedlots, dairies, and cropland (see figure below). In summary results show that isotopes might be useful for studying residence times in the atmosphere but likely will not be a practical way to trace/fingerprint the different sources of ammonia at the point of deposition.
Journal Articles on this Report : 2 Displayed | Download in RIS Format
| Other project views: | All 11 publications | 2 publications in selected types | All 2 journal articles |
|---|
| Type | Citation | ||
|---|---|---|---|
|
|
Galles K, Ham J, Westover E, Stratton J, Wagner J, Engle T, Bryant TC. Influence of reduced nitrogen diets on ammonia emissions from cattle feedlot pens. Atmosphere 2011;2(4):655-670. |
R834551 (2010) R834551 (2011) R834551 (Final) |
Exit Exit Exit |
|
|
Sun K, Tao L, Miller DJ, Zondlo MA, Shonkwiler KB, Nash C, Ham JM. Open-path eddy covariance measurements of ammonia fluxes from a beef cattle feedlot. Agricultural and Forest Meteorology 2015;213:193-202. |
R834551 (Final) |
Exit Exit Exit |
Progress and Final Reports:
Original AbstractThe perspectives, information and conclusions conveyed in research project abstracts, progress reports, final reports, journal abstracts and journal publications convey the viewpoints of the principal investigator and may not represent the views and policies of ORD and EPA. Conclusions drawn by the principal investigators have not been reviewed by the Agency.