
Grantee Research Project Results
2008 Progress Report: Innovative Management Options to Prevent Loss of Ecosystem Services Provided by Chinook Salmon in California: Overcoming the Effects of Climate Change
EPA Grant Number: R833017Title: Innovative Management Options to Prevent Loss of Ecosystem Services Provided by Chinook Salmon in California: Overcoming the Effects of Climate Change
Investigators: Moyle, Peter , Thompson, Lisa C , Purkey, David , Yates, David
Institution: University of California - Davis , Stockholm Environment Institute , National Center for Atmospheric Research
EPA Project Officer: Packard, Benjamin H
Project Period: October 1, 2007 through September 30, 2010 (Extended to September 30, 2011)
Project Period Covered by this Report: October 1, 2007 through September 30,2008
Project Amount: $722,963
RFA: Nonlinear Responses to Global Change in Linked Aquatic and Terrestrial Ecosystems and Effects of Multiple Factors on Terrestrial Ecosystems: A Joint Research Solicitation- EPA, DOE (2005) RFA Text | Recipients Lists
Research Category: Climate Change , Aquatic Ecosystems
Objective:
This is an interdisciplinary study to investigate the implications of climate change for spring-run Chinook salmon and terrestrial ecosystems adjacent to spawning grounds, based on modeled changes in water temperature and flow conditions. Chinook salmon are a keystone species that link aquatic and terrestrial ecosystems and support directly or indirectly many ecosystem services in California watersheds. Annual runs of Pacific salmon historically transferred large quantities of marine-derived nutrients into the California interior through the decay of salmon carcasses, supporting forests, terrestrial animals, and other aquatic species (Merz and Moyle 2006). The geographic focus of the study is Butte Creek, which was selected because of its critical role in plans for the protection of threatened spring-run Chinook populations and the apparent vulnerability of the system to climate change. This vulnerability stems from the fact that the low elevation headwater regions of Butte Creek and the West Branch Feather River from which water is transferred into the Butte Creek watershed, could potentially limit snow accumulation and melt which are important for the maintenance of suitable water temperature conditions for salmon. The complex set of non-linear interactions between habitat and ecosystems is being represented by coupling models of physical and biological processes. The integrated watershed hydrology, water management, and water quality model, WEAP (Water Evaluation and Planning System), is being applied to address: a) rainfall-runoff watershed processes, b) water supply, use, withdrawal, return flows, outflows, and reservoir operations; and c) water quality most notably water temperature in streams and reservoirs which will be a critical determinant of the presence of the cold water conditions required by salmonids. WEAP outputs of water temperature and streamflow are passed to the SALMOD model, which simulates the population dynamics of anadromous and resident freshwater salmonid populations under variable ecological conditions. To take advantage of and extract additional value from ongoing reconnaissance visits to Butte Creek, we added two additional project elements to quantify the Butte Creek salmon nutrient footprint (salmon-based food web). In 2007 and 2008, motion detector scouting cameras were installed to document the identify and activities of salmon consumers. In 2008, stable isotope analysis was performed on plant and animal tissues to document the relative proportion of marine derived nutrients supplied to the system by salmon. Results from these analyses will be used to refine and validate the conceptual salmon-based food web model and to document the relative contribution of marine-derived nutrients supplied by spring-run salmon to the productivity of the system. SALMOD results related to salmonid survival in Butte Creek under a range of future climate scenarios will provide information to an expert panel that will combine these results with information from food web and isotope analysis to assess the plausible implications of these results for terrestrial ecosystem services in the communities adjacent to spring-run spawning grounds. Using model runs which assume alternative water management arrangements, the expert panel will also comment on the potential utility of strategies designed to better manage cold water resources and to increase the resilience of the ecosystem in the face of climate change.
Our research objectives are formulated as a set of questions, first for the aquatic and then for the terrestrial system.
For the aquatic system:
- Could gradual climate change lead to abrupt change in the Butte Creek ecosystem through severe reduction or even extinction of its spring-run Chinook salmon population?
- If the spawning habitat of the spring-run were restricted to the upstream portion of the watershed, would salmon populations remain viable? How often would this restriction occur under climate change and what would this mean for the spawning spring run?
- In light of climate change and other stressors, how would suitable habitat for the salmon shift under the assumption that there were to be no management interventions (e.g. the “natural” watershed)?
- What management options are available to ameliorate climate change impacts on the spring-run Chinook, and at what cost to other ecosystem services (municipal and industrial water supplied, irrigated agriculture, hydropower, and recreation)?
For the terrestrial system:
- What would be the implications for the terrestrial ecosystem, particularly wildlife communities in the riparian corridor, if the spring-run Chinook salmon population were abruptly lost as the result of climate change?
- Are there longitudinal attributes of the riparian ecosystem of Butte Creek that make particular reaches more or less suitable for enhanced biodiversity with salmon present (e.g. are there local access restrictions due to physical landscape attributes such as extreme slopes)?
We have assembled a multidisciplinary team to answer these questions. Peter Moyle is a leading fish biologist in California, whose recent work includes a study of the Mokelumne River where he found riparian vegetation adjacent to spawning sites typically receive more than 20% of its foliar nitrogen (N) from marine sources and demonstrated that salmon support a wide variety of wildlife, key players in transferring nutrients inland (Merz and Moyle 2005). David Purkey has been part of developing an innovative water resource modeling tool to address freshwater ecosystem services of the heavily managed watersheds of California, and has garnered important credibility with relevant stakeholders throughout the proposed region (Yates et al. 2005 a,b,c; and Purkey et al. 2005). Lisa Thompson is an experienced population dynamics modeler of fisheries and lake ecosystems, and conducts studies of fish response to environmental factors such a flow and temperature in California Rivers. The team’s terrestrial ecosystem expertise is found in Melanie Allen Truan and Andrew Engilis. Dr. Truan has conducted research on the riparian ecosystems of Northern California since 1997, and is currently involved in collecting field data for the development of multitaxonomic biotic indicators for models of riparian structure and function. Mr. Engilis, curator of the UC Davis Museum of Wildlife & Fisheries Biology is an avian expert, with experience on how habitat affects bird populations and developing monitoring plans for terrestrial wildlife management.
Progress Summary:
Work on this project is progressing according to our original schedule of tasks. We have not encountered difficulties in carrying out the originally planned project, and at this point we do not foresee any difficulties in the future. The aims of the project have not changed from the original application.
Our tasks for the overall project fall into three categories:
A. Integrated Water Resource Modeling to determine habitat condition under current and future conditions
B. Population dynamics modeling to explore the ecological role of spring-run Chinook salmon in Butte Creek.
C. Convene an Expert panel on possible terrestrial ecosystem impacts; run alternative management scenarios with select stakeholders
In the first year of the project our tasks involved site surveys, data collection, database creation, and model development:
Task A- Butte Creek and Feather River Watershed Model
A1 – Refined delineation of all sub-catchments of Feather and Butte Creek; Described hydraulic and hydrologic infrastructure and water resource demands and operation; Collected weekly watershed scale climate data; Began model calibration for period 1960 to 2000.
Task B- Spring-run Chinook
B1 – Assembled existing fish and habitat data for Butte Creek.
B2 – Defined additional data gathering objectives through initial field site visits and discussions with California Department of Fish and Game (CDFG) biologists; Participated in CDFG field surveys to verify appropriateness of data for use in calibrating the SALMOD model.
B3 – Developed statistical relationships between observed fish occurrence within each meso-habitat unit and the habitat variables defined in those units; Developed a baseline SALMOD model of the Butte Creek spring-run Chinook life history.
Task C – Expert Panels
C1 – Began development of a site specific, conceptual model/food web diagram. Conducted literature review to prepare a target list of possible salmon consumers in the watershed; Deployed motion detector scouting cameras during the spawning season to identify salmon consumers present in the watershed; Collected plant and animal tissue samples, at different taxonomic, temporal and spatial scales, for stable isotope analysis to quantify the relative importance of spring-run Chinook salmon in transmitting marine derived nutrients to the riparian community.
Preliminary Results
Task A – WEAP Butte and Feather River Watershed Model
Conceptual framework
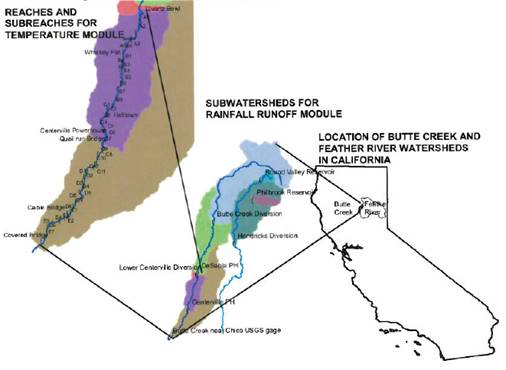
The conceptual framework of the model was based on the general approach for modeling rainfall-runoff, operations, and temperature using the WEAP software platform described below. Rainfall-runoff hydrology and operations of the tributary zone were modeled to represent the contributions from the West Branch of the Feather River (WBFR), Butte Creek, and the system of diversions and hydropower facilities. Stream temperature was modeled on the stretch of the river that holds habitat for spring-run Chinook salmon from Quartz Bowl to Covered Bridge (Fig. 1).
Figure 1. Location of Butte Creek watershed in California. Subwatersheds were defined upstream from management points, Reaches and subreaches were defined according to the California Department of Fish and Game delimitations.
We used the standard approach to building a WEAP rainfall-runoff model of a mountainous region as our point of departure. Rainfall-runoff processes were simulated by first dividing the watershed into sub-watersheds, which are the contributing areas above points of streamflow measurement or management control. Then, sub-watershed areas above “management points” were divided into elevation bands. Each sub-watershed/elevation band was then represented as a unique WEAP catchment object within which temporally variable land cover and temporally variable yet spatially homogeneous climatic conditions were imposed on a time step-by-time step basis. Land use and climate parameters were calibrated against unimpaired hydrology. Reservoirs, diversion canals, and hydropower facilities were overlaid on top of the rainfall-runoff module to represent the operations of the system. Validation runs were performed to observe the accuracy of the rainfall-runoff and operations in reproducing flows at the lowest gauge of the modeling domain (USGS Chico gage – 11390000).
For the stream temperature model, characterization of habitat types within 40 sub-reaches between Quartz Bowl and Covered Bridge was developed based on available cross-section and stage discharge data. Linear correlations between air temperature and water temperature were opted to represent the water temperature of the catchments. The coefficients of such correlations constituted parameters that were used for water temperature calibration.
The next subsections present a description of data acquisition, data processing, model development, calibration, and results obtained at the time of submitting this report.
Data acquisitions
Several sources were used to obtain data to implement the model. Catchments characterization was achieved using GIS data downloaded from several sources including the databases Seamless (http://seamless.usgs.gov/) to obtain a DEM with 10 m resolution, NLCD (http://www.mrlc.gov/zones/show_data.asp?szone=2) to obtain land cover data with 30 m resolution, SSURGO (http://www.ncgc.nrcs.usda.gov/products/datasets/ssurgo/index.html) to characterize soils, and CASIL (http://gis.ca.gov/BrowseCatalog.epl) for hydrolography information. Climate data including precipitation, temperature, and humidity for each catchment was obtained from Daymet (http://www.daymet.org/ Exit ). The Daymet data set (Thornton et al. 1997) was chosen for this application to provide climate data due to its spatial resolution (1 km grid) which is fine enough to provide resolved temperature and precipitation values for catchments that may be close in proximity but at very different elevations.
The ResSim model developed during the PG&E relicensing process was used to obtain estimated unimpaired streamflow time series at management points (PG&E 2007). This data was used to calibrate the rainfall-runoff module in the absence of measured unimpaired data during the modeling period. Also, the reservoir operation rules were obtained from ResSim and translated into WEAP operations logic. Measured streamflow and temperature records were obtained from CDEC and USGS databases and were used for model validation purposes. Data of 14 cross sections to characterize habitat units within the 40 subreaches was provided by Mark Gard, USFWS (Gard 2003).
Additional sources used to gather data included reports from California Fish and Game on the life history of spring-run Chinook salmon (CDFG 1998-2005) to obtain reaches lengths and pools temperature data, and the on-line resources available from the PG&E DeSabla-Centerville Hydroelectric Project relicensing process.
Data processing
GIS layers were processed using ArcMap for the delineation of subwatersheds and catchments. A total of eight subwatersheds were defined by management points such as gauges, diversion canals outflows and inflows, and dams. A total of 33 catchments were obtained by intersecting elevation bands with each subwatershed (i.e. 0-500 m, and every 250 m from there on). Soils were classified as shallow (<50 cm) and deep (>50 cm) and vegetation was classified as grass, shrubs, trees, and urban. Although there are bare and agriculture land covers in the watershed as well, these represent a small percentage of the area and were grouped into other land cover classes for simplification purposes that improve model running times. Catchments, soils, and vegetation were intersected to calculate areas of land classes with deep and shallow soil for each catchment. Daily Daymet climate data, gage data, and temperature data were processed to obtain weekly average time series for the modeling period. Stage-discharge data was processed to obtain width values associated with each stage value using the WinXSPro software developed by USDA Forest Service (Hardy et al. 2005).
Model Development: Rainfall-Runoff Hydrology and Operations
Rainfall-Runoff Module and Operations Implementation
GIS layers were brought to the WEAP platform to guide the model construction. Catchment objects were placed at their respective locations. Areas, land cover proportion, and climate data were input for each catchment for its final representation within WEAP. Key assumptions were used to introduce land use and snow parameters that were adjusted during calibration. The calibration period for the rainfall-runoff module was defined from water years 1986-1999 which is a period when unimpaired streamflow estimates and Daymet data coincide. Validation runs were performed in between 1981-2006 using measured gage data at the USGS Chico gage (11390000), which includes the operations of the hydropower facilities.
For the operations module in WEAP, reservoirs, diversions, and powerhouses elements were created. Each element was associated with its corresponding operations logic, translated from the ResSim model. This logic included minimum flow requirements, volume elevation curves, operation rules, and hydropower capacity.
The final land cover classification, and land cover and climate parameters are presented in Tables 2 and 3.
Rainfall-Runoff and Operations Modules Results
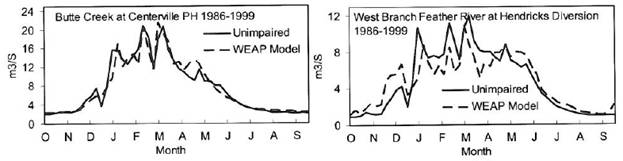
The most updated version of the WEAP schematic includes operations elements and sub-reach delimitation (Figs. 2 and 3). An analysis of streamflow results was performed for the calibration period of the model without operations by comparing modeled vs unimpaired hydrology at selected locations in Butte Creek and WBFR (Fig. 4). Validation runs with operations where broken down into three periods 1981-1985 (period before calibration run), 1986-1999 (period coinciding with calibration run), and 1999-2003 (period after calibration run). These runs were used to observe model performance comparing results of the model with actual measured data at the Chico gage (Fig. 5).
Table 2. Land cover classification.
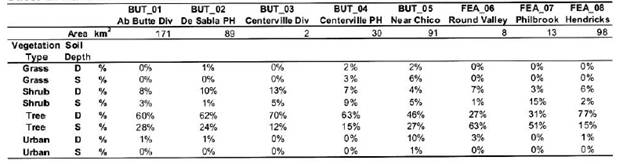
Table 3. Current set of parameters used in the WEAP Butte Creek model
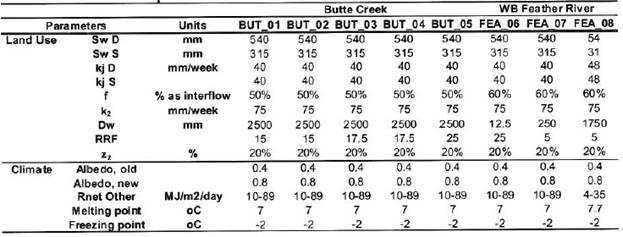
Figure 2. Schematic view of the WEAP model for Butte Creek. Red lines represent subwatersheds, black lines represent catchment boundaries, blue lines represent rivers, orange lines represent diversions, green dots are catchments, and blue dots are gauges.
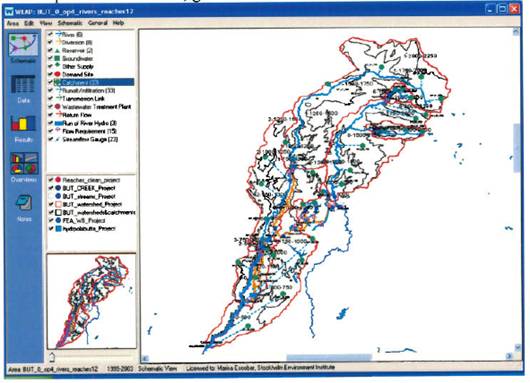
Figure 3. Data view of WEAP model for Butte Creek. Key assumptions include parameters and demand sites include catchments and their respective land use and soil types.
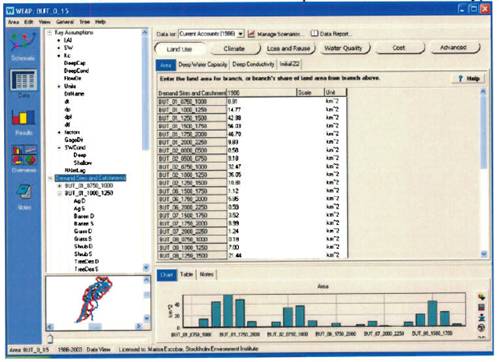
Figure 4. Model results of unimpaired hydrology in Butte Creek after the inflow from Centerville Power House and at the WBFR before the Hendricks Diversion.
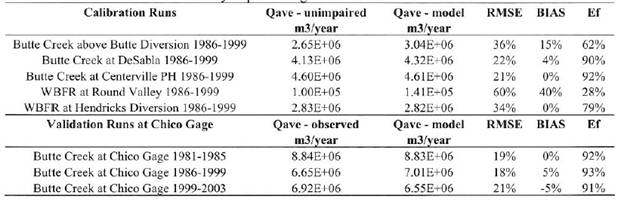
The accuracy of the model at predicting stream flow was assessed by calculating root-mean-square-error (RMSE), bias, and Nash-Sutcliffe efficiency statistics for weekly stream flow at selected management points in the watershed (Table 4). Unimpaired RMSE values ranged from 22% at Butte Creek at DeSabla to 60% at the location of Round Valley reservoir in the WBFR. Bias values ranged from 0 to 40%, and efficiency values ranged from 28% to 90%. The lowest model performance occurred at the exit of Round Valley reservoir, which represents the hydrology of a small subwatershed at the headwaters of the WBFR. Such low performance can be attributed to the uncertainties that come from the coarse representation of this subwatershed that may present hydrologic processes associated with its smaller area and its shape that are not captured by the watershed characterization and parameters selected. Also, there is uncertainty associated with the unimpaired flows that were reconstructed based on assumptions about flow partitioning from measured values which may contribute to the low performance of the model in some calibration points.
Figure 5. Model results of hydrology including operations at the Chico gage location for 1981-1985, 1986-1999, and 1999-2003.

The overall accuracy of model as estimated by the statistics obtained comparing model vs observed data at Chico gage constitute a more reliable comparison given the lower uncertainty associated with measured data as compared to the uncertainty of estimated unimpaired flows. Results of the three validation runs at Chico gage indicate that both hydrology and operations were well represented by the model, with a RMSE, BIAS, and Efficiency close and some times better than the best unimpaired hydrology calibration run results (Table 4).
Table 4. Statistics of model accuracy at predicting stream flow.
Further refinement of the operations logic will be achieved in a next stage of the model development from the observation of the correspondence between modeled and measured hydropower production at the DeSabla-Centerville project facilities. Validation for an earlier period will not be attempted since the high resolution (1km) Daymet climate data is only available starting in 1980.
Model Development: Water Quality
Water Quality Module Implementation
The implementation of the water temperature module required the definition of reaches, the development of stage-discharge-width relations, and the development of an approach for estimating water temperature at the catchment level. A preliminary calibration of the model was initiated by comparing model data with actual continuous temperature at the USGS Chico gage between 1999-2003 and summer temperature measured by the California Department of Fish and Game a selected pools in the modeling domain in the summers between 2001-2003.
Considering the habitat characterization developed during the DeSabla-Centerville relicensing process, the research team agreed upon characterizing each of the 40 sub-reaches into three habitat types, namely pool, flatwater (or run), and pools. Within WEAP, each subreach was delimited to represent the three habitat types so that each would represent a portion of the subreach proportional to the habitat unit weighting reported in the PG&E relicensing documents (i.e. habitat unit length=reach length*normalized habitat unit weighting) (PG&E 2007) (Table 5). The data reported in Guard (2003) was processed to obtain width values associated with stage-discharge relations using the WinXS Pro routine (Hardy et al. 2005) given that stage-discharge-width relations are required for physical characterization of habitat types in WEAP.
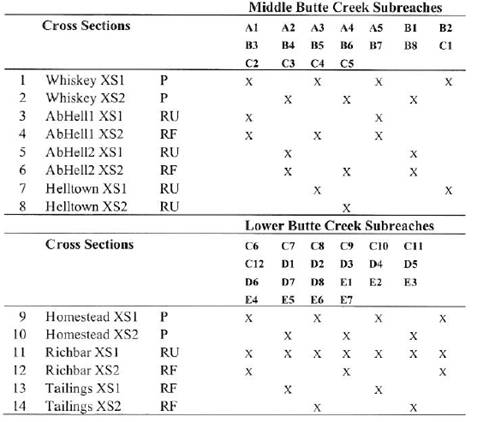
Existent cross section data was associated with each of the modeling domain reaches according to the location of the site (Table 5). Also, the 14 cross sections were characterized as pool, run or riffle, and assigned to each of the habitat types within the subreaches. The assignation of cross sections to each habitat type within the subreaches was done in a sequential fashion (Table 6), however a different assignation procedure will be considered in case it is identified that such assignation may have an effect on the overall performance of the model. At the time of writing this report, the habitat unit assignation within WEAP was implemented in Reach A to perform test runs and observe model behavior. The implementation of Reaches B-E will be a task fulfilled within the first quarter of the second year of the project.
Table 5. Reaches definition and localization of existent cross section data.
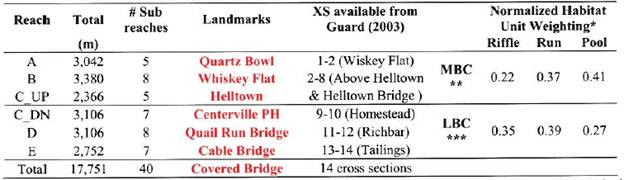
* From DeSabla-Centerville Relicensing Habitat Mapping (Section 6.3.2.6.1) (PG&E 2007), ** Middle Butte Creek, *** Lower Butte Creek.
Table 6. Assignation of cross sections for habitat units within Butte Creek subreaches. P stand for pool, RU stands for run, and RF stands for riffle.
In addition to the characterization of the reaches from Quartz Bowl to Covered Bridge, an approach to characterize the temperature of all the catchments was developed based on air-water temperature correlations. The closest meteorological station with observed air temperature data identified was the Cohasset station. Air temperature data at this site was correlated with water temperature of the furthest upstream pool of the modeling domain located at Quartz Bowl. The expression used to characterize the temperature of the catchments was:
If(PrevTSValue(Temperature[C],1,Key\TempLag,1)<0,0,b+m*PrevTSValue(Temperature[C],1,Key\TempLag,1))
Where:
M is the slope of the correlation between air and water temperature,
b is the coefficient of the linear correlation between air and water temperature, and
TempLag is the parameter representing the memory of the water temperature with respect to the air temperature, estimated with a moving average of the water temperature.
Water Quality Module Results
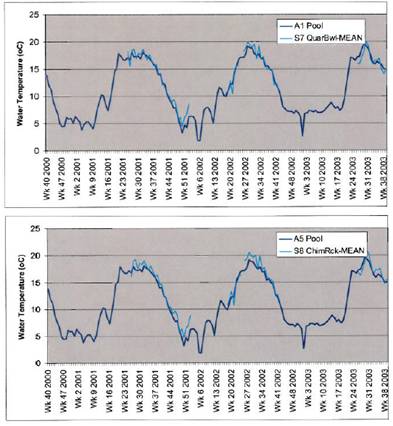
Using the temperature parameters of time lag between air and water temperature and linear correlation coefficients a preliminary calibration process was advanced. Combinations of the parameters were explored to identify the best fit of model results to observed data (Fig.6). A visual comparison using the parameters time lag=2, coefficient = 5, slope = 0.5, indicate a good correspondence between modeled and measured weekly average temperature data at pools A1 and A4.
Figure 6. Correlations between air and water temperature data. Different time lags of water temperature with respect to air temperature were calculated.
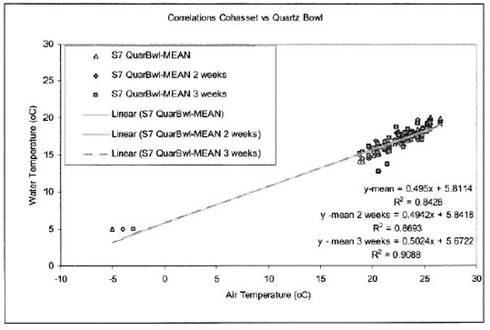
Figure 7. Modeled (dark blue) vs pool temperature data measured by the California Department of Fish and Game in Quartz Bowl and Chimney Rock.
An integration test between WEAP streamflow and temperature outputs and SALMOD was performed with the data obtained from the WEAP test runs for Reach A (see Task B Results – SALMOD Modeling section for details). The conclusion of the test was that WEAP outputs are readily available for SALMOD use and that there are no conflicts regarding SALMOD format requirements. Future work on the temperature module implementation will be to implement the model down to reach E. Modeled vs observed temperature data at specific locations among the hydropower installations will need to be checked to verify the capacity of the model to capture essential water temperature features of the system, such as the increase in temperature in Butte Creek between the outflow and inflow of the Centerville Diversion. Statistics of the temperature results will also be calculated.
Task B Results – SALMOD Modeling
Data acquisition
We assembled data on Chinook salmon and habitat from a variety of sources (Task B1). We relied on California Department of Fish and Game reports on Butte Creek spring-run Chinook for local data on habitat types, Chinook population sizes, life stages, instream distribution and movement, size-at-age, red size, and life history timing (CDFG 1998, Hill and Webber 1999, Ward and McReynolds 2004, Ward et al. 2004a, 2004b, 2004c, 2004d, Guignard 2005, McReynolds et al. 2005). We obtained literature values for relationships such as temperature-dependent growth and mortality, female weight-to-egg ratios, and temperature-dependent spawning timing (Crisp 1981, Clarke and Shelbourn 1985, McCullough 1999, Beer and Anderson 2001, Myrick and Cech 2001, Kimmerer et al. 2005, Bartholow and Heasley 2006, Jasper and Evenson 2006). We used data from the Pacific Gas and Electric studies conducted on Butte Creek for the recent FERC relicensing of the Butte Creek hydropower project Desabla-Centerville Project (PG&E 2007; FERC Project No. 803, license application submitted Oct. 1, 2007) to develp fish-habitat relationships for weighted usable area versus flow, based on habitat type and life stage. Water temperature and flow inputs were obtained from WEAP model runs.
Field surveys of Butte Creek spring-run Chinook salmon and habitat
We joined CDFG field crews on three separate field surveys, in 2006 and 2008, enabling us to verify habitat types and observe sampling techniques for both the upper (pool-dominated) and lower (riffle-dominated) zones of Butte Creek (Task B2). We have also had numerous discussion with CDFG field and supervisory staff regarding habitat types, data for weighted usable area curves, observations of terrestrial animals, and field sampling methods. At this point additional data gathering appears to be unnecessary for us to construct the basic SALMOD model. However, potential enhancements of the model, such as the addition of an ocean survival component, may require additional data gathering in the future.
Data processing
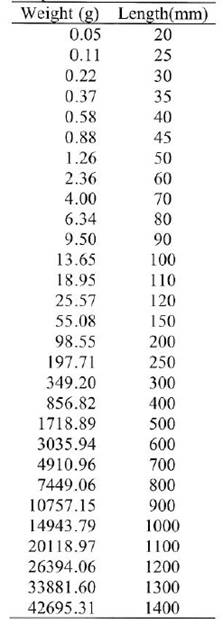
Data and relationships were used to prepare multiple SALMOD input files, and to develop a baseline SALMOD model of the Butte Creek spring-run Chinook life history (Task B3). Population type and years of model run were defined in Control.dat. We defined spring-run Chinook salmon life stages and size-at-age in Species.dat. We defined the number of computational units, habitat types, and the size of the flow and temperature data arrays based on the same reach definitions and habitat types developed for WEAP (stream.dat). Relationships for temperature-growth, base mortality, temperature-mortality, density-dependent mortality, weight-length relationship (Table 7), and female weight to egg ratio relationships were also defined (relation.dat). Values for seasonal movement and associated mortality are still being addressed and will be refined after consultation with CDFG staff. Spawning times, the spawning-temperature relationship, redd size, and egg size were obtained (spawn.dat). We developed test data to add fish to given reaches in model trials (spplment.dat). Weekly flow data for each subreach and habitat type for the duration of the model run were formatted from trial run WEAP outputs (flow.dat). Similarly, weekly temperature data were formatted (temp.dat).
Table 7. Weight – length relationship for Chinook salmon used in relation.dat input file. Values for fish 20-150 mm from Kimmerer et al. (2005). Values for fish 200 – 1500 mm from Alaska Department of Fish and Game (Jasper and Evenson 2006).
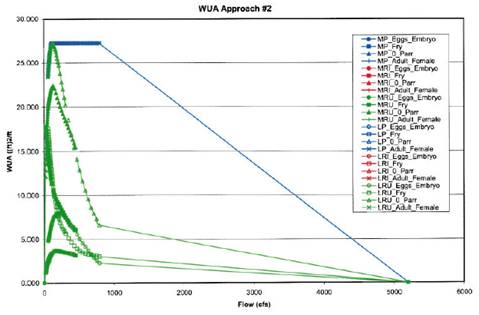
We defined curves for weighted usable area versus flow, for each habitat type and life stage (wua.dat). Based on the data available (PG&E 2007) we developed two sets of curves, following two different approaches. During the FERC re-licensing data were collected for habitat in Middle Butte (Reaches A, B, and upper half of C) and Lower Butte (lower half of reach C, plus reaches D and E). Sampling covered a representative distribution of pool, run, and riffle habitat, averaged within each major habitat area (Middle Butte or Lower Butte). Approach #1 relies on the fact that Middle Butte is pool-dominated, while Lower Butte is riffle-dominated. Middle Butte curves are used to represent pool habitat in all reaches, while Lower Butte curves represent riffle habitat throughout the creek (Fig. 8). Weighted usable area for run habitat is the average of pool and riffle values. Approach #2 employs Middle Butte curves for all Middle Butte sub-reaches, and Lower Butte curves for all Lower Butte sub-reaches, with no distinction between pool, riffle, and run habitat types (Fig. 9). For both approaches we developed weighted usable area curves for adult (summer holding) salmon using optimal curves for pool habitat, and curves with the lowest suitability for runs and pools, based on the widely observed preference of holding adult spring-run Chinook for pool habitat (Wampler 1991, Torgersen et al. 1999, Ward et al. 2006).
Figure 8. Weighted usable area curves using Approach #1, for Eggs/Spawners, Fry, 0+Parr/1+Parr, and Adults, for pool (P), riffle (RI), and run (RU) habitat types.
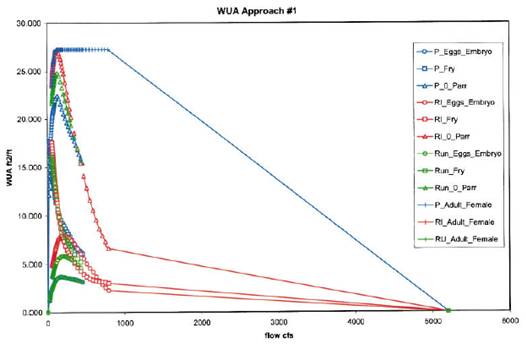
Figure 9. Weighted usable area curves using Approach #2, for Eggs/Spawners, Fry, 0+Parr/1+Parr, and Adults, for pool (P), riffle (RI), and run (RU) habitat types. M designates habitat types in the Middle Butte section, and L designates habitat types in the Lower Butte section.
SALMOD modifications
We altered the code in two of the FORTRAN files (tempio.for and flowio.for) underlying SALMOD to allow us to provide more detailed temperature and flow inputs from WEAP to SALMOD, in collaboration with SALMOD developer Mr. John Heasley (USGS). The normal SALMOD configuration allows temperature and flow inputs for a maximum of 15 habitat units, although up to 1,000 habitat units can be modeled (e.g., for weighted usable area). SALMOD interpolates the missing temperature and flow data for habitat units without inputs. However, WEAP will provide temperature and flow estimates for each of our 120 habitat units at each time step. We can now use up to 1,000 temperature and flow inputs, greatly enhancing the spatial resolution of the input data provided to SALMOD. We also upgraded to SALMOD version 3.80, provided by Mr. Heasley, but not currently available on the USGS web site.
Preliminary model results
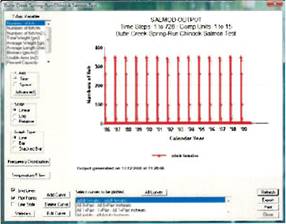
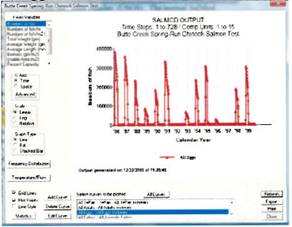
We performed initial runs of the baseline SALMOD model using the trial run WEAP data for flow and temperature. Results from these SALMOD model runs indicate that local and literature-derived life history parameter estimates lie within a realistic range and work well with the flow and thermal regime parameters of Butte Creek given the preliminary WEAP data set (Figure 10).
Figure 10. Model outputs for (A) female spawners, (B) juvenile outmigrants (exiterS), and (C) eggs are predicted by SALMOD for Reach A simulated using WEAP outputs.
A) Female spawners.
B) Juvenile outmigrants (exiters).
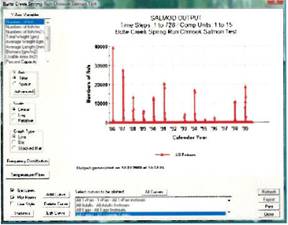
C) Eggs.
Next we will focus on calibration of the SALMOD model to test its accuracy in predicting juvenile outmigrant numbers based on inputs of historical data for spawner numbers, temperature, and flow. We will then make any modifications necessary to better reflect the life cycle of spring-run Chinook in Butte Creek (Year 2, Task B3), in preparation for running data from WEAP model scenarios for current and future climate conditions (Year 2, Task B4).
Task C Results – Development of a Conceptual Model/Food Web of Chinook Salmon Subsidies to the Terrestrial Ecosystem
Data acquisition
We assembled data on the possible identity of Chinook salmon consumers and food web elements in the Butte Creek watershed from a variety of sources (Task B1), including California Department of Fish and Game reports, peer-reviewed literature, and the Pacific Gas and Electric studies conducted on Butte Creek for the recent FERC relicensing of the Butte Creek hydropower project Desabla-Centerville Project.
Field survey of salmon carcass use
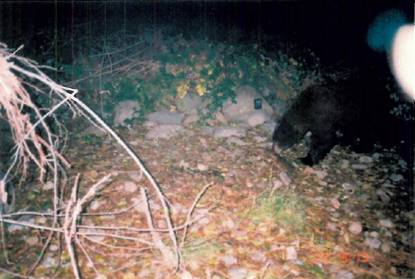
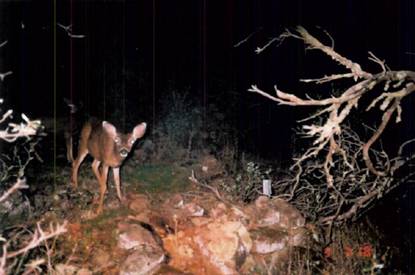
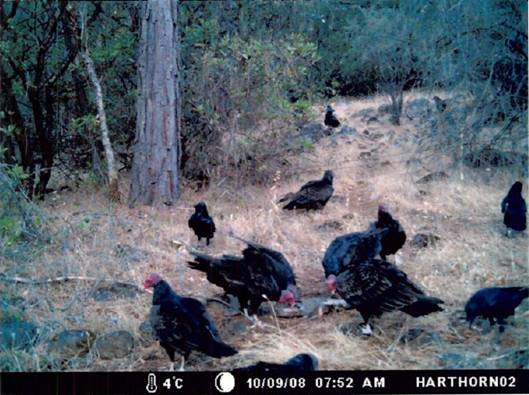
Motion detector scouting cameras were deployed at carcass bait stations to photograph salmon consumers and other organisms coming to bait stations. We deployed cameras during the spawning season (October-November 2007 and 2008) in subreach C2 at three different stations located at varying distances from the channel. Station locations were selected based on evidence of wildlife use (i.e. along trails, evidence of prior feeding, etc.). Vertebrate species photographed near carcasses included: black bear, common raven, mule deer, raccoon, ringtail, striped skunk, and turkey vulture (Fig. 11). These preliminary results confirmed the presence of certain candidate salmon consumers in the region, established the resource value of salmon carcasses to the ecosystem, and provided valuable insights into how to further improve field protocols and mechanisms underlying food web relationships.
Presence of marine-derived nutrients in the ecosystem, stable isotope analysis
We collected plant and animal tissues (leaves, hair, feathers) to assess the proportion of marine-derived stable isotopes of nitrogen (15N) in the terrestrial ecosystem adjacent to spawning and non-spawning reaches. Plant samples were collected from both nitrogen-fixing plants (Alnus rhombifolia) and non-nitrogen fixers (Salix spp., Vitis californica, Quercus wislizenii, Heteromeles arbutifolia, and Darmera peltata). Samples were collected for two temporal periods, pre- and post-spawning, at various sites in subreach C2, as well as at a site upstream of barriers to salmon migration (Forks of the Butte). Animal tissues (bear fur, turkey vulture feathers) were collected opportunistically. No animals were handled during the course of the study.
Figure 11. Terrestrial wildlife photographed at salmon carcass bait stations by motion detector scouting cameras.
A) Black bear consuming a spring-run Chinook salmon carcass on Butte Creek.
B) Mule deer.
C) Raccoons.
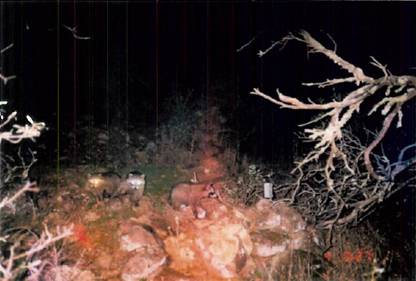
D) Ringtail.
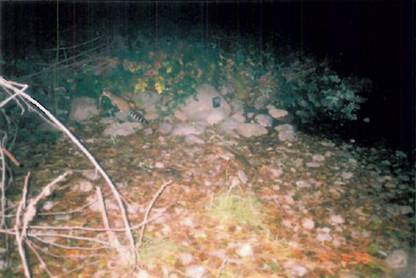
E) Striped skunk.
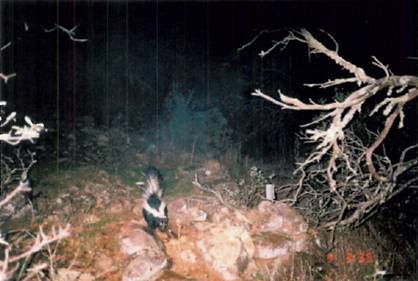
F) Turkey vultures.
Future Activities:
In the second year of this project we will conduct model calibration and validation, generate climate change scenarios, run SALMOD using WEAP simulation output, run stable isotope analyses, develop the conceptual food web model, and present our results to the Expert Panel.
Task A – WEAP Butte and Feather Watershed Model
A1 – Refine water quantity and quality simulations of Butte and Feather systems, including stream and reservoir simulations of water quantity and temperature. Meso-habitat defined in Task B will used as the channel reaches for WEAP model of Butte Creek. Refine water management operations in system to be sure water is being appropriately allocated and reflects hydrologic realities.
A2 – Begin assembling climate change scenarios which will be downscaled to the sub-catchments and aggregated to a weekly time step. We will also apply the California Climate Change Center’s scenarios (http://meteora.ucsd.edu/cap/cccc_model.html), which are already downscaled to the sub-catchment level.
Task B – Spring Run Chinook
B3 – Based on lessons learned from statistical analysis of fish and habitat data, evaluate the appropriateness of SALMOD relationships for spring-run Chinook in Butte Creek. Where appropriate, modify SALMOD to reflect appropriate bio-dynamics; run and evaluate model simulations of spring-run Chinook populations.
B4 – Begin to extract flow and water temperature data from WEAP simulations of current and future conditions, and pass them to the SALMOD model for simulating population dynamics.
Task C – Conceptual Model/Food Web
Analyze plant and animal tissue samples for marine-derived nutrient (15N) content. Finalize draft conceptual model of impacts of climate change to salmon and salmon nutrient footprint (food web diagram). Hold meeting of Expert Panel to review the results of all modeling to improve predictions of impacts of salmon extirpation on the terrestrial ecosystems and formulate recommendations for model testing.
References:
Journal Articles:
No journal articles submitted with this report: View all 26 publications for this projectProgress and Final Reports:
Original AbstractThe perspectives, information and conclusions conveyed in research project abstracts, progress reports, final reports, journal abstracts and journal publications convey the viewpoints of the principal investigator and may not represent the views and policies of ORD and EPA. Conclusions drawn by the principal investigators have not been reviewed by the Agency.