
Grantee Research Project Results
Final Report: Constructing Probability Surfaces of Ecological Changes in Coastal Aquatic Systems Through Retrospective Analysis of Phragmites Australis Invasion and Expansion
EPA Grant Number: R832440Title: Constructing Probability Surfaces of Ecological Changes in Coastal Aquatic Systems Through Retrospective Analysis of Phragmites Australis Invasion and Expansion
Investigators: Wardrop, Denice Heller , Whigham, Dennis F. , Patil, G. P. , Taillie, C. , King, Ryan , Easterling, Mary M.
Institution: Pennsylvania State University , Smithsonian Environmental Research Center , Virginia Institute of Marine Science
EPA Project Officer: Packard, Benjamin H
Project Period: July 1, 2005 through June 30, 2007
Project Amount: $299,995
RFA: Exploratory Research: Understanding Ecological Thresholds In Aquatic Systems Through Retrospective Analysis (2004) RFA Text | Recipients Lists
Research Category: Aquatic Ecosystems , Water
Objective:
- Choose an aquatic ecosystem with clearly identifiable alternative states, and define a limited number of variables that are considered to be the driving factors in state changes.
- Establish the database of explanatory and response variables over both a spatial and temporal extent. A retrospective analysis is the most powerful if performed over a truly temporal extent, instead of a space for time experimental design.
- Construct a probability surface of state change over the n-dimensional space of selected explanatory variables.
- Describe thresholds in terms of the probability surface.
- Test the threshold surface with data from a second location.
- Model the potential for state change under three proposed futures scenarios for the system of interest.

Summary/Accomplishments (Outputs/Outcomes):
Conceptual Model Development and Variable Selection
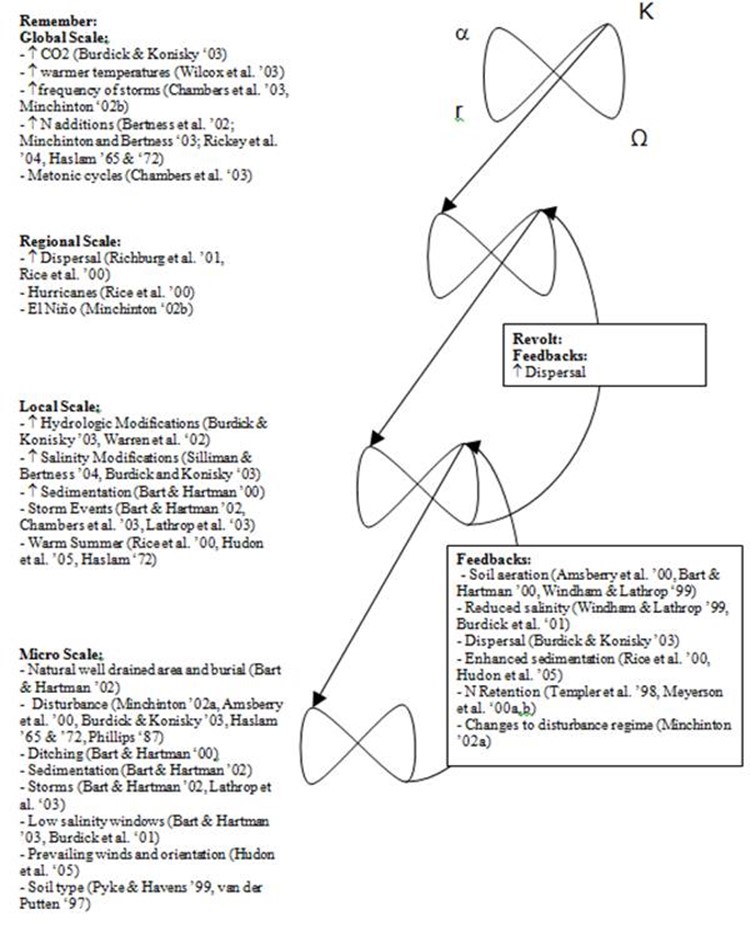
Figure 2. Conceptual model of significant variables in Phragmites invasion.
Documenting Historical Changes in Potential Driving Variables
Availability of Historical Data
Historical Patterns of Potential Driving Variables
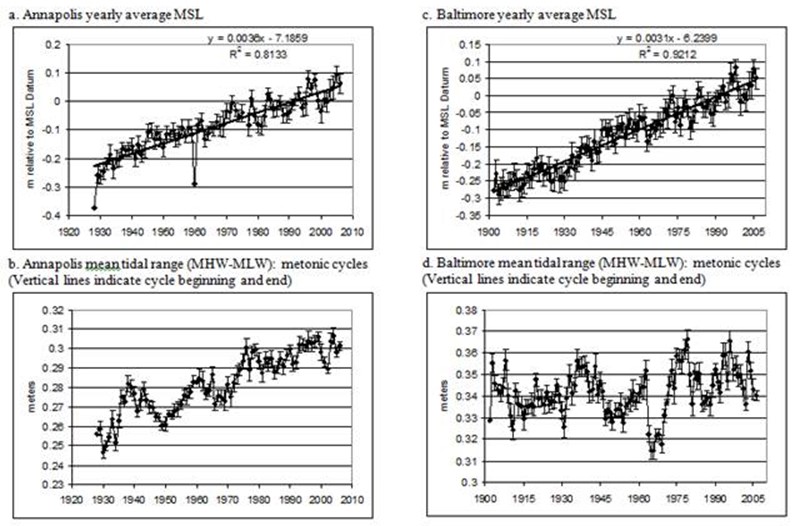
Figure 3. Yearly average water level data with standard error bars for Annapolis and Baltimore.
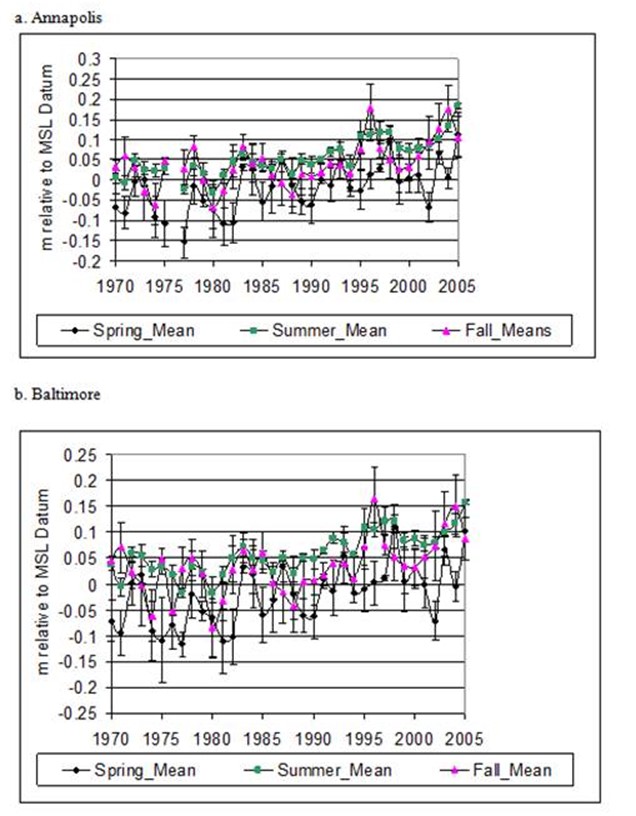
Figure 4. Sesonal water level means by year with standard error bars for Annapolis (top) and Baltimore (bottom).
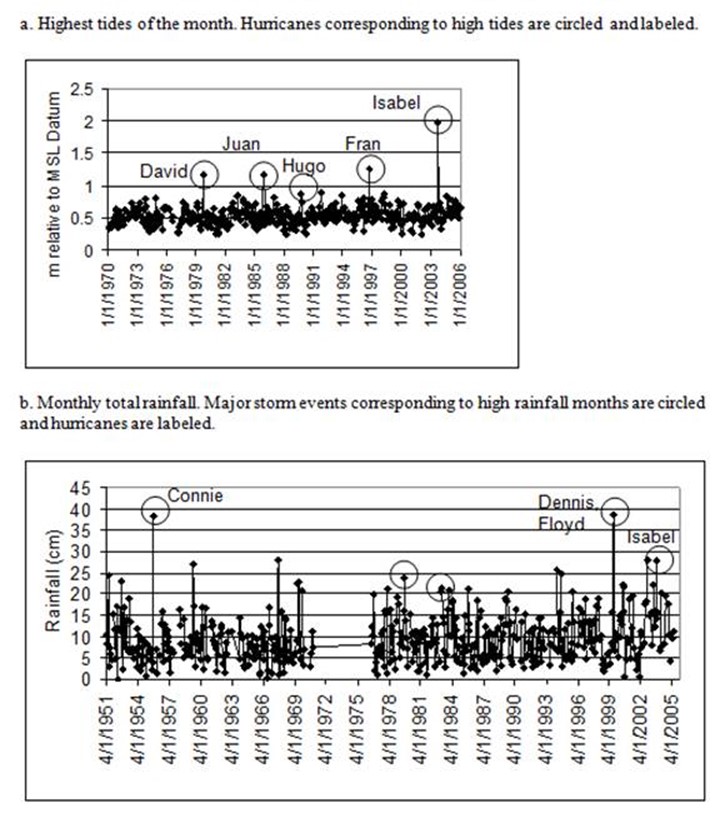
Figure 5. Annapolis tital and precipitation data used to determine extreme weather events.
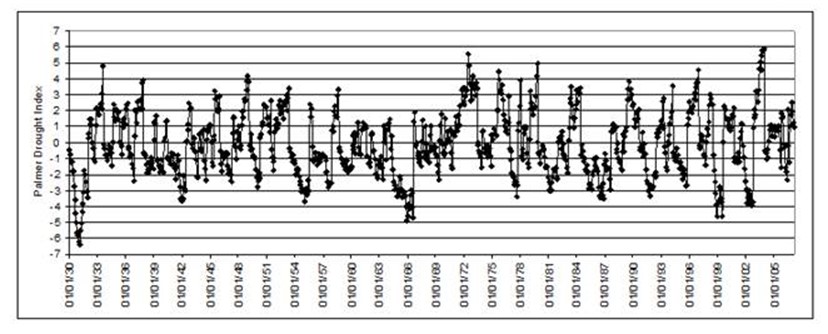
Figure 6. Maryland monthly Palmer Drought Severity Index scores, 1930-2007. Negative numbers indicate dry spells; positive numbers indicate
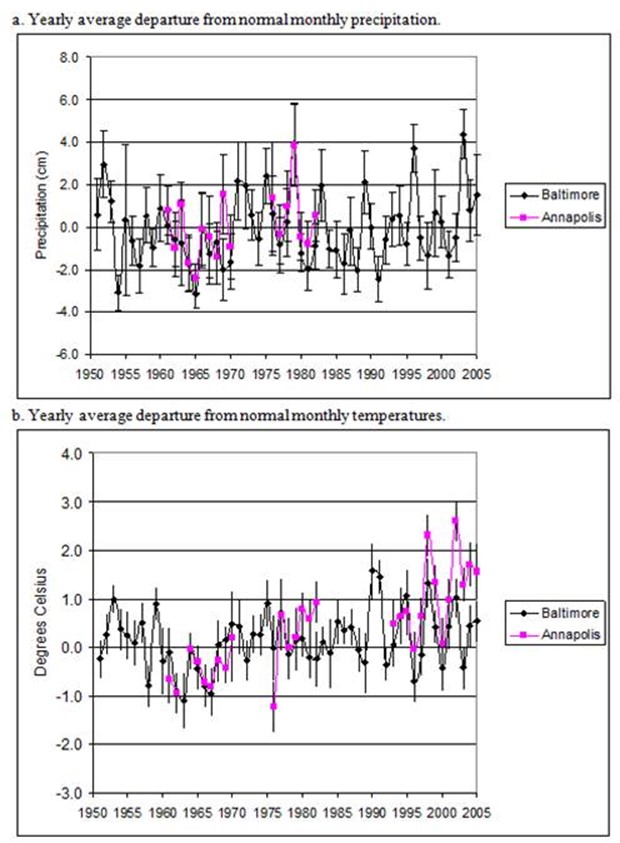
Figure 7. Yearly averages with standard error bars of monthly departures from normal precipitation and
temperature for Annapolis and Baltimore.
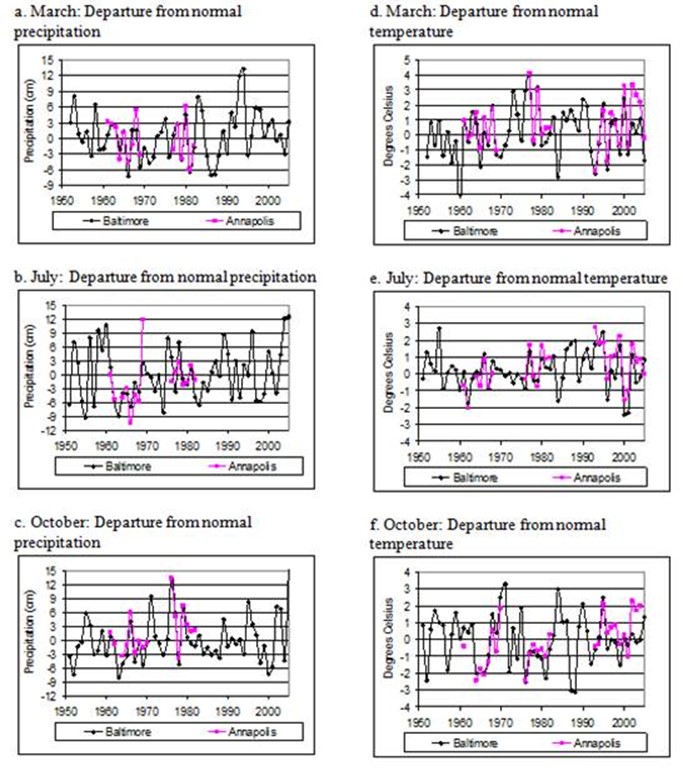
Figure 8. Annapolis adn Baltimore departures from normal precipitation in March (a), July (b), and October (c)
and temperature in March (d), July (e), and October (f).
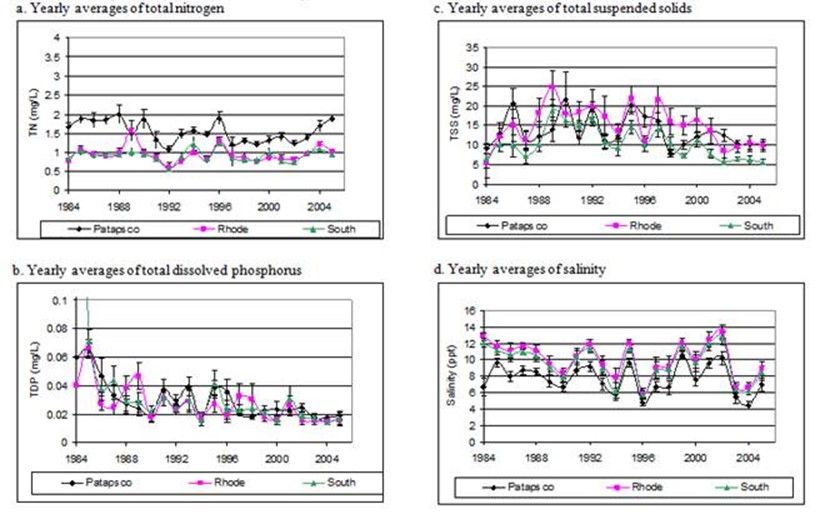
Figure 9. Yearly averages with standard error bars of montly samples of total nitrogen, dissolved phosphorous, total suspended solids and
salinity in the Rhode, South, and Patapsco Rivers.
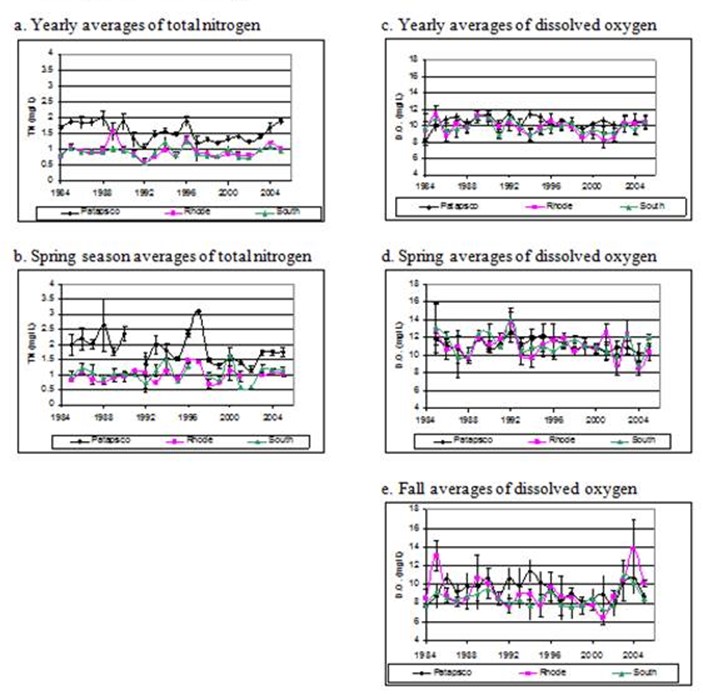
Figure 10. Comparisons of poorly corre3lated yearly averages and yearly seasosnal averages of total nitrogen and dissolved
oxygen.
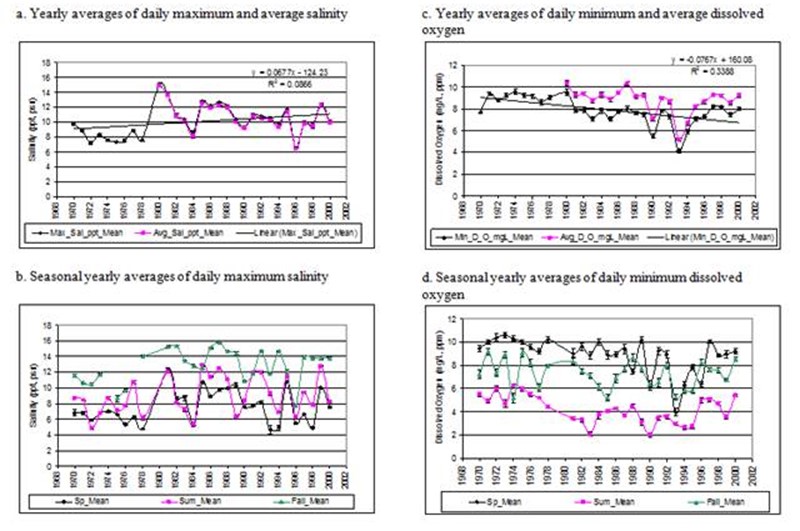
Figure 11. Salinity and dissolved oxygen data collected by SERC at a monitoring station on the Rhode River.

Figure 12. Discharge loads of total nitrogen from point sources in each
subestuary. Note differences in y-axis scales.
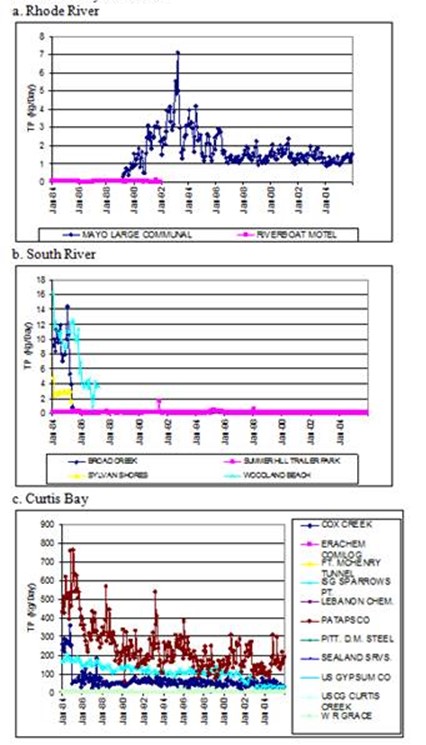
Figure 13. Discharge loads of total phosphorous from point sources
in each subestuary. Note differences in y-axis scales.
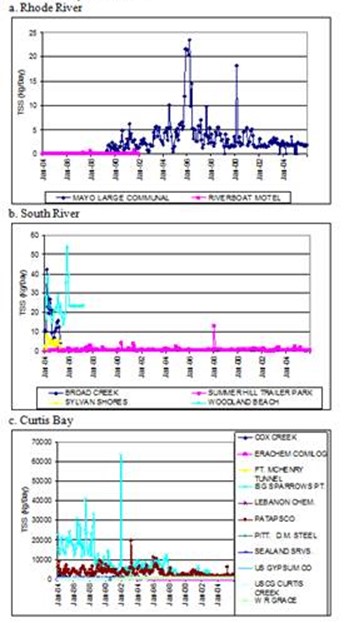
Figure 14. Discharge loads of total suspended solids from
point sources in each subestuary. Note differences in y-scale axis.
Reconstructing Historical Land Cover, Road Networks, and Shoreline Structures
| Year | Rhode River | South River | Curtus Bay |
|---|---|---|---|
| 1943 | N/A | Incomplete | Complete |
| 1952 | Incomplete | Incomplete | Complete |
| 1957 | Complete | Complete | Complete |
| 1962/3 | Complete | Complete | Incomplete |
| 1970 | Complete | Complete | Incomplete |
| 1977 | Complete | Incomplete | Complete |
| 1980 | Inomplete | Incomplete | Incomplete |
| 1984 | Complete | Complete | Complete |
| 1988 | Incomplete | Incomplete | Incomplete |
| 1990 | Complete | Complete | Complete |
| 1995 | Complete | Complete | Complete |
| 1998 | Complete (digital) | Complete (digital) | Complete (digital) |
| 2000 | Complete (digital) | Complete (digital) | Complete (digital) |
| 2002 | Complete (digital) | Complete (digital) | Complete (digital) |
| 2005 | Complete (digital) | Complete (digital) | Complete (digital) |
Each digital raster image was georeferenced to describe the specific geographic location of the image. Mapping software (ESRI ArcGIS 9.2) was used to complete the georeferencing. A base layer of current aerial imagery was used to compare the location of the scanned aerial image to a layer that already had geographic location information. Control points were added (usually fourone in each general corner region of the scanned image), matching road intersections or buildings. The scanned image was then transformed or warped to match the base image and this warping information was permanently saved with the scanned image. This transformation generally includes some discrepancy in matching to the base layer and so produces a residual error. The root mean square error (RMS error) was calculated to total the error for all of the control points related to the transformation of one image. The RMS error calculated for the images georeferenced for this project ranged from 2.02 to 17.04 with and average RMS error of 7.12.
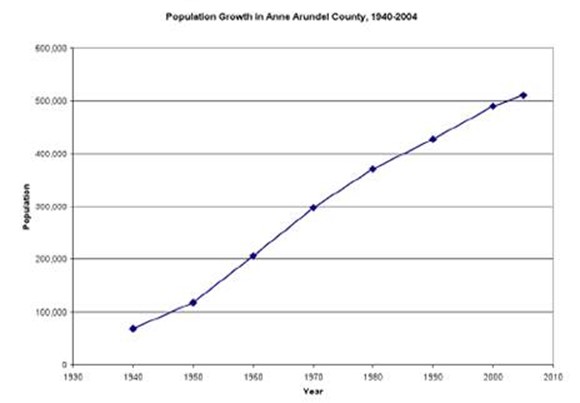
Figure 15. Population growth in Anne Arundel County.
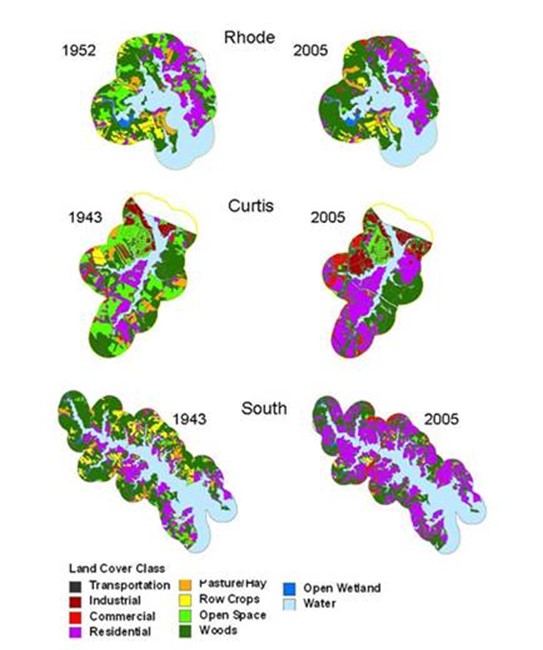
Figure 16. Land cover in 1943/1952 and 2005 in the three subestuaries of Anne Arundel Co., Md.
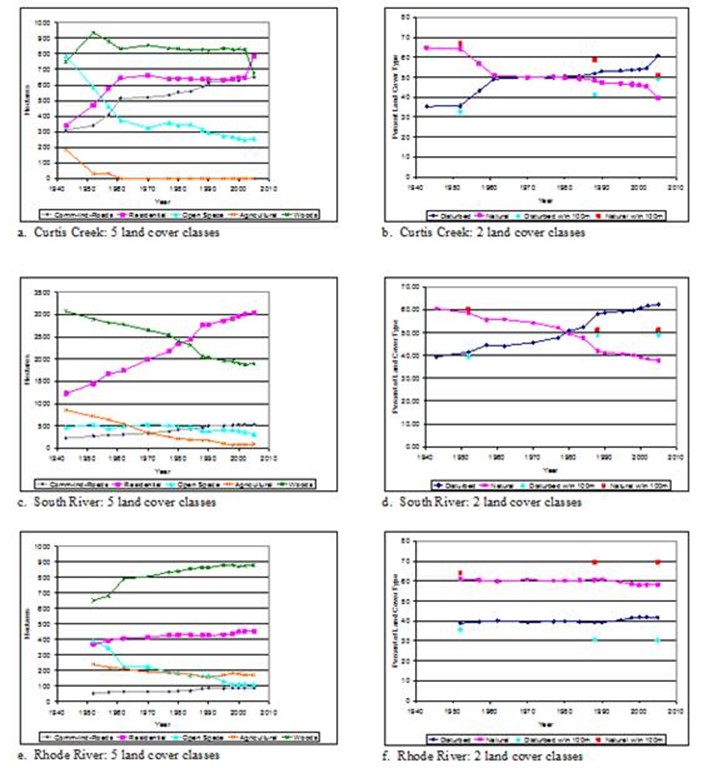
Figure 17 a-f. Changes in landcover over time in three subestuaries of Anne Arundel County, MD. Also shown in figures
b, d, and f is the percentages of disturbed vs natural landcover in a 100-m buffer around the wetlands of each.
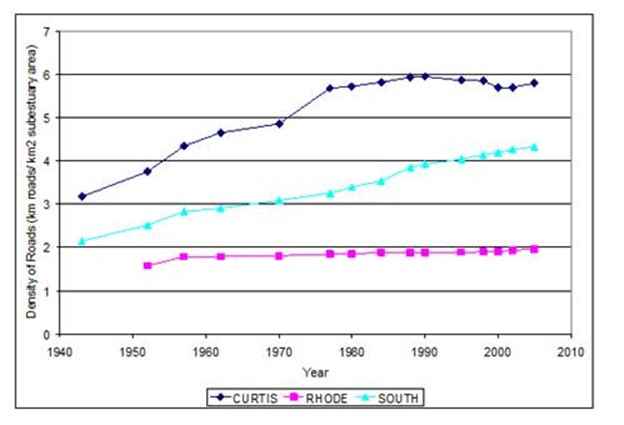
Figure 18. Change in road density from 1943 to 2005 in three subestuaries of Anne Arundel Co. MD.
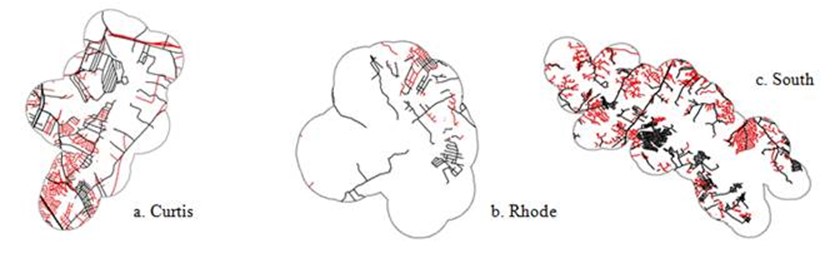
Figure 19. Road networks in three subestuaries of Anne Arundel Co. MD. Roads shown in black were presentt in 1943 (1952 for Rhode); roads shown in red
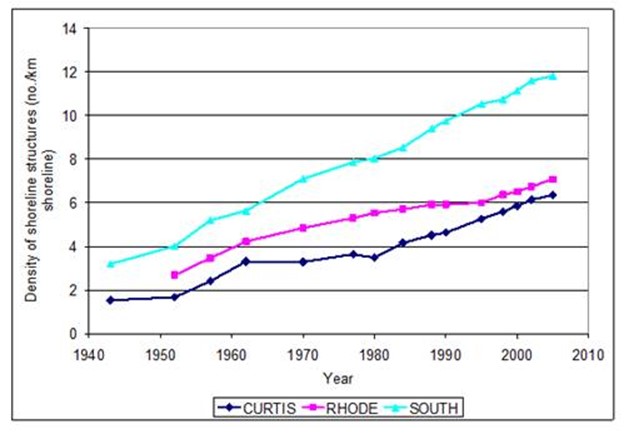
Figure 20. Change in the density of shoreline structures from 1943 to 2005 in three subestuaries of
Anne Arundel Co. MD.
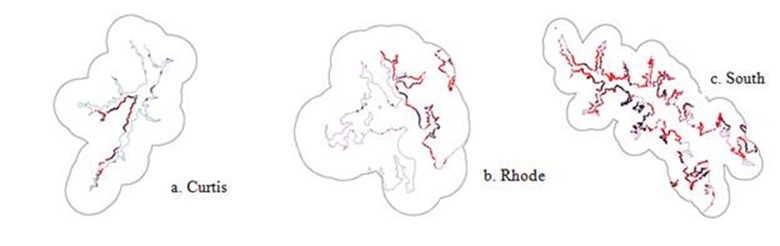
Figure 21. Shoreline structures in three subestuaries of Anne Arunde Co. MD. Structures shown in black were present in 1943 (1952 for Rhode);
| Curtis | Rhode | South | ||||
|---|---|---|---|---|---|---|
| Number in 2005 | Increase since 1952 | Number in 2005 | Increase since 1952 | Number in 2005 | Increase since 1952 | |
| Boat house | 13 | 550% | 19 | 217% | 93 | 127% |
| Dock | 201 | 319% | 265 | 168% | 1451 | 202% |
| Outfall | 0 | 2 | 100% | 21 | 250% | |
| Private ramp | 16 | 78% | 12 | 50% | 61 | 144% |
| Public ramp | 2 | 0% | 0 | 0 | ||
| TOTAL | 232 | 280% | 298 | 161% | 1626 | 195% |
Documenting Temporal Changes in Phragmites
1970s Tidal Marsh Survey
| Subestuary Name | Mapped Wetland Area 1975 (m2) | No. Phrag Patches 1975 | Phrag Area 1975 (m2) | Percent Phrag 1975 |
|---|---|---|---|---|
| Curtis | 108,286 | 2 | 2,633 | 2.4% |
| Rhode | 750,664 | 6 | 8,103 | 1.1% |
| South | 1,132,174 | 11 | 24,739 | 2.2% |
| Total | 1,991,124 | 19 | 35,475 | 1.8% |
SERC Aerial Photo Analysis
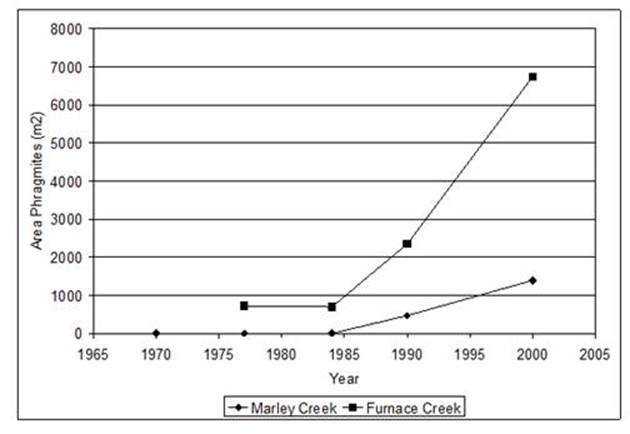
Figure 22. Changes in the area of Phragmites from 1970 to 2003 at two sites in the Curtis Creek subestuary
in Anne Arundel Co. MD.
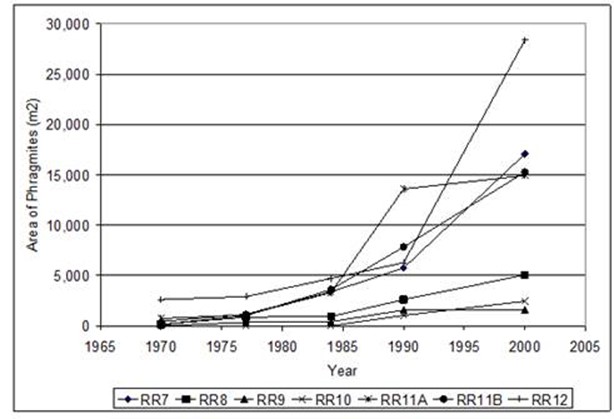
Figure 23. Changes in the area of Phragmites from 1970 to 2003 at seven sites in the Rhode RIver subestuary
in Anne Arundel Co., MD.
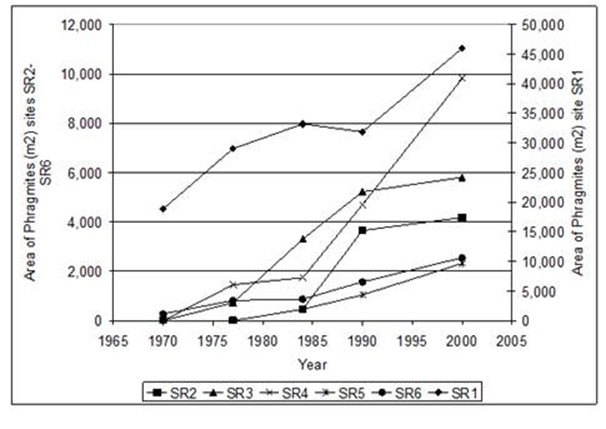
Figure 24. Changes in the area of Phragmites from 1970 - 2003 at six sites in the Suth River subestuary
VIMS Shoreline Survey
2007 Field Mapping
Aerial Photo Interpretation
Composite Presence/ Absence Assessment
Development of Spatial Datasets on Potential Driving Factors
| Curtis | Rhode | South | All | |||
|---|---|---|---|---|---|---|
| Wetland Attributes: | ||||||
| Number of Wetlands | 43 | 35 | 72 | 150 | ||
| Total Wetland Area (m2) | 136,470 | 328,034 | 954,048 | 1,418,552 | ||
| Avg. Perim-Area Ratio | 0.157 | 0.089 | 0.090 | 0.109 | ||
| Avg. Elevation (m) | 0.333 | 0.344 | .446 | 0.390 | ||
| Avg. Soil Organic Matter (%) | 92 | 28.8 | 33.2 | 25.3 | ||
| Avg. Dist to Nearest Wetl. (m) | 171.4 | 158.9 | 209.0 | 186.5 | ||
| Avg. Wetland Area (m2) | 3,174 | 9,372 | 13,251 | 9,457 | ||
| Phrag-related Attributes: | ||||||
| Avg. % Phrag 1976 | 0.92 | .14 | 2.57 | 1.53 | ||
| Avg. Dist. Phrag 1976 (m) | 1,803 | 1,212 | 1,702 | 1,617 | ||
| N. of Wetl. w/Phrag Present 5005 | 34 | 19 | 46 | 99 | ||
| % of Wetlands w/Phrag 2005 | 79.1% | 54.3% | 63.9% | 66.0% | ||
| Avg. % PHrag, all wetl. 2007 | 26.3 | 10.3 | ||||
| Avg. % Pgrag, wetl. w/Phrag 2007 | 36.5 | 20.1 | ||||
| 2005 Attributes for 100m Buffer around Wetland: | ||||||
| Avg. Density SS | 9.7 | 11.1 | 47.5 | 28.2 | ||
| Avg. Density Roads | 2,724 | 475 | 2,280 | 1,986 | ||
| Avg. % Developed | 25.5 | 8.6 | 31.5 | 24.4 | ||
| Avg. % Ag | 7.1 | 9.7 | 1.6 | 5.1 | ||
| Avg. % Forest | 32.3 | 41.0 | 27.4 | 32.0 | ||
| Avg. % Wetl | 1.1 | 0.9 | 7.3 | 4.0 | ||
| Avg. % Water | 34.3 | 39.8 | 32.2 | 34.6 | ||
| Other 2005 Attributes: | ||||||
| Avg. Dist to Nearest Shoreline Structure 2005 | 257.7 | 508.2 | 89.6 | 235.5 | ||
| 2005 Watershed Attributes: | ||||||
| % High Intensity Developed | 24.2 | 2.9 | 6.2 | |||
| % Low Intensity Developed | 29.2 | 16.6 | 34.9 | |||
| % High Intensity Ag | 0.0 | 4.3 | 0.7 | |||
| % Low Intensity Ag | 9.5 | 537 | 3.0 | |||
| % Forested | 25.5 | 35.1 | 22.0 | |||
| % Wetland | 0.1 | 1.5 | 1.0 | |||
| % Water | 11.9 | 33.8 | 32.2 |
Table 7. Characteristics of wetlands in the Curtis, Rhode, and South subestuaries. (Includes only wetlands used in the statistical analyses, as described below).
Assumptions and Definitions
| Subsestuary Name | No. of Wetlands | Wetland Area (m2) |
|---|---|---|
| Curtis | 48 | 163,800 |
| Rhode | 35 | 736,500 |
| South | 85 | 1,098,900 |
Spatial Datasets of Potential Driving Variables
2.5 Statistical Analyses
- It does not provide any idea about our certainty/uncertainty about the estimated probability surface. We would therefore not know about whether we were more confident about p(s) for one combination of predictors versus another.
- It does not reflect the uncertainty about model parameter estimates. We pretend we know these parameters, fixing them at their estimates, but what if our estimates are quite variable (uncertain)? This should be reflected as uncertainty about our corresponding estimates of our probability surface.
- We completely ignore the fact that spatial dependence may have a major role to play (i.e., perhaps Phragmites in one region is more likely to spread to nearby regions.
- In addition, there may be many other factors that influence Phragmites that we have not been able to observe or quantify, and these factors may be spatially similar. Hence, neighboring regions would have roughly the same value for these unobserved variables, influencing the presence of Phragmites.
Variable screening
- Subestuary membership (as reflected by the X and Y centroids) is highly correlated with many variables e.g., the perimeter-area ratio and buffer land cover characteristics, suggesting that subestuaries differ in these respects.
- Dist_phrag76 and pct_phrag76 are slightly significantly negatively correlated
- Road density and shoreline structure density are significantly positively correlated
- There was a high correlation between variables in a time series e.g., the percentage of residential land in 2002 and 2005
Non-Spatial Regression Analyses
Our goal was to develop a predictive model of Phragmites presence-absence using data from Rhode and Curtis subestuaries, and test it using data from the South River subestuary. MiniTab Ver. 15 software was used for statistical analyses. Logistic regression analyses were conducted using Pragmites presence-absence values derived from the percent Phragmites data, and least squares regression analyses were conducted using percent Phragmites data. Based on p values.
Table 9. For each variable in regression equation, summary of P values (p>Chi Square). r2 values for final model are also represented; all p values for final model were <=0.001. [Key to headings: All dta = all wetlands considered; Rhode-Curtis dta = only data from Rhode & Curtis wetlands; log regr = logistic regression analysis with Phragmites presence-absence as response variable.
| Variables | Rhode-Curtis Data: stepwise log regr | Rhode-Curtis data; log regr | Rhode-Curtis data; least sq regr | Rhose-Curtis data stepwise regr | All data; stepwise log regr | All data; nominal log regr | Sign of Regression Coefficient | |
|---|---|---|---|---|---|---|---|---|
| Area | .084 | .190 | .148 | .492 | .060 | .058 | (-) | * |
| P-A ratio | .127 | .073 | .130 | .330 | .151 | .142 | (-) | |
| Elevation | .003 | .001 | .001 | .001 | .009 | .019 | (-) | * |
| OM | .361 | .295 | .975 | .888 | .107 | .084 | (-) | |
| Dist_phrag76 | .065 | .094 | .057 | .042 | .001 | .001 | (+) | * |
| Dist_SS | (+) | * | ||||||
| BF_SS | .887 | .617 | .428 | .602 | .011 | .009 | (+) | |
| BF_roads | .703 | .550 | .093 | .140 | .439 | .443 | (-) | |
| BF_wetl | .091 | .096 | .647 | .706 | .072 | .062 | (+) | |
| Final model r2 | .377 | .39 | .305 | .266 | .262 | .265 |
*variables used for reduced model
| Actual vs Predicted for South River with 50% cutoff, 4-variable model, and Phrag05_P-A as dependent variable | |||
|---|---|---|---|
| Actual | |||
| Predicted | No | Yes | Grand Total |
| No | 3 | 1 | 4 |
| Yes | 23 | 45 | 68 |
| Grand Total | 26 | 46 | 72 |
| Actual vs Predicted for South River with 30% cutoff, 4-variable model, and Phrag05_P-A as dependent variable | |||
| Actual | |||
| Predicted | No | Yes | Grand Total |
| No | 9 | 5 | 14 |
| Yes | 17 | 41 | 85 |
| Grand Total | 26 | 46 | 72 |
| Actual vs Predicted for South River with 50% cutoff, 4-varable model, and Phrag07_P-A (percent phrag conveted to presence-absence) as dependent variable | |||
| Actual | |||
| Predicted | No | Yes | Grand Total |
| No | 6 | 2 | 8 |
| Yes | 20 | 44 | 64 |
| Grand Total | 26 | 46 | 72 |
| Actual vs predicted for South River with 50% cutoff and 9 variable model | |||
| Actual | |||
| Predicted | No | Yes | Grand Total |
| No | 11 | 7 | 18 |
| Yes | 15 | 39 | 54 |
| Grand Total | 26 | 43 | 72 |
Construction of Spatial Model
Depiction of Thresholds
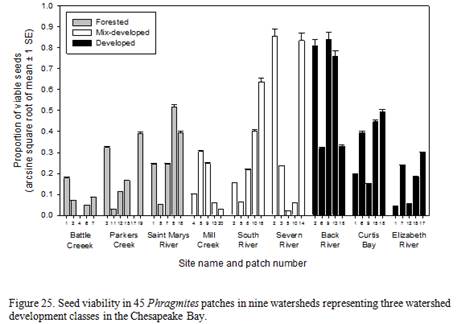
Population Studies in Support of Invasion Model: Seed Viability and Microsatellite Analysis
- Does seed viability vary among Phragmites patches?
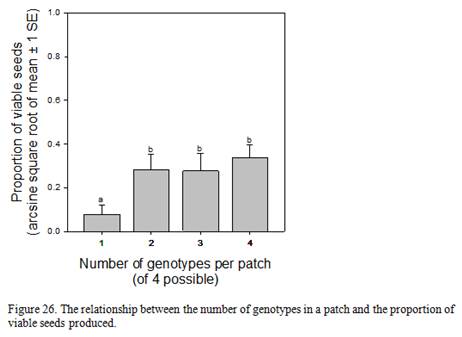
- Is patch level seed viability related to the number of genotypes within a patch?
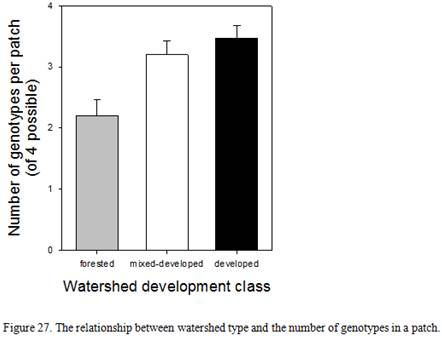
- Does the number of genotypes in a patch differ among forested, mix-developed, and developed watersheds?
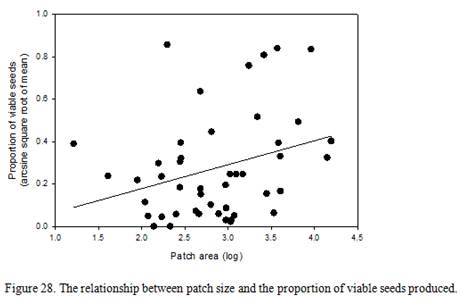
- Is patch level seed viability related to the size of a patch?
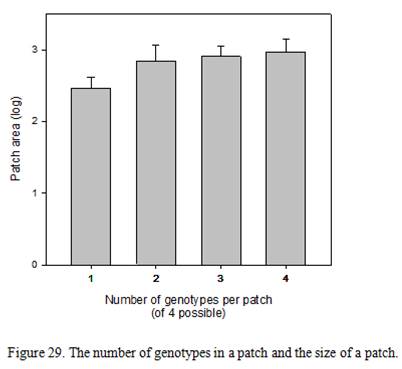
- Do the number of genotypes within a patch relate to the size of the patch?
- Are spread within patches and establishment of new patches products of seed establishment or rhizome expansion?
- Does the mode of spread differ with degree of development in a watershed?
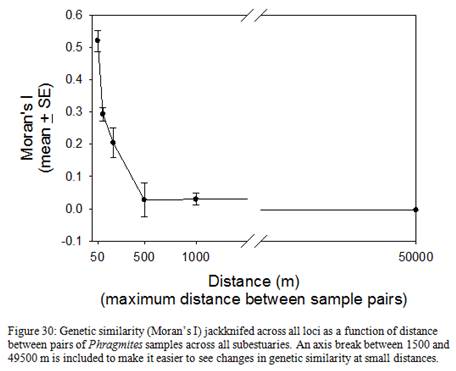
- Are patches that are close together more closely related than patches farther apart?
- Are patches within subestuaries more closely related to each other than to patches in other subestuaries?
| primer pair | annealing temperature (0C) | flurophor | DNA dilution |
|---|---|---|---|
| PaGT4 | 50 | FAM | 1:100 |
| PaGT9 | 50 | HEX | 1:50 |
| PaGT12 | 56 | FAM | 1:100 |
| PaGT13 | 50 | HEX | 1:50 |
| PaGT14 | 58 | FAM | 1:100 |
| PaGT16 | 56 | ned | 1:10 |
| PaGT21 | 58 | hex | 1:50 |
| PaGT22 | 50 | ned | 1:10 |
Results
Relationships between seed viability, number of genotypes within a patch, patch size, and watershed development
| Sub-estuary | Category | %forest | DEV | FIT | FIS | FST | FIT | FIS | FST |
|---|---|---|---|---|---|---|---|---|---|
| BC | forested | 75.64 | 4.41 | 0.2191 ± 0.0959 | -0.4393 ± 0.1242 | 0.045 ± 0.0428 | |||
| PC | forested | 80.13 | 66.53 | 0.3809 ± 0.1388 | 0.0367 ± 0.1242 | 0.3516 ± 0.0902 | 0.403 ± 0.1368 | 0.1348 ± 0.0.14 | 0.3063 ± 0.0967 |
| SMR | forested | 66.15 | 56.21 | 0.2983 ± 0.1342 | -0.1219 ± 0.0775 | 0.3704 ± 0.0909 | 0.3088 ± 0.1313 | 0.0689 ± 0.0873 | 0.3496 ± 0.0915 |
| MC | mixed | 72.20 | 56.85 | 0.2479 ± 0.1202 | -0.1262 ± 0.0886 | 0.3283 ± 0.0666 | 0.266 ± 0.1234 | -0.0542 ± 0.1025 | 0.2993 ± 0.0627 |
| SOR | mixed | 60.48 | 11.32 | 0.3621 ± 0.1605 | 0.1459 ± 0.1593 | 0.2441 ± 0.0751 | 0.3732 ± 0.1596 | 0.2343 ± 0.158 | 0.1732 ± 0.0706 |
| SVR | mixed | 53.62 | 6.28 | 0.5301 ± 0.1266 | 0.2154 ± 0.1972 | 0.4028 ± 0.0854 | 0.5206 ± 0.1201 | 0.2931 ± 0.1872 | 0.3278 ± 0.081 |
| BR | developed | 18.17 | 6.81 | 0.3352 ± 0.0834 | 0.0382 ± 0.0842 | 0.3068 ± 0.0357 | 0.3305 ± 0.0691 | 0.1171 ± 0.808 | 0.2414 ± 0.0301 |
| CB | developed | 21.83 | 14.95 | 0.4496 ± 0.1458 | 0.2067 ± 0.1478 | 0.2959 ± 0.0782 | 0.457 ± 0.146 | 0.2049 ± 0.1485 | 0.3065 ± 0.0802 |
| ER | developed | 19.64 | 25.44 | 0.3668 ± 0.0871 | 0.1388 ± 0.0914 | 0.2627 ± 0.0393 | 0.3666 ± 0.0871 | 0.1388 ± 0.0914 | 0.2627 ± 0.0393 |
| All 9 | 0.4309 ± 0.0777 | 0.3923 ± 0.08666 | 0.0645 ± 0.131 | 0.4384 ± 0.0766 | 0.4039 ± 0.0838 | 0.0585 ± 0.0111 | |||
| PaGT4 | PaGT9 | PaGT12 | PaGT13 | PaGT14 | PaGT16 | PaGT21 | PaGT22 | mean | SE | mean | SE | ||||||||||
|---|---|---|---|---|---|---|---|---|---|---|---|---|---|---|---|---|---|---|---|---|---|
| Subset | Dev. | A | G | A | G | A | G | A | G | A | G | A | G | A | G | A | G | A | A | G | G |
| BC | D | 3 | 3 | 4 | 4 | 4 | 4 | 3 | 3 | 3 | 3 | 4 | 4 | 5 | 5 | 4 | 6 | 3.75 | 0.25 | 4 | 0.378 |
| PC | F | 2 | 3 | 6 | 8 | 6 | 10 | 10 | 21 | 6 | 7 | 5 | 5 | 7 | 14 | 5 | 7 | 0.875 | 0.798 | 9.375 | 2.026 |
| SMR | F | 3 | 4 | 5 | 6 | 10 | 14 | 9 | 29 | 5 | 9 | 3 | 4 | 6 | 11 | 4 | 7 | 5.625 | 0.925 | 10.5 | 2.909 |
| MC | M | 2 | 3 | 5 | 7 | 9 | 16 | 8 | 18 | 7 | 10 | 3 | 4 | 6 | 10 | 5 | 7 | 5.625 | 0.844 | 9.375 | 1.889 |
| SOR | M | 6 | 6 | 6 | 8 | 5 | 5 | 4 | 6 | 6 | 7 | 3 | 7 | 8 | 17 | 4 | 7 | 5.25 | 0.559 | 7.875 | 1.342 |
| SVR | M | 5 | 6 | 6 | 9 | 4 | 8 | 4 | 6 | 6 | 14 | 4 | 7 | 8 | 14 | 6 | 7 | 5.5 | 0.463 | 8.875 | 1.172 |
| BR | D | 2 | 2 | 4 | 5 | 4 | 6 | 4 | 7 | 7 | 15 | 3 | 5 | 7 | 15 | 4 | 9 | 4.375 | 0.625 | 8 | 1.68 |
| CB | D | 2 | 3 | 8 | 9 | 11 | 13 | 12 | 25 | 5 | 12 | 5 | 7 | 6 | 10 | 4 | 9 | 6.625 | 1.224 | 11 | 2.276 |
| ER | D | 2 | 3 | 5 | 12 | 8 | 2 | 10 | 21 | 4 | 7 | 41 | 8 | 7 | 16 | 7 | 12 | 5.875 | 0.915 | 12.38 | 2.224 |
| ALL | 6 | 7 | 9 | 22 | 12 | 49 | 12 | 76 | 9 | 27 | 7 | 19 | 9 | 42 | 8 | 18 | 9 | 0.756 | 32.5 | 7.835 | |
Conclusions:
- Is an upland stand present?
- Will activity disperse rhizomes to the site?
- Will activity bury rhizomes?
- Are burial sites well-drained at time of burial?
- Is early salinity at burial sites consistently below 18%?
- Will activity lower burial site salinity?
- Are clones spreading into low salinity/sulfide areas?
- Will activities lower salinity/sulfides?
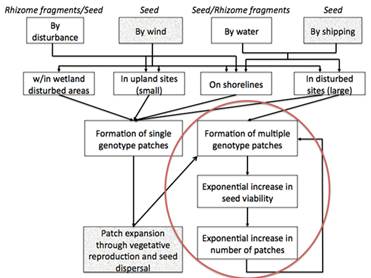
- The almost exponential increase in the number of shoreline structures. Shoreline structures increase the number of dispersal opportunities, through earth moving and distribution of seed and rhizome fragments. Structures also increase the number of both small and large disturbed areas available for colonization. In this manner, a critical gravity measure may be the true threshold. Gravity was expressed as Forman and Godron (1986) as a function of the amount of material to be communicated (in this case, the genetic information embodied in different genotypes of seed or rhizome) and the distance between the patches. This model of gravity assumes that the rate of movements, or flows, between elements depends primarily on linkage distance, and secondarily on the node size. Development in a watershed can increase the number of patches, the distance between them, and their size. There would, therefore, be multiple ways to reach the critical gravity measure, by altering any or all of these. Wetlands surrounded by more development may experiences more within-wetland disturbance which, in turn, would provide a greater number of safe sites for seedling establishment. If seedling establishment is higher in wetlands within developed watersheds, the higher genetic diversity could result in a high incidence of cross pollination among flowering plants which result in the production of more viable seeds and ultimately increased establishment of seedlings in habitats that experience a higher rate of disturbance.
- Increase in road density. A higher density of road networks can provide enhanced dispersal of seed, creation of habitat via either direct disturbance and/or sedimentation impacts, or habitat suitability through increased nutrients and changes in drainage patterns.
- Seed dispersal is the dominant form of spread of Phragmites in the subestuaries incuded in the study.
- Thresholds occur temporally at the subestuary scale and appear to be linked to the accumulation of genetic variation and the ability of patches to communicate. The system then flips to a nested alternative invasion cycle, whereby colonization success is greatly increased by the production of viable seed and the availability of new habitat.
- Development in the watershed, at the subestuary scale, serves to accelerate the accumulation of genetic variation and the availability of habitat. Through a variety of finer scale processes, it moves the invasion process toward the nested alternative cycle.
- Shoreline structure development appears to initiate movement toward this nested alternative invasion cycle, and should therefore be assessed further. Potential alterations to the number of shoreline structures allowed, their density, size of disturbed area, and vegetative controls after structure establishment may all be potential management controls.
- The level of development in the subestuaries studied appears to be already sufficient for establishment of Phragmites, and is not a continuing factor in controlling invasion.
- The Battle Creek subestuary provides an important opportunity for control strategies in watersheds that are currently primarily forested. The few patches of Phragmites that were growing in Battle Creek had very few genotypes per patch. This is likely an example of a watershed where management now, while most patches are monoclonal and producing few viable seeds, would likely be very effective at limiting establishment of new patches.
References:
AA Co. OECR. 2005. LandCover2004. Digital data files. Anne Arundel County Office of Environmental and Cultural Resources, Annapolis, MD. On CD.
Ailstock, M.S., C. M. Norman, P. J. Bushmann. 2001. Common Reed Phragmites australis: Control and Effects Upon Biodiversity in Freshwater Nontidal Wetlands. Restoration Ecology 9(1): 49-59.
Alvarez, M.G., F. Tron, A. Mauchamp. 2005. Sexual versus asexual colonization by Phragmites australis: 25-year reed dynamics in a Mediterranean marsh, southern France. Wetlands 25: 639-647.
Amsberry, L. Baker, M.A., Ewanchuk, P.J., and Bertness, M.A. 2000. Clonal integration and the expansion of Phragmites australis. Ecological Applications. 10: 1110-1118.
Balloux, F., and N. Lugon-Moulin. 2002. The estimation of population differentiation with microsatellite markers. Molecular Ecology 11: 155-165.
Balloux, F., L. Lehmann, and T. de Meeus. 2003. The population genetics of clonal and partially clonal diploids. Genetics 164: 1635-1644.
Baron, H.M., K.M. Kettenring, M.K. McCormick, D.F. Whigham. In prep. Variation in seed viability, genetic diversity, and foliar nutrients of non-native Phragmites australis in the Rhode River, a subestuary of the Chesapeake Bay.
Bart, D. and Hartman, J.M. 2000. Environmental determinants of Phragmites australis expansion in a New Jersey salt marsh: an experimental approach. 2000. Oikos. 89: 59-69.
Bart, D. and Hartman, J.M. 2002. Environmental constraints on early establishment of Phragmites australis in salt marshes. Wetlands. 22: 201-213.
Bart, D. and Hartman, J.M. 2003. The role of large rhizome dispersal and low salinity windows in the establishment of common reed, Phragmites australis, in salt marshes: New links to human activities. Estuaries. 26: 436-443.
Berman et al. 2006. Development of the Maryland Shoreline Inventory: Methods and Guidelines for Anne Arundel County. Report prepared by the Comprehensive Coastal Inventory Program, Center for Coastal Resources Management, Virginia Institute of Marine Science, College of William and Mary, Gloucester Point, Virginia. August 2006.
Bertness, M. D., P. Ewanchuk, and B. R. Silliman. 2002. Anthropogenic modification of New England salt marsh landscapes. Proceedings of the National Academy of Sciences of the United States of America 99(3):1395–1398.
Beyer, H. L. 2004. Hawth's Analysis Tools for ArcGIS. Available at http://www.spatialecology.com/htools.
Burdick, D.M, Buchsbaum, R. and Holt, E. 2001. Variation in soil salinity associated with expansion of Phragmites australis in salt marshes. Environmental and Experimental Botany. 46: 247-261.
Burdick, D.M. and Konisky, R.A. 2003. Determinants of Expansion for Phragmites australis, Common Reed, in Natural and Impacted Coastal Marshes. Estuaries. 26: 407-416.
Chambers et al., draft MS.
Chambers, R.M., Meyerson, L.A., and Saltonstall, K. 1999. Expansion of Phragmites australis into tidal wetlands of North America. Aquatic Botany. 64: 261-273.
Chambers, R.M., Mozdzer, T.J., and Ambrose, J.C. 1998. Effects of salinity and sulfide on the distribution of Phragmites australis and Spartina alterniflora in a tidal saltmarsh. Aquatic Botany. 62: 161-169.
Chambers, R.M., Osgood, D.T., Bart, D.J., and Montalto, F. 2003. Phragmites australis invasion and expansion in tidal wetlands: interactions among salinity, sulfide, and hydrology. Estuaries. 26(2B): 398-406.
Clevering, O.A., and J. Lissner. 1999. Taxonomy, chromosome numbers, clonal diversity and population dynamics of Phragmites australis. Aquatic Botany 64: 185-208.
Cole, M.L., Kroeger, K.D., McClelland, J.W., Valiela, I. 2006. Effects of watershed land use on nitrogen concentrations and δ15 nitrogen in groundwater. Biogeochemistry. 77: 199-215.
County, Maryland. Digital data files. US Department of Agriculture, Natural Resources Conservation Service. http://SoilDataMart.nrcs.usda.gov/
Davidson, S.G., Merwin, Jr., J.G., Capper, J., Power, G., and Shivers, Jr., F.R. 1997. Chesapeake Waters: Four Centuries of Controversy, Concern, and Legislation.2nd ed. Tidewater Publishers Centreville, MD.
Elliott, E.M. and Brush, G.S. 2006. Sedimented organic nitrogen isotopes in freshwater wetlands record long-term changes in watershed nitrogen source and land us. Environmental Science and Technology. 40: 2910-2916.
Ellstrand, N.C. and M.L. Roose. 1987. Patterns of genotypic diversity in clonal plant species. American Journal of Botany 74: 123-131.
ESRI. 1999. ArcView GIS 3.2. Environmental Systems Research Institute, Inc.
ESRI. 2006. ArcMap 9.2. Environmental Systems Research Institute, Inc.
Fell, P.E., S.P. Weisbach, and D.A. Jones. 1998. Does invasion of oligohaline tidal marshes by reed grass Phragmites australis (Cav.) Trin. Ex Steud., affect the availability of prey resources for the mummichog, Fundulus heteroclitus L.? Jour. Exp. Mar. Bio. Ecol. 222: 59-77.
Forman, R.T.T. and M. Godron. 1986. Landscape Ecology. John Wiley, New York, NY.
Forsell, D. and L. Gerlich. 2000. Distribution and abundance of Phragmites in estuarine wetlands in Virginia’s portion of the Chesapeake Bay (speaker abstract). In Phragmites in Virginia: A Management Symposium. December 14, 2000. Virginia Department of Conservation and Recreation.
Gervais, C., R. Trahan, D. Moreno, A.-M. Drolet. 1993. Le Phragmites australis au Québec: distribution, géographique, nombres chromosomiques et reproduction. Canadian Journal of Botany 71:1386-1393.
Gregorius, H-R. 2005. Testing for clonal propagation. Heredity 94: 173-179.
Guo, W., R. Wang, S. Zhou, S. Zhang, Z. Zhang. 2003. Genetic diversity and clonal structure of Phragmites australis in the Yellow River delta of China. Biochemical Systematics and Ecology 31: 1093-1109.
Halkett, F., J-C. Simon, and F. Balloux. 2005. Tackling the population genetics of clonal and partially clonal organisms. Trends in Ecology and Evolution 20:194-201.
Hardy, O.J., and X. Vekemans. 1999. Isolation by distance in a continuuous population: reconciliation between spatial autocorrelation analysis and population genetics models. Heredity 83: 145-154.
Hardy, O.J., and X. Vekemans. 2002. SPAGeDi: a versitile computer program to analyse spatial genetic structure at the individual or population levels. Molecular Ecology Notes 2:618-620.
Haslam, S.M. 1965. Ecological Studies in the Breck Fens. I. Vegetation in relation to habitat. Journal of Ecology. 53: 599-619.
Haslam, S.M. 1972. Biological Flora of the British Isles: Phragmites communis Trin. Journal of Ecology. 60: 585-610.
Holling, C.S. and Gunderson, L.H. 2002. Resilience and Adaptive Cycles. In: Panarchy. Understanding Transformations in Human and Natural Systems. Eds. L.H. Gunderson & C.S. Holling. Island Press. Washington.
Holling, C.S., Gunderson, L.H., Peterson, G.D. 2002. Sustainability and Panarchies. In: Panarchy. Understanding Transformations in Human and Natural Systems. Eds. L.H. Gunderson & C.S. Holling. Island Press. Washington.
Horton, T. and Chesapeake Bay Foundataion. 2003. Turning the Tide: Saving the Chesapeake Bay. Island Press. Washington D.C.
Hudon, C. P. Gagnon, and M. Jean. 2005. Hydrological factors controlling the spread of common reed (Phragmites australis) in the St. Lawrence River (Québec, Canada). Ecoscience 12: 347-357.
Ishii, J., and Y. Kadono. 2002. Factors influencing seed production of Phragmites australis. Aquatic Botany 72: 129-141.
Keller, B.E.M. 2000. Genetic variation among and within populations of Phragmites australis in the Charles River watershed. Aquatic Botany 66:195-208.
Kettenring and Whigham. In prep. The seed ecology of non-native Phragmites australis in developed and forested watersheds of the Chesapeake Bay, USA.
King, R.S. W.V. Deluca, D.F. Whigham, and P.P. Marra. 2007. Threshold effects of coastal urbanization on Phragmites australis (Common Reed) abundance and foliar nitrogen in Chesapeake Bay. Estuaries and Coasts 30:1-13.
Koppitz, H. 1997. Some aspects of the importance of genetic diversity in Phragmites australis (Cav.) Trin. Ex Steudel for the development of reed stands. Botanica Acta 110: 217-223.
Koppitz, H. 1999. Analysis of genetic diversity among selected populations of Phragmites austalis world-wide. Aquatic Botany 64: 209-221.
Lambert, A.M., R.A. Casagrande. 2007. Characteristics of a successful estuarine invader: evidence of self-compatibility in native and non-native lineages of Phragmites australis. Marine Ecology Progress Series 337: 299-301.
Lathrop, R.G., L. Windham, P. Montesano. 2003. Does Phragmites expansion alter the structure and function of marsh landscapes? Patterns and processes revisited. Estuaries 26:423-435.
Lelong, B., C. Lavoie, Y. Jodoin, and F. Belzile. 2007. Expansion pathways of the exotic common reed (Phragmites australis): a historical and genetic analysis. Diversity and Distributions 13: 430-437.
Marks, M., V. Lapin, J. Randall. 1994. Phragmites australis (P. communis): Threats, management, and monitoring. Natural Areas Journal 14: 285-294.
McCormick, J. and H.A. Somes, Jr. 1982. The Coastal Wetlands of Maryland. Maryland Department of Natural Resources Coastal Zone Management Program. J. McCormick and Associates, Chevy Chase, MD. 261 pp.
MD-DNR. 1993. dnrwet - DNR_Wetlands. Digital data files. Maryland Department of Natural Resources, Geographic Information Services Division, Annapolis, MD. http://dnrweb.dnr.state.md.us/gis/data/data.asp
Meyerson, K.A., Vogt, K.A., and Chambers, R.M. 2000a. Linking the success of Phragmites to the alteration of ecosystem nutrient cycles. pp. 827-844 in Concepts and Controversies in Tidal Marsh Ecology. Ed. Weinstein, M.P. and Kreeger, D.A. Kluwer Academic Publishers, Dordrecht, Netherlands. 875 pp.
Meyerson, L.A., K. Saltonstall, L. Windham, E. Kiviat, S. Findlay. 2000. A comparison of Phragmites australis in freshwater and brackish environments in North America. Wetland Ecology and Management 8:89-103.
Minchinton, T. E., and M.D. Bertness. 2003. Disturbance–mediated competition and the spread of Phragmites australis in a coastal marsh. Ecological Applications 13:1400–1416.
Minchinton, T.E. 2002a. Disturbance by wrack facilitates spread of Phragmites australis in a coastal marsh. J. of Experimental Marine Biology and Ecology. 281: 89-107.
Minchinton, T.E. 2002b. Precipitation during El Niño correlates with increasing spread of Phragmites australis in New England, USA, coastal marshes. 242: 305-309.
Minchinton, T.E., J.C. Simpson, M.D. Bertness. 2006. Mechanisms of exclusion of native coastal marsh plants by an invasive grass. Journal of Ecology 94: 342-354.
Minitab. 2006. Minitab Ver. 15. Statistical software package. Minitab, Inc.
Neuhaus, D. H. Kühl, J.-G.Kohl, P. Dörfel, and T. Börner. 1993. Investigation on the genetic diversity of Phragmites stands using genomic fingerprinting. Aquatic Botany 45: 357-364.
Osgood, D.T., D.J. Yozzo, R.M. Chambers, S. Pianka, J. Lewis, and D. Jacobson. 2002. Factors controlling nekton habitat utilization patterns within Phragmites and non-Phragmites marshes (abstract). In Phragmites australis: A Sheep in Wolf’s Clothing? A Special Technical Forum and Workshop, p. 14, New Jersey Marine Sciences Consortium Workshop, January 6-9, 2002. Cumberland County College, Vineland, NJ.
Packett, C.R. and Chambers, R.M. 2006. Distribution and nutrient status of haplotypes of the marsh grass Phragmites australis along the Rappahannock River in Virginia. Estuaries and Coasts. 29: 1222-1225.
Parsons, K.C. 2002. Reproductive success of wading birds utilizing Phragmites marsh and upland nesting habitats (abstract). In Phragmites australis: A Sheep in Wolf’s Clothing? A Special Technical Forum and Workshop, p. 14, New Jersey Marine Sciences Consortium Workshop, January 6-9, 2002. Cumberland County College, Vineland, NJ.
Pellegrin, D. and D.P. Hauber. 1999. Isozyme variation among populations of the clonal spcies, Phragmites australis (Cav.) Trin. Ex Steudel. Aquatic Botany 63: 241-259.
Phillips, J.D. 1987. Shoreline processes and establishment of Phragmites australis in a coastal plain estuary. Vegetatio. 71: 139-144.
Pollux, B.J.A., M.D.E. Jong, A. Steegh, E. Verbruggen, J.M. van Groenendael, and N.J. Ouborg. 2007. Reproductive strategy, clonal structure and genetic diversity in populations of the aquatic macrophyte Sparganium emersum in river systems. Molecular Ecology 16: 313-325.
Pons, O. and R.J. Petit. 1996. Measuring and testing genetic differentiation with ordered versus unordered alleles. Genetics 144:1237-1245.
Pyke, C.R., and Havens, K.J. 1999. Distribution of the invasive reed Phragmites australis relative to sediment depth in a created wetland. Wetlands. 19: 283-287.
Rice, D., Rooth, J., Stevenson, J.C. 2000. Colonization and expansion of Phragmites australis in upper Chesapeake Bay tidal marshes. Wetlands. 20: 280-299.
Richburg, J.A., Patterson, III, W.A., Lowenstein, F. 2001. Effects of road salt and Phragmites australis invasion on the vegetation of a western Massachusetts calcareous lake-basin fen. Wetlands. 21: 247-255.
Rickey, M.A. and Anderson, R.C. 2004. Effects of nitrogen addition on the invasive grass Phragmites australis and a native competitor Spartina pectinata. J. of Applied Ecol. 41: 888-896.
Saltonstall, K. 2002. Cryptic invasion by a non-native genotype of the common reed, Phragmites australis, into North America. Proceedings of the National Academy of Sciences 99: 2445-2449.
Saltonstall, K. 2003a. Microsatellite variation within and among North American lineages of Phragmites australis. Molecular Ecology 12: 1689-1702.
Saltonstall, K. 2003b. Genetic variation among North American populations of Phragmites australis: implications for management. Estuaries 26:444-451.
Saltonstall, K. and J.C. Stevens. 2007. The effect of nutrients on seedling growth of native and introduced Phragmites australis. Aquatic Botany 86:331-336.
SAS Institute Inc. 2007. JMP 7.0.2.
Silliman B.R, and M.D. Bertness. 2004. Shoreline development drives invasion of Phragmites australis and the loss of plant diversity on New England salt marshes. Conservation Biology 18: 1424-1434.
Slatkin, M., 1995. A measure of population subdivision based on microsatellite allele frequencies. Genetics 139:1463-1463.
Stevenson, J.C., and J. Roothe. 2002. Historical and ecological perspectives of Phragmites australis in the Mid-Atlantic landscape (abstract). In Phragmites australis: A Sheep in Wolf’s Clothing? A Special Technical Forum and Workshop, p. 14, New Jersey Marine Sciences Consortium Workshop, January 6-9, 2002. Cumberland County College, Vineland, NJ.
Templer, P., Findlay, S., and Wigand, C. 1998. Sediment chemistry associated with native and non-native emergent macrophytes of a Hudson River marsh ecosystem. Wetlands. 18: 70-78.
USDA-NRCS. 2006. Soil Survey Geographic (SSURGO) database for Anne Arundel
USFWS. 1981-2002. nwi – NationalWetlandsInventory. Digital data files. US Fish and Wildlife Service, National Wetlands Inventory, St. Petersburg, Florida. http://dnrweb.dnr.state.md.us/gis/data/data.asp
van der Putten, W.H. 1997. Die-back of Phragmites australis in European wetlands: an overview of the European Research Programme on reed die-back and progression. Aquatic Botany. 59:263-275.
Vasquez, E.A., Glenn, E.P., Brown, J.J., Guntenspergen, G.R., Nelson, S.G. 205. Salt tolerance underlies the cryptic invasion of North American salt marshes by an introduced haplotype of the common reed Phragmites australis (Poaceae). Marine Ecology Progress Series. 298: 1-8.
Warren et al. 2001
Warren, R.S., Fell, P.E., Grimsby, J.L., Buck, E.L., Rilling, C., and Fertick, R.A. 2001. Rates, patterns, and impacts of Phragmites australis expansion and effects of experimental Phragmites control on Vegetation, macroinvertebrates and fish within Tidelands of the Lower Connecticut River. Estuaries. 24: 90-107.
Warren, R.S., Fell, P.E., Rozsa, R., Brawley, A.H., Orsted, A.C., Olson, E.T., Swamy, V., Niering, W.A. 2002. Salt marsh restoration in Connecticut: 20 years of science and management. Restoration Ecology. 10: 497-513.
Weigel, J. 2004. Nearest Neighbor 3.5, extension for ArcView, available from http://arcscripts.esri.com.
Weir, B. S., and C. C. Cockerham. 1984. Estimating F-statistics for the analysis of population structure. Evolution 38: 1358-1370.
Wilcox, K.L., Petrie, S.A., Maynard, L.A., and Meyer, S.W. 2003. Historical distribution and abundance of Phragmites australis at Long Point, Lake Erie, Ontario. Journal of Great Lakes Research. 29: 664-680.
Windham, L. 2001. Comparison of biomass production and decomposition between Phragmites australis (Common Reed) and Spartina patens (Salt hay grass) in brackish tidal marshes of New Jersey, USA. Wetlands. 21(2): 179-188.
Windham, L. and Lathrop, Jr., R.G.1999. Effects of Phragmites australis (common reed) invasion on aboveground biomass and soil properties in brackish tidal marsh of the Mullica River, New Jersey. Estuaries. 22: 927-935.
Zeidler, A., S. Schneider, C. Jung, A.E. Melchinger, and P. Dittrich. 1994. The use of DNA fingerprinting in ecological studies of Phragmites australis (Cav.) Trin. ex Steudel. Botanica Acta 107: 237-242.
Supplemental Keywords:
Estuary, Mid-Atlantic, coastal marshes, CART, ecosystem condition, Ecosystem Protection/Environmental Exposure & Risk, Scientific Discipline, Aquatic Ecosystems & Estuarine Research, Ecological Risk Assessment, Aquatic Ecosystem, Ecology and Ecosystems, Environmental Monitoring, index of environmental stress, community structure, ecosystem indicators, computer models, probabilty surface, diagnostic indicators, aquatic indicators, aquaculture, coastal ecosystem, ecosystem response, modeling ecosystems, RFA, Scientific Discipline, ECOSYSTEMS, Ecosystem Protection/Environmental Exposure & Risk, Aquatic Ecosystems & Estuarine Research, Aquatic Ecosystem, Aquatic Ecosystems, Environmental Monitoring, Ecological Risk Assessment, Ecology and Ecosystems, coastal ecosystem, aquaculture, probabilty surface, computer models, diagnostic indicators, ecosystem indicators, index of environmental stress, modeling ecosystem change, aquatic indicators, community structure, ecosystem responseProgress and Final Reports:
Original AbstractThe perspectives, information and conclusions conveyed in research project abstracts, progress reports, final reports, journal abstracts and journal publications convey the viewpoints of the principal investigator and may not represent the views and policies of ORD and EPA. Conclusions drawn by the principal investigators have not been reviewed by the Agency.