
Grantee Research Project Results
Final Report: Conversion of Agricultural and Forestry Biomass Residues to Biochar for Carbon Sequestration and Soils Improvement Applications
EPA Grant Number: SV839370Title: Conversion of Agricultural and Forestry Biomass Residues to Biochar for Carbon Sequestration and Soils Improvement Applications
Investigators: Dahlgren, John
Institution: Butte College
EPA Project Officer: Page, Angela
Phase: II
Project Period: March 1, 2018 through February 29, 2020 (Extended to February 28, 2022)
Project Amount: $75,000
RFA: P3 Awards: A National Student Design Competition for Sustainability Focusing on People, Prosperity and the Planet - Phase 2 (2017) Recipients Lists
Research Category: P3 Awards , Sustainable and Healthy Communities , P3 Challenge Area - Air Quality
Objective:
The primary objective of the MESA internship projects at Butte College since 2010, including the two consecutive Phase I and Phase II EPA-P3 grant projects described herein, was the introduction of undergraduate, lower division students to hands-on applied research and development procedures through laboratory and field experimentation.
The emphasis in selection of projects was on the introduction to solving of real-world environmental challenges related to global warming. One opportunity was the reduction of greenhouse gas emissions from agricultural and forestry waste biomass through carbon sequestration by its conversion to biochar. Another opportunity explored the practical application of biochar in agriculture and forestry to improve soil moisture retention and productivity. The highly successful summer project in 2018 introduced interns to real-world field applications of biochar on an operating organic farm near the college. The interns participated in biochar-augmented soils preparation, planting, and harvesting of vegetables.
The project changed focus after the disastrous Camp Fire, which occurred in November 2018 destroying the nearby town of Paradise and much of Butte County. Butte College served as the command center for fire fighters and law enforcement during the fire. Students and faculty were deeply affected, including Steve Feher, the Technical Director of the project, who’s home burned to the ground in Paradise. Consequently, he changed the emphasis of the project to focus on to processing forestry waste biomass conversion to biochar on-site using “conservation burn” methods and other on-site biochar production techniques as will be described in this report.
During this phase of the project, student interns gained hands on experience in clearing dead trees, building burn piles and using so called Oregon Kilns to convert waste biomass to biochar, thereby reducing the carbon footprint of the post-fire cleanup process by minimized processing and transportation of the burned trees and shrub.
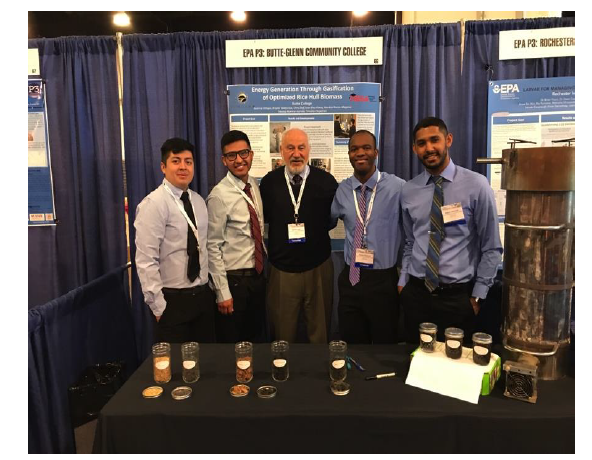
Figure 1. MESA interns at a EPA P3 National Expo
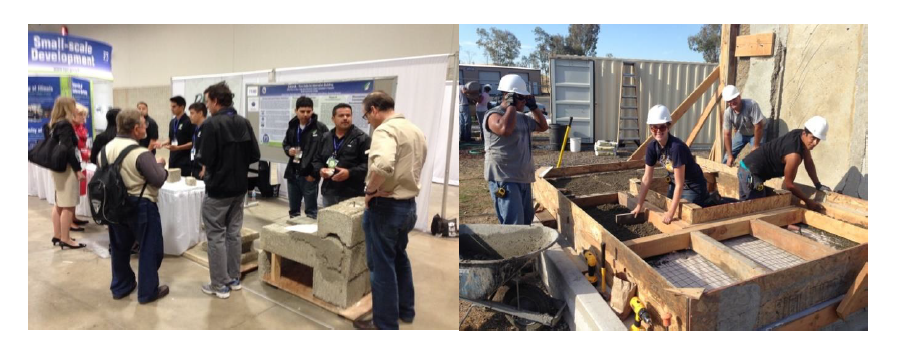
Figure 2. Rice Hull Building System (RHAB demonstration house module construction
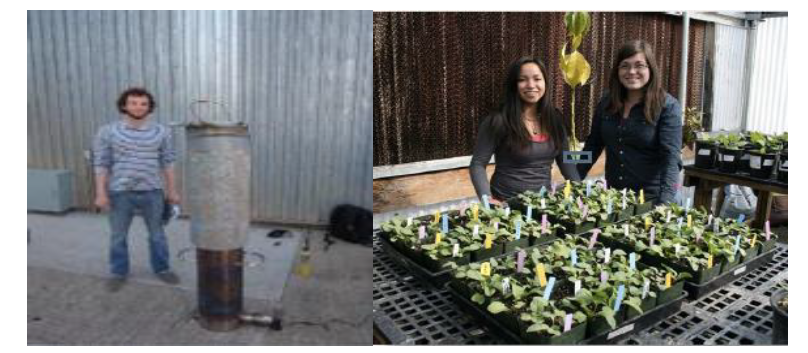
Figure 3. Rice hull gasification using an Olivier stove. Nursery scale biochar experiments
Summary/Accomplishments (Outputs/Outcomes):
The following presents a description of each research area, associated experiments and the results for each during the research phase of this project.
Laboratory Scale Biochar Production Experiments using Olivier Stoves2: In this experiment, we compared the volume of raw biomass feed stock and the resulting biochar before and after processing through pyrolysis process in the Olivier Stove. We pyrolyzed rice and walnuts each by themselves and then utilized three different blended ratios (rice: walnut, in percentage) in separate burns: 50:50,
75:25, and 25:75.
We measured mass in grams, volume in liters, and dry bulk density in grams per milliliter. We timed the burn and took the flame temperature in degrees Celsius during the burn. We then measured the end volume in liters to determine the biochar yield from various biomass feedstocks. In addition, during these experiments, we also measured the flame temperature during pyrolysis for various feedstocks. The feedstocks used were walnut shells and rice hulls.
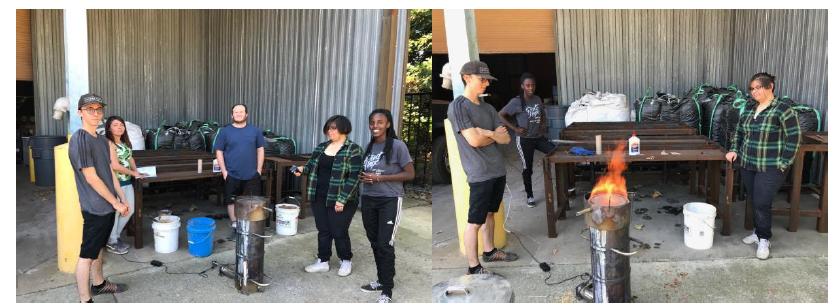
Figure 4. Pyrolyzing rice hulls with a clear clean flame on left and 50-50 mixture of rice hulls
Laboratory testing and characterization of biochar: Interns pyrolyzed rice hulls with a clear clean flame in a 50-50 mixture of rice hulls and walnut shells burning with orange flame (Figure 4). Assessment of biochar properties and stability in laboratory testing is a fundamental part of introducing student interns to the potential applications of biochar.
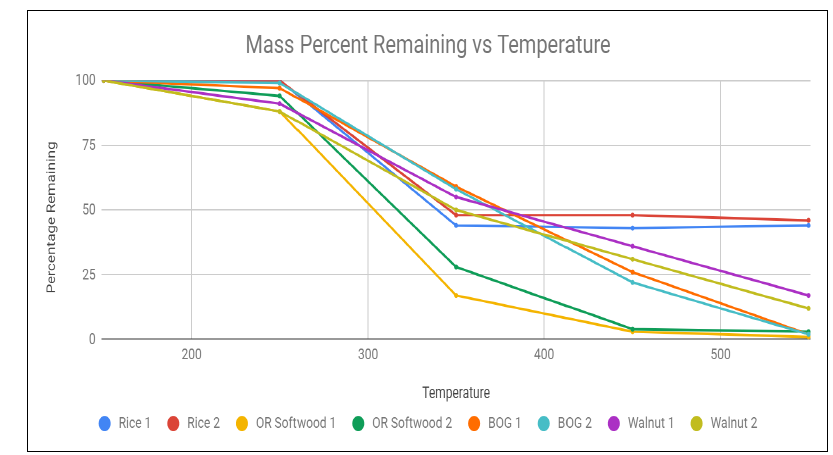
Figure 5. Mass percent remaining in different biochars at increasing temperatures.
Biochar is produced through the pyrolysis of biomass. Pyrolysis is the process of heating biomass in the absence of sufficient oxygen to cause complete combustion. Pyrolysis physically and chemically transforms raw biomass into a more recalcitrant form, primarily stable carbon, which can be applied to soil for long‐term sequestration.
Stability of biochar: The moisture content and thermal stability of carbon in biochar is a much-studied subject by the scientific community. It has been measured using a variety of testing methods to various degrees to satisfy various applications related requirements. For the purposes of this project focusing on agricultural applications of biochar, we used simplified analysis methods developed by Dr. Hugh McLaughlin6. The biochars were evaluated for moisture content and thermal stability at elevated temperatures, as detailed below.
Four different biochars were tested:
a) Rice Hulls Biochar made in Olivier Pyrolizer2 at Butte College.
b) Walnut Shell Biochar made in NextChar 1X Pyrolizer6
c) Hard Wood Biochar made at Berkeley Olive Grove7 by On-Site Biochar Production;
d) Oregon Softwood Biochar made by Rogue Biochar8.
The procedure was carried out by first filling 30 mL crucibles about half full of each type of Biochar and covering the crucible with aluminum foil with a small hole punched in the top, and then, cooking the samples overnight at 150°C. Mass after measured before and after cooking and the weight loss is attributed to water present in the biochar prior to drying at 150°. Samples were then held for an hour at 250°C, 350°C, 450°C, and 550°C each, and mass measurements taken after the end of each temperature ramp (Figure 5). Mass loss was graphed as a function of temperature in order to compare the thermal stability of the different biochars.
Water holding capacity measurements of biochar: One of the most important impacts of adding biochar to existing soils is to improve the ability of the soil to capture, hold and deliver moisture to plants. This metric is called Water Use Efficiency. The interactions of raw biochars, prior to addition to soils, with excess water is an indication of the subsequent impact of the biochar in the soils. We measured the ability of biochars to take up excess water by the following procedure.
We conducted this experiment on four different varieties of biochar: walnut shells, rice hulls, OR Softwood, and Berkeley Olive Grove. We dried the biochar samples at 145-155°C, then transferred 4 fluid ounces to 12 oz jars. The density of the dried biochar was calculated by taking the mass of the biochar added to the 12 oz jar and divided by the 4 fluid ounce volume of the biochar. Water was added to about the three-fourths mark in the 12 oz jars and the biochar was wetted by heating the jars in a pot filled with water and boiling for 15 minutes. We then slurried the biochar and water, cooled the 12 oz jars and repeated the wetting procedure a second time to assure the micropores of the biochar are completely flooded with water. After cooling the second time we allowed the jars to settle for at least one hour to allow the biochar and the water to separate into two zones. The volume of the biochar zone is measured and the density of the wetted biochar, in grams of dry biochar per unit volume, is calculated and compared to the dry biochar density.
After settling, we slurried the contents of the jar and poured it into a coffee filter and allowed it to drain for one hour. We then took 30 mL porcelain crucibles and filled them half full of the drained biochar from the coffee filters, noting the weight of the wet biochar in each crucible. We then covered the crucibles with foil and punched a pin-sized hole in the top of the foil to allow vapors to exit. We then placed the crucibles in a drying oven at 150° C for four hours (see Figures 6, 7 and 8). After drying we weighed the crucible with the biochar, removed the biochar, and weighed the crucible again with the lid and the foil to get a weight difference representing the weight of the dry biochar in each crucible. After calculating the dry biochar weight, we calculated the water-holding ratio by subtracting the dry biochar mass from the wet biochar mass (to calculate the amount of water in the wet biochar mass), then divided the wet biochar water mass by the dry biochar mass, which represents the maximum amount of water a given weight of dry biochar can hold in the soil. The filtrates were also tested for pH using pH paper.
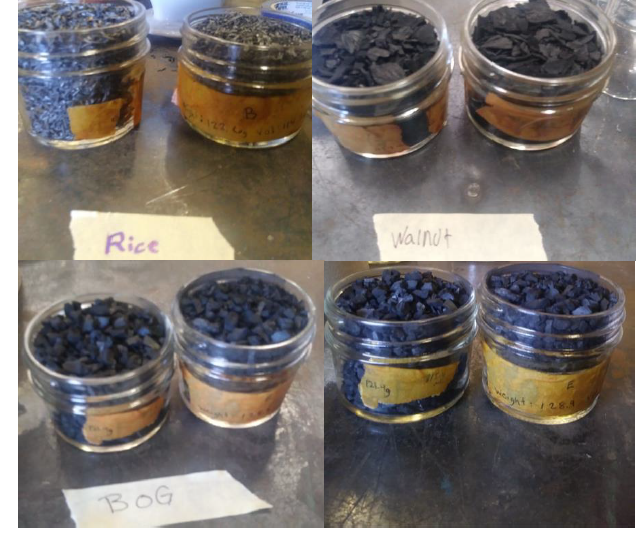
Figure 6. Biochars from rice hulls; walnut shells; hardwood biochar and softwood
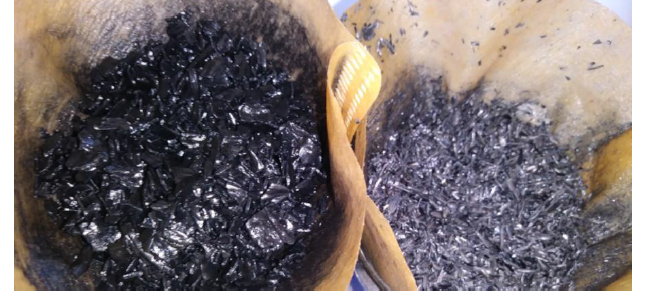
Figure 7. Softwood biochar and rice hulls biochar during water holding capacity test.
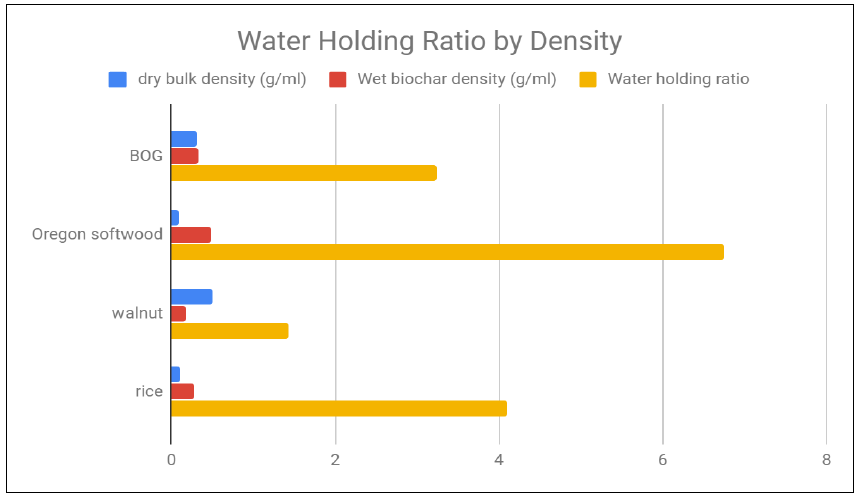
Figure 8. Relationship between water holding ratio and the bulk density of dry and wet biochar.
Propane gas adsorption test of biochar: In the propane gas adsorption experiment, we measured the gas adsorption ability of various types of biochars in an open workshop area lab at roughly 32°C ambient temperature (see graph in Figure 9). We connected a propane tank with a metering valve to a hose connected to a basketball inflation needle inserted into the bottom of a 6 oz soup can with a small hole punched in the top. The can was then filled approximately 3/4 of the way with a dried biochar sample and the weight of biochar measured. The propane is metered slowly into the biochar, with the excess propane exiting the top of the container. We ignited the propane (see Figure 10) being emitted through the top of the can. We allowed it to burn for 20 minutes with a minimum size flame exiting the container, extinguished the flame, and let the propane flow for another 10 minutes to allow the top of the container to cool. We then weighed the can with biochar and adsorbed propane, calculated the amount of propane uptake by the biochar and calculated the percent gain.
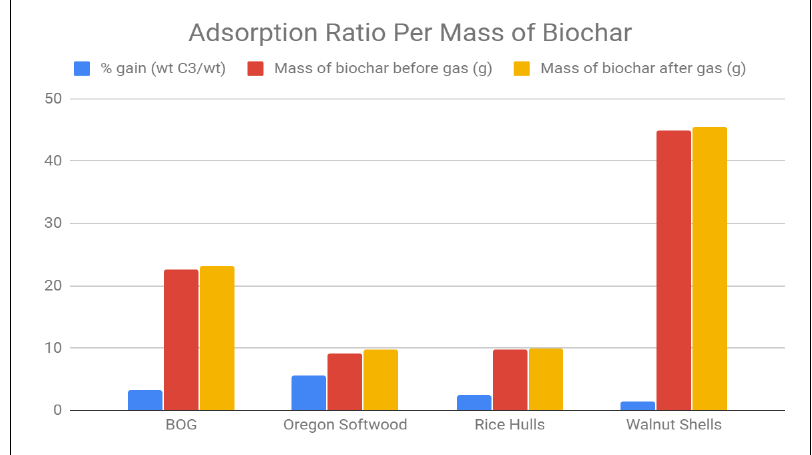
Figure 9. Adsorption percentage based on mass differences before and after gas saturation.
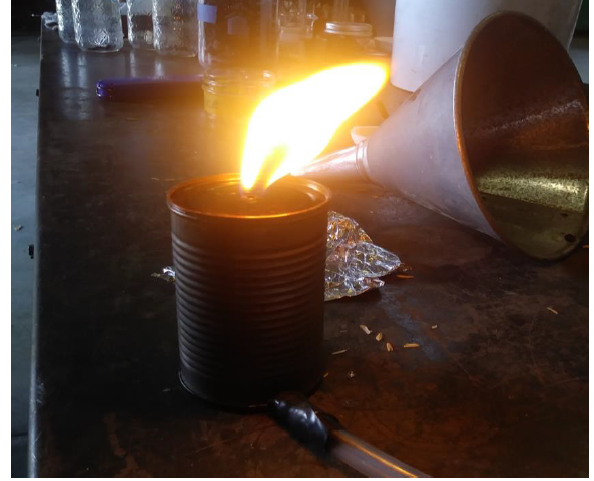
Figure 10. Biochar being saturated with propane.
Agricultural application of biochar at Morning Glory Farm, Oroville, CA: A field trial was conducted at Morning Glory Organics Farm in Butte Valley CA to evaluate the effect of biochar on soil biology and agricultural crops production. The crop chosen was sweet yellow onions. Soils were amended with compost over the range of 0 to 15 tons per acre and biochar was blended into the compost prior to soil addition over a range of 0 to 15 volume percent of the compost volume. The soil for the experimental plot was sampled and evaluated for texture, pH, and water holding capacity. Soil characteristics tested were found to be homogeneous (within one standard deviation of the norm for all test plots). The soil’s texture was found to be heavy clay with a pH of 7.50 ±0.07. The water holding capacity of the native soil was 40% ±5%. A biological analysis of the soil found it to be anaerobic with limited soil microbiology, mostly due to late rains and saturated soil. The compost was purchased from a local farm. It consists of organic compost with worm castings and lava rock. The pH of the compost was found to be 7.3 – 7.6. The water holding capacity of the compost was found to be about 45%. Addition of biochar to the compost had minimal impact on the pH, water holding capacity. The pH of the biochar was 9.7 – 10.1. Addition of biochar to compost increased the compost pH from 7.3 (compost alone) to 7.6 (15% biochar in compost by volume), which stabilized and did not increase throughout the length of the experiment.
The plot was set up as a 4x4 design of experiment with increasing biochar in an organic worm casting compost in one direction and increasing the total compost application rate in the other. Two controls were used, native soil and compost at increasing rates, without biochar. Due to the short season of this trial, 12 onions from each test plot were sampled, weighed and measured after 10 weeks of planting. Onions were sampled randomly from each treatment plot. Mass of the whole plants, greens, and stems with roots were measured and recorded. In addition to mass, the circumference of 5 onions of each group of 12 onions was measured. Average circumference and onion mass were calculated. Figure 11 shows Onions from the biochar/compost plots at Morning Glory Organics. From left to right: 5% biochar in worm casting compost at 10 tons of compost per acre, 5% biochar in worm casing compost at 5 tons of compost per acre, and 5% compost without biochar.
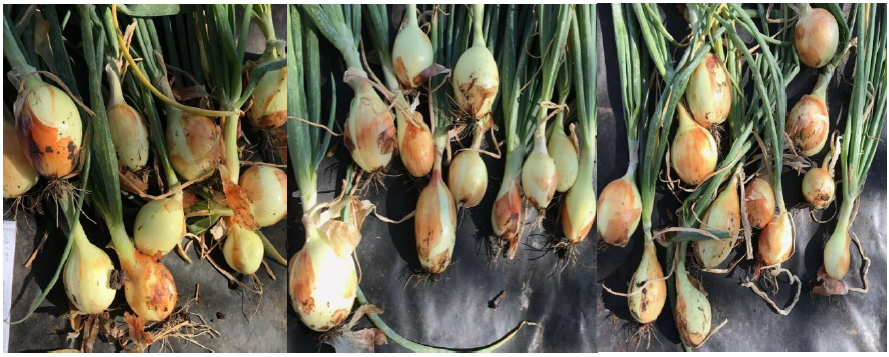
Figure 11. Onions from the biochar/compost plots at Morning Glory Organics
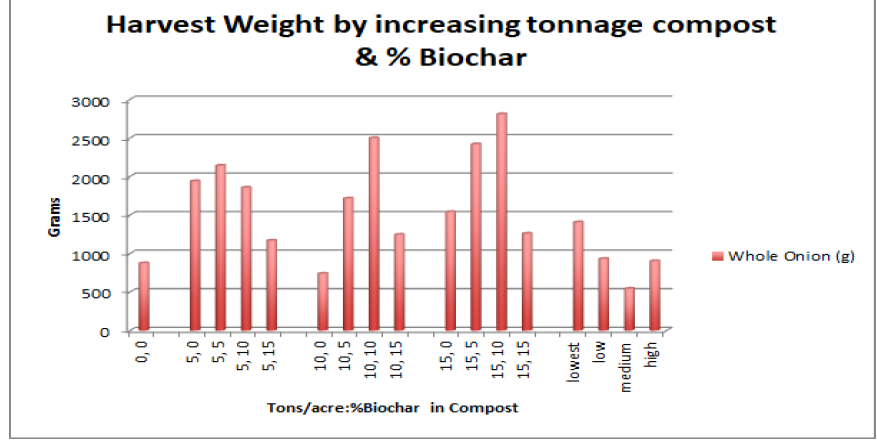
Figure 12. Weight of onions from 13 plots with different combinations of biochar and compost.
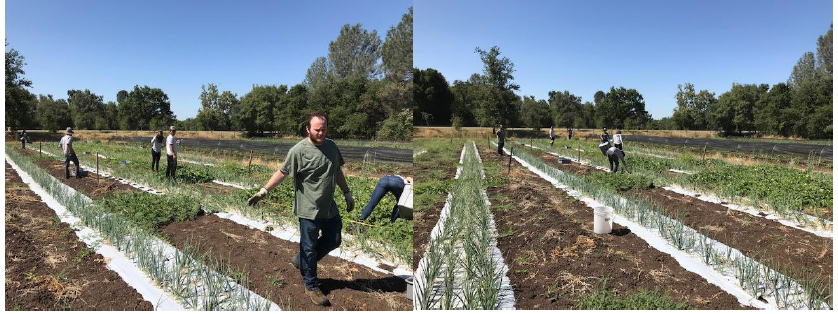
Figure 13. Interns picking onions at the Morning Glory Organics Farm.
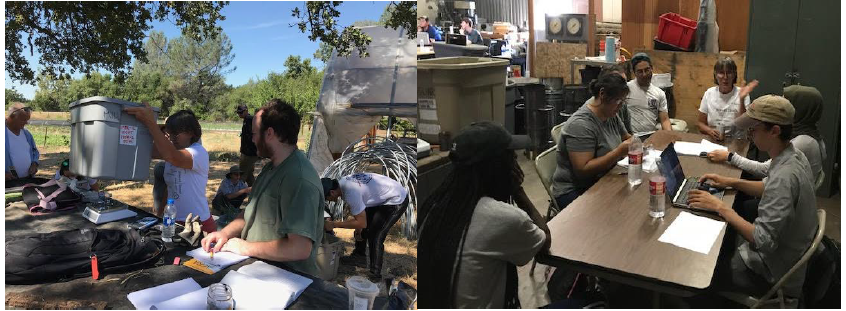
Figure 14. Onion harvest and lab data from field measurements led by mentor Allison Flynn.
Results and Conclusions of Biochar Agricultural Application Experiments: The biochar farm application studies confirmed the benefit of using biochar as a soil amendment. Our results show that increasing biochar and compost in test plots yielded higher mass and size over controls in our onion crop at harvest. This is true up to a point. The “sweet spot” of application rate and concentration of biochar in the compost in this study is 15 tons of compost per acre application rate of a compost that consists of 10% compost by volume. Beyond 10% biochar in compost even at lower application rates showed decreasing mass/harvest, although the harvest values for all biochar application rates were above yields for the native soil control. In terms of recommendations for application rates for potential customers, one needs to consider a cost basis of the amendments versus significant crop improvement. For this reason, one must examine the application rates and harvest mass differences at the high and low loading of biochar and compost applications. From our data, there is a significant difference in harvest mass between 5% biochar in compost and 10% biochar in compost. At 5% biochar loading, one needs to use 15 tons per acre to get equivalent results as from 10% loading at 10 tons per acre. The cost analysis of biochar and compost would suggest that the lower total compost loading would be more economical basis considering the low density of biochar and the overall effectiveness of the biochar/compost mixture.
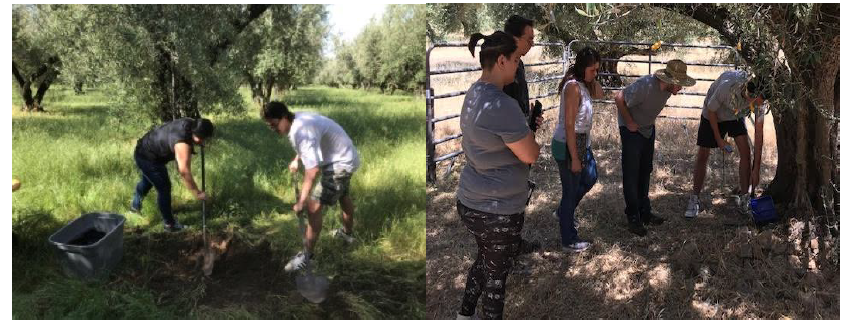
Figure 15. Measuring soil moisture at Berkeley Olive Grove
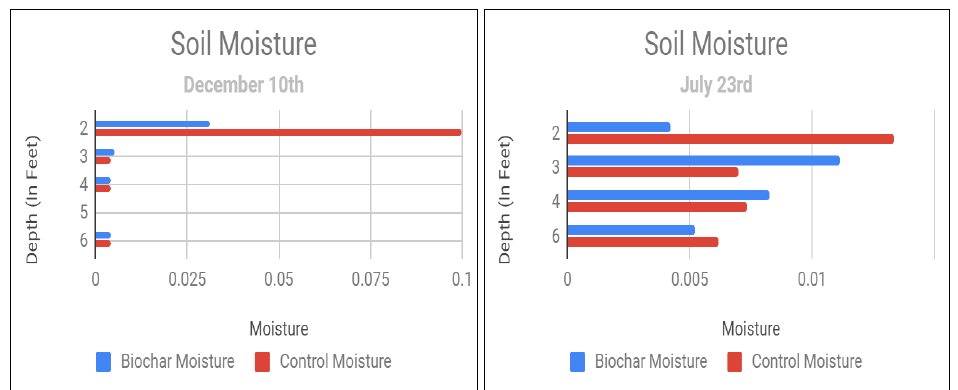
Figure 16. Moisture at 6, 4, 3, and 2 feet deep compared between soil with 2cm biochar layer.
Biochar Water Retention Field Experiments at Berkeley Olive Grove7 in Oroville, CA: This experiment was started in the summer of 2018 during first year of the grant. Data has been connected monthly since over an unusually wet and long rainy season through last winter and spring of 2019. Monitoring soil moisture content continued in two 100 sq ft test plots located side by side in the orchard, one treated with a 2 cm thick surface layer of OR Softwood Biochar and the control plot of natural soil with no surface treatment. IRROMETER Watermark monitors were used, with sensors buried at depths of 6 ft, 4 ft, 3 ft, and 2 ft along the center line of both test lots. Sensor moisture data was recorded monthly. Results of sample data recordings from December 2018, March and July of 2019 are presented in Figure 18.
On- Site Biochar Production Demonstrations in Concow, CA: Three privately owned properties were selected for these demonstrations off on-site biochar production in Concow, CA a small rural community near Butte College, one of the most severely affected area by the Camp Fire. The purpose these experiments was to demonstrate to private property owners how to produce biochar on site from biomass waste left over from the Camp Fire. There were three different methods demonstrated: Conservation Burn, Oregon Kiln and Circular Kiln. All three methods were developed by Kelpie Wilson of Wilson Biochar. All tree methods are intended to produce biochar on site with minimum smoke generation and the minimum use of heavy equipment. Onsite and at the demonstrations, student interns collected previously cut brush and small diameter trees damaged by the fire and assembling them into burn piles. The burn piles were constructed with larger pieces placed at the base, while smaller ones were put at top. The piles are lighted on the top, creating hot, smokeless fire, which burns downward. When quenched with water the charred wood turns into biochar. The process is illustrated in the following figures.
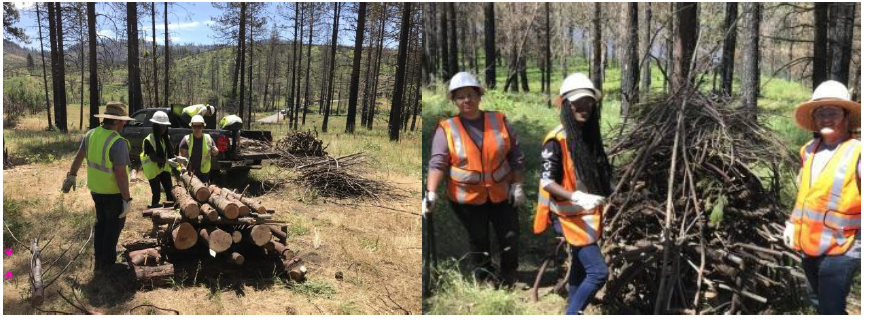
Figure 17. Interns building “Conservation Burn” pile from Camp Fire waste biomass.
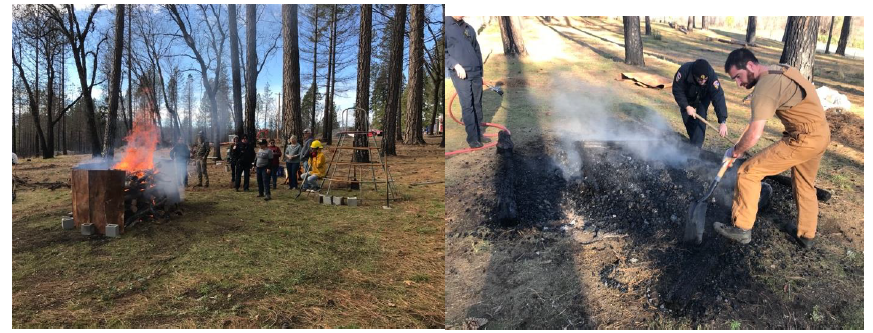
Figure 18. Interns performing a burn to recover biochar under the direction of Kelpie Wilson.
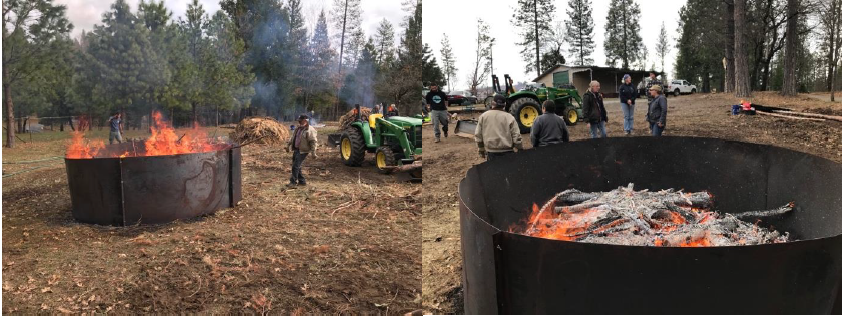
Figure 20. Interns using circular Oregon Kiln loading waste biomass from the Camp Fire.
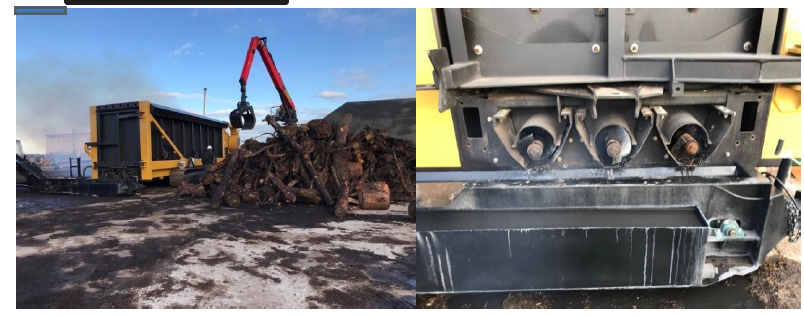
Figure 21. Container sized pyrolysis units in full operation producing biochar.
Large Size Biochar Production Container-Style Processing Demonstrations in Durham, CA: The Carbonator 6050 Material Processor by Tigercat Industries9 shown above in operation is a large-scale on-site biochar production unit, which was demonstrated in Durham CA, in February 2019, arranged by Butte College Biochar R&D Project.
Biochar R&D Workshop at Butte College Feb.22-23, 2019: The second annual Biochar R&D Workshop sponsored by MESA, was help with participation of the MESA student interns and invited biochar practitioners from across the USA, as well as local representatives of the agricultural community, forestry and fire safety officials involved in the Camp Fire clean-up and restoration process.
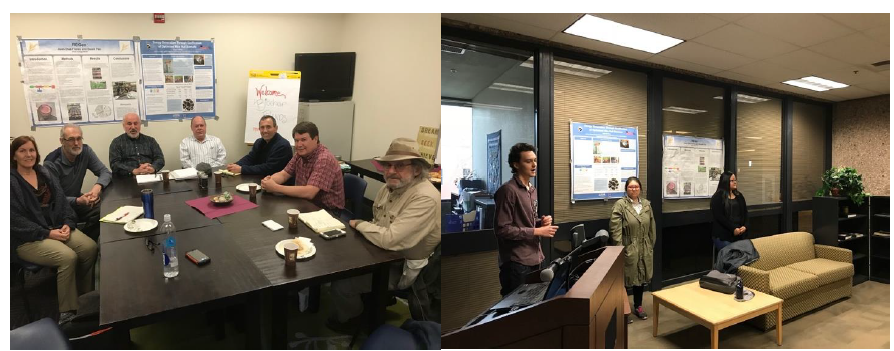
Figure 22. Small group meeting of biochar practitioners and student intern presentation.
Conclusions:
The following summary and conclusions all progress made from the aftermath of the Campfire (Wildland fire that destroyed Paradise, CA November 8, 2018) to the end of all activities in the summer of 2019 up to the global pandemic of COVID-19. Beyond February 2020 to present, there has been no additional scientific study due to an inability to access lab facilities safely and to the expected OSHA COVID-19 Prevention Program requirements.
Laboratory experiments were conducted by the student interns on one commercial and three biochar materials made during this project by various methods. The experiments followed Dr. Hugh McLaughlin’s measurements metrics (Ref. 2) intended to support commercial use of biochar, which he introduced to the interns himself during several visits to Butte College during this project. Water-holding capacity tests show that commercially available OR (Rogue) Biochar, made from softwood in a biomass power plant by Oregon Biochar Solutions8 in White City, OR, has the highest water retaining capacity. Biochar made from walnut shells at Butte College using Olivier Stoves, were found to have the lowest water retaining capacity. OR softwood biochar also had the highest gas adsorption capacity, and biochar made from walnut shells the lowest. These experiments concluded that the OR Biochar is the best choice for biochar agricultural applications and was selected for use in consequent agricultural biochar application experiments in this project.
It should be noted that biochar made on-site from olive wood by so called “Conservation Burn” at Berkeley Olive Grove7 in Oroville, CA, designated as BOG in the laboratory water absorption and gas adsorption measurement results, performed nearly as well as the OR softwood biochar. This is a significant finding in view of the potential large scale on-site production of biochar from the huge amounts of waste woody biomass left over from the Camp Fire of 2018 and from more recent forest fires. Demonstration of on-site-biochar production by this project may be its most important and lasting impact. On-site-biochar-production is currently being used by the Butte County Fire Safe Council in on-going post fire cleanup and forest management programs. Research and development of biochar was revealed to homeowners and fire safety committees as an application to post-Camp Fire recovery. Presentations received a favorable response in regard to converting woody biomass waste to biochar on-site, as effective debris removal that can also provide resources for community restoration, such as regenerative agriculture. The farm study confirmed this benefit, as increasing biochar and compost in test plots yielded higher mass and size in crops. Ideal soil amendments, in tons of compost per acre by the percentage of biochar in compost (tons, %), were 15,10 and 10,10. Based on the data a trend appears in plots with ratios of ten tons of compost per acre at ten percent biochar, and fifteen tons compost per acer at ten percent biochar. Compared to the control group of zero tons of biochar and zero tons of compost, planting with a composition of 15 tons of compost per acre at 10 percent biochar significantly increases the harvest weight of the onions. In soil amendments of 15,10 and 5,5, the difference in harvest mass is 1000 grams. This means 10% biochar is an ideal amount for the increasing tonnage of compost. Crop-quality diminishes past that curve. The control plot, with varying amounts of compost and no biochar, also had weak yield.
Soil moisture (IRROMETER10) readings at Berkeley Olive Grove showed that without char, soil’s moisture correspondingly increases with decreasing depths. With char, the soil is moister at 3 feet (ft) than at 6 ft but loses moisture drastically at 2 ft. Comparison between the test and control plots is inconclusive; therefore, further study is needed.
In summary, students were trained and performed the following:
• Conduct pyrolysis experiments to study various biochar production methods and measure the percent of biochar product as a volume percent of raw material.
• Conduct analysis and characterization of various biochar samples in accordance with procedures developed by Hugh McLaughlin, PhD6. (Ref. 3), including:
• Dry biochar procedures: measuring weight loss at temperatures, 150, 250, 350, 450 and 550 degrees Celsius.
• Wetted biochar procedures: measuring dry bulk density, wetted biochar density, water-holding ratio, and determine wet biochar pH levels.
• Adsorption procedure: to measure adsorption of propane gas by various biochars by measuring an increase in the mass of the biochar due to propane adsorption as a percent of its original mass.
• Complete a biochar agricultural application field experiment started in April 2019 and completed in July 2019 with harvesting and gathering harvest weight data to indicate the effects of various applications of biochar and compost on growing spring onions at Morning Glory Organics7 farm in Oroville, CA.
• Continue water retention experiments at Berkeley Olive Grove7 which were started in the Summer of 2018 and soils moisture measurement data have been collected since monthly using a digital IRROMETER watermark sensors in the soil at various depths.
• Conducted field work during the summer work project in July 2019 in preparations and performance of on-site biochar production experiments during January 2020 in the Camp Fire burn area in Concow, CA.
• Carried out Conservation Burns and other on-site-biochar-production experiments, including the use of so called “Oregon Kilns” developed by Kelpie Wilson5.
• Participated in and made presentations at the second annual Biochar Workshop at Butte College, February 22nd & 23rd, 2019.
References:
1Pacific Gas and Electric Company Better Together Giving Program https://www.pge.com/en_US/residential/in-your-community/pge-gives-back/giving-locally/giving-locally.page?WT.mc_id=Vanity_givinglocally. Recipient list 2017 at https://www.pge.com/pge_global/common/pdfs/residential/in-your-community/pge-gives-back/giving-locally/Community-Investment-Program-Grantees.pdf
2Paul Olivier, PhD, Making Waste Our Greatest Resource https://documents.pub/document/tlud-gasifier-in-vietnam-by-paul-oliver.html at https://cleancooking.org/wp-content/uploads/2021/07/54-1.pdf
3Paradise Camp Fire 2018 at https://en.wikipedia.org/wiki/Camp_Fire_(2018)
4North Complex Fire 2020 at https://en.wikipedia.org/wiki/North_Complex_Fire
5Kelpie Wilson, A Visionary Concept for a Carbon Conservation Corps (CCC), Wilson Biochar Associates at www.wilsonbiochar.com
6Hugh McLaughlin, PhD, PE, CTO – NextChar, LLC. Basic Biochar Metrics, Version X, November 8th, 2016. Nextchar at http://www.drtlud.com/wp-content/uploads/2016/11/Baseline-Biochar-Metrics-Ver-X.pdf
7Berkeley Olive Grove, Oroville, CA at www.berkeleyolivegrove.com
8Oregon Biochar Solutions, White City OR at www.chardirect.com
9Tigercat Material Processing Equipment, Brantford, Ontario, Canada at https://www.tigercat.com/product/6050-carbonator/
10Irrometer, Inc., Riverside, CA Watermark Series Measurement Devices Whitepaper at https://www.irrometer.com/pdf/MSU%20EXT%20Watermark%20Measurement%20Devices.pdf
Progress and Final Reports:
Original AbstractP3 Phase I:
Energy Generation through Gasification of Optimized Rice Hull Biomass | Final ReportThe perspectives, information and conclusions conveyed in research project abstracts, progress reports, final reports, journal abstracts and journal publications convey the viewpoints of the principal investigator and may not represent the views and policies of ORD and EPA. Conclusions drawn by the principal investigators have not been reviewed by the Agency.