
Grantee Research Project Results
2014 Progress Report: How will cleaner cooking and lighting practices impact regional air quality and climate in the Sahel of Africa?
EPA Grant Number: R835424Title: How will cleaner cooking and lighting practices impact regional air quality and climate in the Sahel of Africa?
Investigators: Hannigan, Michael P. , Oduro, Abraham , Monaghan, Andrew , Wiedinmyer, Christine , Dickinson, Katie , Hayden, Mary , Dukic, Vanja
Current Investigators: Hannigan, Michael P. , Dukic, Vanja , Wiedinmyer, Christine , Dickinson, Katie , Hayden, Mary , Monaghan, Andrew
Institution: University of Colorado at Boulder , Navrongo Health Research Center , National Center for Atmospheric Research
Current Institution: University of Colorado at Boulder , National Center for Atmospheric Research , Navrongo Health Research Center
EPA Project Officer: Keating, Terry
Project Period: June 1, 2014 through May 31, 2017 (Extended to December 31, 2018)
Project Period Covered by this Report: June 1, 2014 through May 31,2015
Project Amount: $1,500,000
RFA: Measurements and Modeling for Quantifying Air Quality and Climatic Impacts of Residential Biomass or Coal Combustion for Cooking, Heating, and Lighting (2012) RFA Text | Recipients Lists
Research Category: Climate Change , Air Quality and Air Toxics , Tribal Environmental Health Research , Air
Objective:
The overarching goal for this proposed work is to develop a better understanding of the social, physical, and climatological determinants of regional emissions and air quality linked to cooking and lighting practices in the African Sahel. To reach that goal, we have four specific objectives: (1) test hypotheses about the impact of different cooking technologies on behavior and emissions at the local scale, (2) develop a comprehensive set of emissions measurements from traditional cooking and lighting practices as well as from cleaner burning alternatives, (3) develop realistic scenarios of regional-scale technology adoption and emissions by scaling up the observed social data and derived emissions relationships, and (4) assess how clean cooking and lighting practices could impact regional air quality and climate.
Progress Summary:
Since this research project builds off an existing NSF CNH project, our team was really able to hit the ground running in our first year. More details are presented, but the exciting news is that we were able to start field measurements in the first month, so even though we just finished Year 1, we have already created a year of measurements in the urban areas. As such, we are ahead of our proposed timeline and anticipate that this will allow us to undertake more field measurements than originally planned. Our current plan is to add field emission measurement at alternative areas with the focus being the more site in the Sahel of Africa.
For the NSF CNH project, our team implemented a stove intervention study in 200 rural homes in the KN District in northern Ghana (see the map below). We used two stoves for each intervention home: a clay liner rocket stove built in Ghana and a forced draft gasifier stove powered by a battery that was solar panel charged. For that study, we were measuring CO and PM2.5 exposure to the cook and other residents in a subset of the homes. We were also surveying the participants to understand behavior. For the EPA project, we added 50 homes in the urban areas, but without stove intervention. We added ambient monitors in the urban area. To further our assessment of emissions, we increased our field measurement scope to more samples numbers for each type of stove, added coal stoves to the measurement plan, upgraded our stove use monitoring, and added emissions measurements of other prominent sources including lighting. New surveys were developed to understand behavior in the urban areas as well. At the close of Year 1, we had completed the bulk of our field measurements. By the midpoint of Year 2, we should be done with data collection in the KN District. Our measurement focus will shift to other regions of the Sahel with the goals of more broadly understanding the significance of cooking and lighting emissions on general air quality. Below we provide an overview of the field measurements to date.

Field Measurement Overview:
Several data collection methods are being used to measure cooking behavior, emissions, exposure, and air quality in urban and rural environments. These field measurements will be used to improve emission inventories, which will then be used to model regional air quality under various scenarios.
Cooking behavior assessments:
Understanding how the introduction of new cooking technologies affect cooking behaviors is essential in order to understand whether and how these technologies subsequently affect other key outcomes like emissions, exposure, and health. To date, we have collected stove use information from 45 households and 107 different stoves. We are assessing their use over time and their patterns of use by invention study arm and urban/rural setting. We have also been able to compare the SUM results with the cross-sectional data provided by quarterly surveying. Analysis of these trends, comparison of data collection methods, and recommendations on stove adoption in the region will be presented in the soon-to-be submitted paper, "Multi-method assessment of cookstove stacking in Northern Ghana" (Piedrahita et al., 2016, in preparation).
Substantial effort was put into assessing cooking event identification methods because the cooking event identification algorithm was sensitive to parameter selection in our data. This was due to indoor-outdoor movement of stoves and a preference for cooking outdoors during the non-rainy season study environment, which made it difficult to identify cooking events with a high degree of confidence. We may thus have falsely identified cooking events due to fast radiative heating from sunlight, predominantly during the mid-day hours. We took steps to understand our measurement uncertainty by performing sensitivity analyses. We also explored other modeling approaches by developing training data sets in which a stove was outfitted with a SUM, and also with a reference measurement (a thermocouple, which provides more precise information). We found that logistic regression, and neural network methods performed better than the traditional cooking identification methods. However, uncertainty remained, so we continued to improve the thermocouple measurement method, improving robustness and reliability, and identifying low-cost suppliers of bulk equipment.
Results from surveys and SUMs were in good agreement on the general usage trends, though day-to-day matching was not very high. Some categories, like three-stone fires had worse matching rates due to the difficulty of monitoring such stoves with the selected stove usage monitors. We found that using multiple stoves each day, a practice known as stacking, is common practice within each intervention group, and that the group given one Philips and one Gyapa stove has the lowest level of traditional stove use. The Gyapa stoves were used more frequently than the Philips stoves in almost every household, and they were used for quite different purposes. The Gyapa stoves were used for most every type of cooking, whereas the Philips stoves were not used for traditional meals that require vigorous stirring, like tuo-zaafi, rather for boiling of water and soup. Subsequent personal air pollution exposure results are being processed and will answer the question of whether these changes in cooking behavior were sufficient to lead to a significant change in exposure, or whether the extent to which we have seen cookstove stacking has negated the improved stove pollution reductions.
As we prepared for the start of Year 1, we identified beacons as promising emerging commercial technology that we believed could be of interest in the field of exposure assessment. Bluetooth beacons allow us to approximate distance from the participant to the cookstoves at each home. They work by continuously transmitting their addresses and other unique identifying information using Bluetooth low energy (BLE). An appropriate mobile phone, worn by the participants in our study along with their air sampling equipment, is used to record the beacon’s signal strength. The signal strength can then be converted to a distance measure by using a calibration curve, thereby providing an estimate of distance from the phone-to-beacon, or in our specific case participant-to-cookstove. Bluetooth signal strength is sensitive to path effects like room geometry, and obstructions in the measurement area. With this in mind, many applications use distance categories of "immediate," "near," "far," and "out of range," which generally translate to "within a few cm," "within 2m," "within 10m," and "within signal range (range is up to 100m)." This means that the "out of range" category still has useful distance information and is technically within signal reach, but not useful for precise localization purposes. Here, we have used these distance categories as well as the distance measurement in meters.
A custom Android application was written and installed on our phones to log the Bluetooth data, as well as GPS, GPS accuracy, and acceleration. The Bluetooth data logged included the address of any Bluetooth LE device within range, and the received signal strength indicator (RSSI), a relative measure of signal strength that can vary by Bluetooth chipset and manufacturer. In Year 1, we collected and analyzed over 100 48-hour exposure samples along with beacon measurements. These samples included Bluetooth beacon proximity data as well as real-time carbon monoxide. A subset also included integrated PM2.5. This time-location data was shown to improve the performance of models predicting personal exposure from micro-environment exposure. We found that although there is high variability in the exposure-distance relationship, with some users receiving most of their exposure at close proximity to the stove, and others receiving most of their exposure away from home, the overall trend showed a strong exposure relationship with distance to the cooking areas, and limited other outside sources of pollution affecting our measurements. Further assessment of this approach will occur in Year 2.
Emissions measurements:
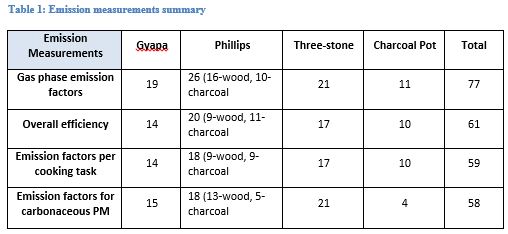
Cookstove. Continuous cooking emissions were measured in different households from all clusters selected in the study, urban and rural. The cooking events that were assessed were real-world, meaning that we monitoring during cooking of the meal served to the family and cooked by the cook of the household. A homemade emissions measurement system was used to measure these emissions, and we assessed four types of stoves: three-stone fires and charcoal pots (traditional stoves) plus the Gyapa and Philips. The measurement system operates similar to the PEMS, the portable emission measurement system designed by Aprovecho Research Center. The emission pod uses low-cost sensors to measure real-time emissions of CO, CO2, NO, NO2, and TVOCs as well as temperature and relative humidity. Total suspended particles are collected on 90 mm quartz filters for EC/OC analysis of the samples. The time series of gas emissions are measured during the entire cooking process of each sample for one meal. In addition to emissions, we also assessed the heat transfer efficiency for each cooking event. Samples span a wide variety of meals and cooking conditions (season, fuel type, meal size, ambient temperature). A summary of the emissions samples and stove parameters calculated such as emission factors and stove efficiency can be found in Table 1.
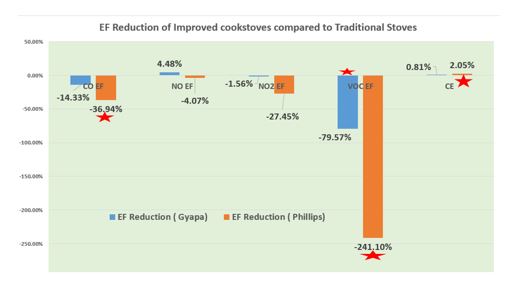
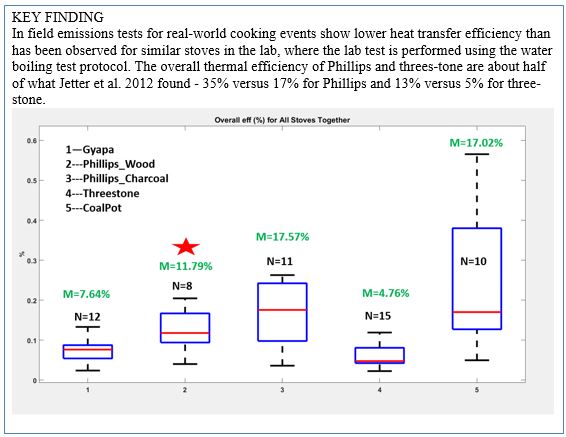
A summary of the results from the field cook stove emissions testing, titled, “Emission Factors and Efficiency from In-field-Measurements of Traditional and Improved Cookstoves in Northern Ghana," is near completion. This paper compares emission factors and stove efficiency for the four types of stoves: two traditional stoves versus two improved stoves. Our results shows that forced draft gasifier stoves can reduce CO emissions compared to natural draft stoves, which confirms the underlying conclusion from previous similar studies. The figure below highlights these results. Philips, which is a forced-draft, gasifier stove, reduces CO, much more significantly and has a much higher combustion efficiency (MCE) than Gyapa, which is a natural-draft stove.
Other significant sources. To better understand the relative impact of cookstove emissions, our team is also assessing real-world emissions from other significant sources in sub-Saharan Africa. We plan to continue to measure emissions in Ghana in west Africa, in Rwanda in central Africa, and in Tanzania in east Africa. These sampling efforts are looking to characterize other possible sources of emissions in urban settings. Thus far, we have sampled kerosene lighting and roadway emissions in Kigali, Rwanda. We have also measured emissions from trash burning, charcoal making, commercial cooking, and roadway emissions in northern Ghana. More emission sampling is planned for Years 2 and 3. These emissions are measured using a small portable emission-pod (dubbed E-Pod), which uses low-cost sensors to measure real-time emissions of carbon monoxide (CO), carbon dioxide (CO2), nitrogen oxide (NO), nitrogen dioxide (NO2), volatile organic compounds (TVOCs), temperature, and humidity along with total suspended particles (TSP), which are collected on 47 mm quartz filters. The Table below summarizes the sampling events that have been done to date.

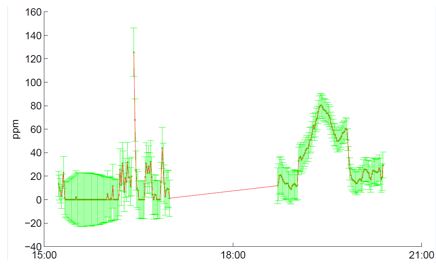
Below is an example of some of the time series of gas phase emissions of CO for both roadway emissions and kerosene lighting. The x-axis shows the sampling local time while the y-axis shows the CO concentration levels in parts per million (ppm). The roadway emissions started from 15:22 pm to about 17:00 pm. From 15:22 pm to 16:10 pm, the pod was situated at one of the corners of the road with CO averaging 17 ppm over an hour of sampling. The huge spike that reaches 123 ppm is suspected to be that of a huge truck of a diesel operating vehicle that passed by near the inlet o the sampler. From 16:10 pm to 5:10 pm, the pod was moved in the middle of an intersection joining 4-roads which explains the increase in CO levels to 25-ppm over an hour-long of monitoring. On the right side of the figure shows the CO levels measured from kerosene lighting inside the household from 19:00 pm to 19:50 pm at night. Over this period, the CO averages 41 ppm for about an hour of sampling. These preliminary levels of CO look very high given the fact that people, including children in the household, are sitting near the source for about 2 hours any night. More work is being done to process these results, including assessment of the uncertainty of these measurements.
Personal exposure and microenvironment monitoring:
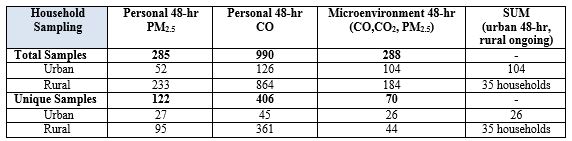
Household sampling visits are conducted in 48-hour sampling periods. Typically, six households are sampled every 2 weeks (three urban and three rural). Stove use, personal CO and PM2.5 exposure, microenvironment CO, CO2 and PM2.5, are measured in households during each deployment. A summary of these activities is presented in the table below. During each 48-hour sampling period, the following measurements are taken: personal PM2.5 exposure (for participants over the age of 4), personal CO exposure, activity with pedometers or accelerometers, and microenvironmental monitoring in the cooking area(s). To assess personal exposure to pollution from biomass combustion and other sources, study participants wear real-time CO monitors (EL-USB-CO300, Lascar Electronics) with a 1-minute sampling frequency. Personal PM2.5 exposure is collected on quartz filters for EC/OC and organics analysis. Preliminary personal carbonaceous PM2.5 is predominantly organic and more than 60% of the 48-hour time integrated concentrations surpass the WHO 24-hour mean guideline of 35 µg m-3. Organic analysis, using a GCMS (Series 5975, Agilent), of the first 79 samples was completed quantifying more than 70 individual organic species extracted from the filters. Additional personal PM2.5 data are yet to be analyzed. The microenvironment monitor (G-Pod) measures CO, CO2, and PM2.5. The CO measurement uses the same sensing principal as the Lascar CO monitors, electrochemical sensors, and CO2 is measured with a low-cost NDIR sensor (S200, ELT Corporation). Each G-Pod is placed 1 meter off the ground, and 1 meter away from the two most-used cookstoves or cooking areas. The two G-Pods tailored for urban use also include photoionization detectors (PID Silver, Baseline-Mocon). To further investigate linkages between emissions, stoves, exposure and health, participants’ proximity to stoves and location metrics were added to the sampling strategy for the EPA project and described above.
Regional air quality monitoring:
In order to understand spatial variability of pollution and to help identify pollutant sources, G-Pods are deployed throughout the study region, see the map on page 2. The G-Pods are configured to measure O3, CO, NO, and NO2 using Alphasense B4 electrochemical sensors. O3, CO, and NO2 are also measured using metal oxide sensors (MOx) from SGX Technologies. CO2 is measured using an NDIR sensor (ELT-S200). Some of the G-Pods also measure VOCs using photoionization detectors (PID Silver, Baseline-Mocon), and wind speed and direction (Sparkfun). The G-Pods are mounted 3-4 meters above ground at 6 clinics that are part of the National Health Service, in Paga, Kandiga, Kologo, Chiana, Northern Navrongo, and South-West Navrongo at the NHRC compound. At the start of the EPA project Year 1, an additional G-Pod was installed in the Navrongo town market, an urban environment that experiences high vehicle and human traffic, especially every third day, a market day, year round. The NHRC also serves as the home base of the study, and houses reference quality instruments in addition to the low-cost monitors. This lab is equipped with a Thermo 48 carbon monoxide monitor set to re-zero every hour using a heated Pt-Al catalyst. O3 is measured with a 2B Technologies Model 202, while NO and NOx are measured with 2B Technologies Models 401 and 410. CO2 is measured with a Li-COR 840A. The figure below shows the background profile of O3, CO, and CO2 from the past 2 years located at the NHRC lab. In general, the ambient monitors showed much lower levels of combustion related pollutants than we are observing in the homes. The figure to the right below illustrates the diurnal background CO level in Navrongo dominated by two peaks corresponding to higher biomass burning activity at dawn and dusk.

Journal Articles on this Report : 1 Displayed | Download in RIS Format
| Other project views: | All 17 publications | 11 publications in selected types | All 11 journal articles |
|---|
| Type | Citation | ||
|---|---|---|---|
|
|
Dickinson KL, Kanyomse E, Piedrahita R, Coffey E, Rivera IJ, Adoctor J, Alirigia R, Muvandimwe D, Dove M, Dukic V, Hayden MH, Diaz-Sanchez D, Abisiba AV, Anaseba D, Hagar Y, Masson N, Monaghan A, Titiati A, Steinhoff DF, Hsu YY, Kaspar R, Brooks B, Hodgson A, Hannigan M, Oduro AR, Wiedinmyer C. Research on emissions, air quality, climate, and cooking technologies in northern Ghana (REACCTING): study rationale and protocol. BMC Public Health 2015;15:126. |
R835424 (2014) |
Exit |
Relevant Websites:
Research of Emissions, Air Quality, Climate, and Cooking Technologies In Northern Ghana Exit
Progress and Final Reports:
Original AbstractThe perspectives, information and conclusions conveyed in research project abstracts, progress reports, final reports, journal abstracts and journal publications convey the viewpoints of the principal investigator and may not represent the views and policies of ORD and EPA. Conclusions drawn by the principal investigators have not been reviewed by the Agency.