
Grantee Research Project Results
Final Report: Vision-Based Monitoring and Control of Construction Operations Carbon Footprint
EPA Grant Number: SU835352Title: Vision-Based Monitoring and Control of Construction Operations Carbon Footprint
Investigators: Golparvar-Fard, Mani , Marr, Linsey C. , Khosrowpour, Ardalan , Zelkowicz, Moshe , Khare, Peeyush , Haratmeh, Bardia Heidari
Institution: Virginia Tech
EPA Project Officer: Hahn, Intaek
Phase: I
Project Period: August 15, 2012 through August 14, 2013
Project Amount: $15,000
RFA: P3 Awards: A National Student Design Competition for Sustainability Focusing on People, Prosperity and the Planet (2012) RFA Text | Recipients Lists
Research Category: Pollution Prevention/Sustainable Development , P3 Awards , P3 Challenge Area - Safe and Sustainable Water Resources , P3 Challenge Area - Sustainable and Healthy Communities , Sustainable and Healthy Communities
Objective:
The objective of this research project is to create a new method for benchmarking and automated monitoring of onsite construction emissions and carbon footprint through advances in computer vision, construction management, and environmental engineering. The purpose is to provide construction practitioners – owners, contractors, and tradesmen – and government agencies with easy-to-use and inexpensive tools to benchmark and continuously monitor onsite construction operations. These tools enable them to devise strategies to minimize the environmental impacts of construction operations without lowering operational efficiency. Given that 20% of the Green House Gas (GHG) emissions are produced during the construction phase of a project [1-5], and current productivity rates for a $900 billion industry are at a 15-year low point [6], even small gains in efficiency could lead to significantly lower environmental impacts and enormous cost savings. Our work in particular is driven by the hypothesis that the environmental impacts of a construction project can be significantly reduced with tools that better characterize the extent to which construction resources are being fully utilized. As part of the scope of this project, we have developed a preliminary set of tools that enable benchmarking construction carbon footprint and emissions, tracking and interpretation of activities performed by construction equipment, calculating actual construction emission and carbon footprint, comparison between their actual and benchmarked performance values, and visualization of opportunities to improve management. Our team is uniquely suited to pursue this multidisciplinary line of research, with our combined expertise in computer vision and construction management (PI Golparvar-Fard) and environmental engineering (PI Marr). We are also in a unique position to impact construction practice through collaborations with several industry partners, notably Turner Construction (the top-ranked construction management company in the United States, giving us access to the World Trade Center Transportation Hub in New York City, the San Francisco 49’ers Stadium, and the Istanbul Development Center in Turkey).
Current state of construction emissions and practice of emission monitoring - The construction industry is the third highest producer of GHG emissions among all industrial sectors [7]. More than twenty percent of these emissions are produced during the construction phase of a project [1- 4,8]. This amount of energy consumption and air pollutant emissions is equal to that of all residential households in the state of California [1-2,9]. The relatively large amount of emissions produced in a short period of time reveals the importance of reducing this source of emission during the construction phase. Although the rather new environmental regulations for equipment are effective in the reduction of construction emissions, yet they are rapidly becoming a concern for the industry [7,10]. These regulations are mainly focused on tightening the controls on equipment rather than improving operational efficiencies. For example, instead of finding ways to benchmark and monitor efficiency of onsite operations, the alternatives for reducing emissions are purchasing new equipment and/or upgrading older machinery. Non-compliance with these new standards can also result in penalties such as the loss of funding for future highway projects for heavy civil contractors. The controversial issues associated with such regulations have required the Associated General Contractors of America (AGC) and the California Air Resources Board to postpone enforcements of these emission rules until 2014 [1,7,10,61]. Proper enforcement of any emission control or carbon footprint reduction policy requires easy-to-use and cost-effective tools that support construction practitioners to benchmark and monitor the environmental impacts of their construction operations. It also requires availability of validation data on emissions of each construction operation to help adopt the best emission control and carbon reduction practices. Despite their benefits, there are several challenges associated with the current methods for benchmarking and monitoring construction emissions, including: (1) Limited available field data for the analysis of equipment fuel use and emissions during construction operations [11-16]. Although EPA [17], Clean Air Technologies International [18], and Gautam et al. [19] have conducted onboard measurements of emissions from equipment, not all of the data were quality assured nor are available for practitioners use [4,14]; (2) The lack of established relationships between the operational duty cycles versus fuel use and emissions [1,3,12,20] which does not enable application of ‘activity analysis’ methods; (3) Effective visualization tools that can communicate environmental impacts [1,9,16]. Without a systematic construction monitoring, excessive carbon footprint due to low operational efficiency cannot be minimized.
Problems with current practice in construction activity monitoring- Activity analysis – continuously measuring and improving the amount of time that equipment spend on actual construction – is crucial to help management identify onsite performance inhibitors and excessive emissions, develop plans to reduce these issues, and measure improvements as a result [38,39]. The need for continuous activity analysis is well addressed by Construction Industry Institute (CII) [39] and National Research Council (NRC) [90]. Despite the benefits of activity analysis, manual implementation of these techniques is labor-intensive, costly, and prone to error [37,38,57,75]. The significant amount of information which is required to be manually collected from various locations on a construction site may adversely affect the quality of the analysis [68,70], and (2) according to National Institute of Standards and Technology (NIST), minimizes the opportunities for continuous benchmarking and monitoring which is a necessary step for performance improvement [91]. In addition, current manual methods which are occasionally conducted are only applicable to the enterprises in which the manufacturing process is repeated routinely. In the case of one-time running state of construction projects, without automated and near real-time data collection, such methods will have limited benefits [92]. In addition to the need for continuous analysis, another grand challenge as identified by ASCE, is devising methods that enable querying information about construction performance [93]. Owners, contractors, subcontractors, and trades need easy and quick access to information about productivity and emissions of their resources, so that the process of on-site decision making for improving performance could be further enhanced and ultimately efficiency of operations are maximized [90]. Lack of access to such information constitutes part of the reason of the high environmental impacts and low productivity of the construction industry, and can adversely result in schedule delays and cost overrun [94-95]. Improving productivity of the construction industry which is at a 15-year low point requires continuous benchmarking and monitoring [6]. Even a 10% gain in productivity can minimize one- third of the resources as well as their environmental impacts wasted in non-productive activities and double contractor’s net profits [6,15-16].
The proposed research to incrementally and inexpensively sense, analyze, and visualize emissions and productivity using site video streams and emission models has transformative potential for the construction industry [15-16,60,93-95], and can support wide implementation of emission control and carbon footprint reduction policies at the construction project level. The objectives of this research further support two of the 21st century grand challenges identified by the National Academy of Engineering [96]: (1) the need for more automation in the construction sector, through advances in computer science and (2) the need for enhanced visualizations, through advances in virtual and augmented reality. Any efforts towards automating assessment of emissions and productivity will increase the percentage of projects being automatically monitored in a timely fashion and result in minimized adversarial environmental impacts, schedule delays and cost deviations. Considering that construction is a $900 billion industry [97], each 0.1% of increase in efficiency can lead up to $900 million in savings. Since the proposed method is based on use of existing information, application of low-cost camera systems, it will not add any extra task to project management, which further justifies the perceived benefits and practicability for adoption of the proposed research by the Architecture/Engineering/Construction industry.
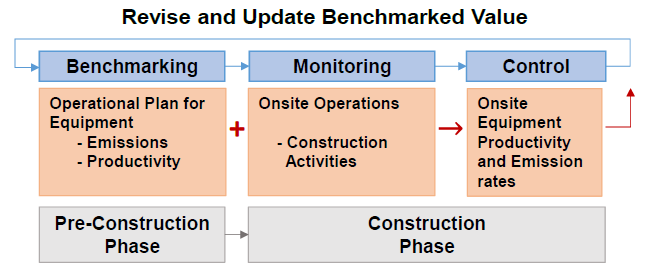
Figure 1. The cycle of benchmarking, monitoring, and control in our proposed method.
How this project will make activity and emission monitoring more effective - Figure 1 shows the cycle of benchmarking, monitoring, and controlling onsite construction emissions that we hope to enable with our proposed work. This cycle begins with the synthesis of a benchmarked performance model. This benchmarked performance model contains three types of data that are available prior to construction: (1) equipment: the expected quantity and type of construction equipment that will be used; (2) performance rates: expected emission and productivity rates. The productivity rates will be calculated based on contractor’s historical data (or if unavailable, from manufacturer’s data). For emissions, we are established an emission model to represent GHG emission and carbon footprint rates. As part of ongoing work, we are exploring to establish this model as a function of different types and age of equipment, and operational conditions (e.g., load, operational path, weather); and (3) operational plan: a description of the equipment to be used for construction activities and of their connection to the project schedule. Taken as a whole, the benchmarked performance model - assembled using a Discrete Event Simulation (DES) - provides a comprehensive temporal description of the expected state of onsite construction emission and productivity rates at any given moment within the project timeline. Given a large set of video streams that have been collected from cameras distributed throughout the site, we can use this model to perform the following tasks:
-
Activity monitoring. The goal here is to characterize the extent to which construction equipment are being utilized. We are establishing a formal language to represent construction activities, developed and applied a parts-based approach to detect, track, and recognize activities of equipment from video streams within the context of this language, and are currently exploring how to characterize modes of error in equipment detection as the basis for choosing informative camera viewpoints.
- Emission monitoring. The goal is to characterize the extent to which construction operations are producing emissions. Using the emission model, productivity data, and timeline of activities, we calculate the actual rates of emissions, carbon footprint, and productivity.
Using our proposed approach to activity and emission monitoring, and building upon Earned Value Management (EVM) methods [41,42], we will explore how to measure the deviations between expected and actual emission and productivity rates. Given the measured state of performance and EVM methods, we will forecast the future performance. This information will then be visualized in a web-based 3D environment accessible to onsite and offsite construction practitioners – owners, contractors, and tradesmen based on our proposed construction grammar and expressing all critical states and changes associated with the benchmarked performance model. The visualized results of these analyses allow decision-makers to understand where excessive emissions and impacts on the environment have occurred and why they occurred so that they can make appropriate project control decisions.
Summary/Accomplishments (Outputs/Outcomes):
In the first phase of this project (Since Fall), our team has produced the following outcomes:
- An automated video-based method for detection and tracking of construction equipment, through video cameras (see demo video: http://vimeo.com/55093622)
- An automated video-based method for atomic action recognition of construction equipment (this phase only for excavators and dump trucks; see demo video: http://vimeo.com/43407920)
- A database of emission rates for atomic actions of excavators and dump trucks. As part of an internal funding provided to the PIs, an emission monitoring system is also purchased and we are currently using the system to measure the actual emission rates for various actions of equipment.
Conclusions:
Automated and continuous project-level and activity-level carbon footprint monitoring of construction operations supports the contractors and project managers with information required for assessment on carbon footprint of various construction operation alternatives. This can ultimately lead to reduction of excessive environmental impacts associated with performance deviations. By benchmarking, monitoring, and improving construction performance, this research not only minimizes negative environmental impacts of performance deviations on human health, but also provides an economic competitiveness for the construction companies that are adopting this easy to use technology. It further minimizes GHG emissions and can help meet the emission reduction goals set by government agencies. Successful execution of the proposed research will transform the way construction operations are currently being monitored and offers a new possibility for low-cost and effective monitoring of construction carbon footprint at reasonable accuracy. Construction operations will be more frequently and continuously assessed through an inexpensive and easy to install solution. Combination of detailed assessment and continuous improvement can help minimize the idle time, improve productivity of operations, save time and money, and result in reduction of fuel use, construction emissions and carbon footprint. It can further relieve construction companies from the time-consuming and subjective task of manual method analysis of construction operation, or installation of expensive location tracking and telematics devices. Any small improvement in emission control of the $900 billion construction industry, the third highest producer of industrial-related GHG emissions, can significantly support the goals of GHG emission reductions and can facilitate establishment of carbon footprint monitoring and control policies.
Supplemental Keywords:
Sustainability monitoring, Model for sustainability, Decision-making, Computational simulations, Computer generated alternatives, Green construction operations, Emission control technologies, Energy conservation, Monitoring resource consumptionThe perspectives, information and conclusions conveyed in research project abstracts, progress reports, final reports, journal abstracts and journal publications convey the viewpoints of the principal investigator and may not represent the views and policies of ORD and EPA. Conclusions drawn by the principal investigators have not been reviewed by the Agency.