
Grantee Research Project Results
2011 Progress Report: Model of Toxicant Response in Engineered Liver
EPA Grant Number: R834998Title: Model of Toxicant Response in Engineered Liver
Investigators: Rajagopalan, Padmavathy , Murali, T. M.
Current Investigators: Rajagopalan, Padmavathy , Murali, T. M. , Ehrich, Marion
Institution: Virginia Tech
EPA Project Officer: Chung, Serena
Project Period: June 1, 2011 through May 30, 2015
Project Period Covered by this Report: June 1, 2011 through May 31,2012
Project Amount: $750,000
RFA: Computational Toxicology: Biologically-Based Multi-Scale Modeling (2010) RFA Text | Recipients Lists
Research Category: Chemical Safety for Sustainability
Objective:
Objective 1: Use 3D liver mimics as a platform for testing the hepatotoxicity of prototypic hepatotoxicants such as acetaminophen and dichloroethylene.
Objective 2: Compute biological process linkage networks that anchor phenotypes triggered by acetaminophen and dichloroethylene to gene expression profiles.
Objective 3: Discover the effects on hepatic cells of combinations of the toxicants examined in Objectives 1 and 2. Prioritize toxicity pathways for further proteomic and metabolomic analyses.
Our overall approach has the following components. We are assembling 3D liver mimics composed of hepatocytes and liver sinusoidal endothelial cells, separated by a nanoscale polyelectrolyte layer that mimics the Space of Disse. We are measuring the phenotypes triggered by two prototypic hepatotoxicants and their mixtures in the liver mimics. By analyzing the phenotypes, we plan to select specific concentrations of individual toxicants and mixtures for further analysis using DNA microarrays. We are integrating the transcriptional data with comprehensive molecular interaction networks and functional annotation databases to compute biological process linkage networks. Based on a careful comparative analysis of the linkage networks, we plan to prioritize proteins and metabolites for detailed experimental study.
We expect that this approach will establish a combined experimental and computational pipeline for toxicity testing and risk assessment centered on 3D liver mimics and biological process linkage networks. Our approach allows perturbations in toxicity pathways to be traced across multiple scales: from regulatory proteins and transcriptional perturbations to communication between different hepatic cell types. Unique aspects of our approach include modeling the cell’s response to combinations of toxic chemicals and in more than one hepatic cell type.
Progress Summary:
Objective 1: Establishing dosage of acetaminophen (APAP) and the subsequent response in in vitro hepatocyte cultures
Our focus has been on establishing the appropriate dose of acetaminophen and the time points at which further studies on the 3D models should be conducted. The objective of these sets of experiments would be to establish the liver mimics as relevant model of APAP toxicity by investigating the key features which mark the toxic reaction. Towards this goal we are investigating the expression of CYP2E1, a key cytochrome P450 enzyme that is responsible for hepatotoxicity upon addition of APAP at both short and long time points. We are conducting both Western Blots as well as assays to determine the levels of this protein over a period of time. The effects of APAP are being assessed up to a dose of 40 mM through a combination of different responses that include MTT, live/dead, ALT, and glutathione assays.
Objective 2: Process Linkage Networks
High throughput experiments yield datasets such as gene expression profiles and protein interaction networks that are difficult to interpret due to their sheer size. We have developed a new method for computing Biological Process Networks (BPNs) that seeks to ease the difficulty of interpretation of massive systems biology datasets. Our approach has three attractive properties.
- It distills cellular responses into networks of links between biological processes.
- It reports a non-redundant set of such links that together serve to explain as much of the cellular response as possible.
- It avoids the need for multiple hypotheses correction by simultaneously searching for multiple, non-redundant explanatory links.
Our new method takes inspiration from recent advances in functional enrichment. We modeled the perturbation of genes at the interactions connecting two processes to be noisy observations (of gene expression) generated from a collection of perturbed links between processes. We constructed a Bayesian network where each link between a pair of processes has a node representing its state of perturbation, and is connected to every node representing an interaction that the two terms in link annotate. We computed the likelihood of any given configuration of link perturbation states as the product of multiple distributions controlled by parameters accounting for the noisiness in the observed states of the gene-gene interactions. Using Markov Chain Monte Carlo (MCMC), we identified BPNs with high likelihood. We label this new method “Markov chain Monte Carlo Biological Process Networks” (MCMC-BPN). The objective of MCMC-BPN is to use as few inter-process links to describe as many of the perturbed interactions interfacing the processes as possible. MCMC-BPN thus summarizes the important biological trends within a response network by reporting to the user BPNs composed of a digestible number of inter-process links that can be explored in greater detail.
We applied MCMC-BPN to four data sets relating to the liver and liver disease. In this report, we describe the first application, where we reanalyzed the data comparing gene expression of rat hepatocytes in two common in vitro culture systems that we have published earlier: hepatocyte monolayer (HM) and collagen sandwich (CS).
Data Sources
We used gene expression data for the collagen sandwich (CS) vs. hepatocyte monolayer (HM) contrast (Gene Expression Omnibus, accession number GSE20659). For the contrast, we used the samples for CS (double gel) day 8 as the treatment and samples for HM (single gel) day 8 as the control. We used the interactions for Rattus norvegicus contained in STRING version 8.3 to form the gene interaction network. We obtained process annotations for the genes from the Molecular Signatures Database (MSigDB) version 3.0, CORUM complexes, NetPath signal transduction pathways, and NCI Pathway Interaction Database’s curated pathways.
For each contrast, we performed a total of five runs of MCMC-BPN. Each run took between 15 and 30 hours on a single core of a 2.8GHz AMD Opteron 4184 processor using our implementation 3 in Python.
CS versus HM
Figure 1 presents one of the BPNs computed using the MCMC-BPN method on the data for the CS vs. HM contrast. The BPNs reported from the five runs for the CS vs. HM contrast consisted of an average of 27.6 processes (standard deviation (SD) = 1.0) with 20.0 inter-process links (SD = 0.6) explaining 1686.0 interactions (SD = 53.5), 1070.2 (SD = 30.9) of which were perturbed. The BPNs explained 27.7% of all perturbed interactions using 0.1% of the possible links.
Interpretation of the BPNs
The BPNs showed strong separation between up- and down-regulated processes (Figure 1). Most up-regulated processes were related to metabolic functions performed by the liver, including lipid and carbohydrate metabolism, while most down-regulated processes related to cell replication and the cytoskeleton. These reflect the greater retention of physiological function of hepatocytes in CS culture versus HM culture, and the greater degree of de-differentiation for cells in HM versus CS, respectively.
Two main components dominate the BPNs. The first component contains a mix of processes related to fatty acid metabolism (OXIDOREDUCTASE ACTIVITY, KEGG PPAR SIGNALING PATHWAY, REACTOME REGULATION OF LIPID METABOLISM BY PEROXISOME PROLIFERATOR ACTIVATED RECEPTOR ALPHA, and KEGG BIOSYNTHESIS OF UNSATURATED FATTY ACIDS) and processes related to amino acid and carbohydrate metabolism (REACTOME METABOLISM OF CARBOHYDRATES, REACTOME METABOLISM OF AMINO ACIDS, and KEGG ARGININE AND PROLINE METABOLISM), all critical functions of hepatocytes. A link between OXIDOREDUCTASE ACTIVITY and REACTOME METABOLISM OF AMINO ACIDS bridges these two groups of processes. The second component contains down-regulated processes related to the de-differentiation of the hepatocytes in HM. The component is composed of KEGG CELL CYCLE, CELL PROJECTION, REACTOME G2-M TRANSITION SPINDLE and REACTOME CELL JUNCTION ORGANIZATION. Although some of the names of the processes appear very similar, their actual gene content tended to overlap very little. For example, CELL CYCLE GO 0007049 and KEGG CELL CYCLE have a genes-based Jaccard index of only 0.23. Similarly KEGG PPAR SIGNALING PATHWAY and REACTOME REGULATION OF LIPID METABOLISM BY PEROXISOME PROLIFERATOR ACTIVATED RECEPTOR ALPHA have a Jaccard Index of 0.32 when comparing their gene content.
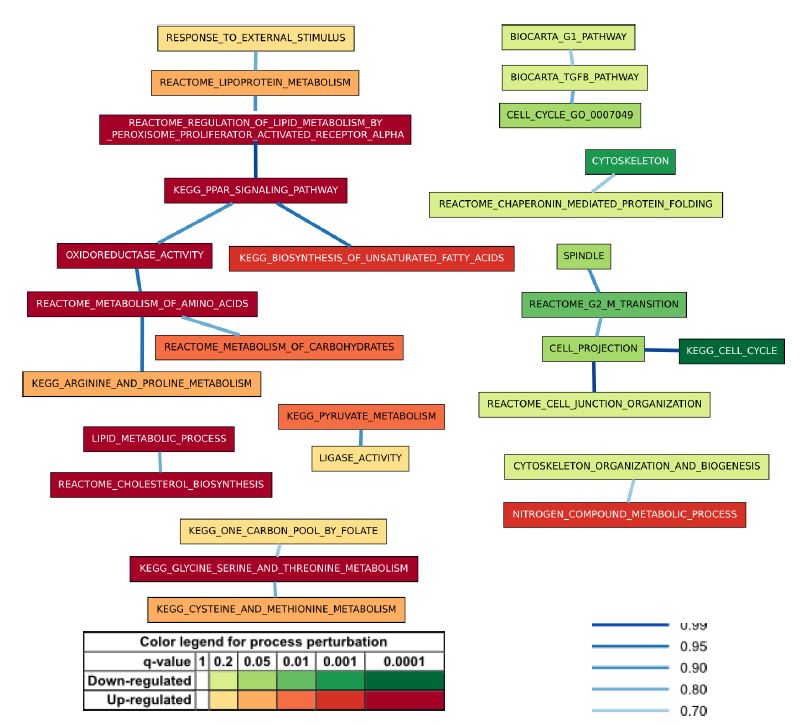
Figure 1: A BPN computed for the CS vs. HM contrast. Rectangular nodes represent biological processes are represented. Node color indicates collective perturbation of the process, as assessed by GSEA, where deep reds signify significant collective up-regulation, and deep greens signify collective down-regulation. Edges between process nodes represent significant links. Dark blue edges indicate highly probable links, while light blue edges indicate less probable links.
Future Activities:
In year 2 of the project, we plan to complete a suite of experiments using APAP and dichloroethylene on the 3D liver models with a detachable PEM layer. We will generate genomewide gene expression data that measure these cellular responses. We seek to apply the MCMC-BPN algorithm to these data in order to summarize the liver mimic's responses to toxicants. These analyses will set the stage for future proteomic and metabolomic studies.
Journal Articles:
No journal articles submitted with this report: View all 34 publications for this projectProgress and Final Reports:
Original AbstractThe perspectives, information and conclusions conveyed in research project abstracts, progress reports, final reports, journal abstracts and journal publications convey the viewpoints of the principal investigator and may not represent the views and policies of ORD and EPA. Conclusions drawn by the principal investigators have not been reviewed by the Agency.