
Grantee Research Project Results
Final Report: How to Harvest Trees While Maximizing Carbon Sequestration
EPA Grant Number: SU834735Title: How to Harvest Trees While Maximizing Carbon Sequestration
Investigators: Roise, Joseph , Gharis, Laurie , Heiderman, Ryan
Institution: North Carolina State University
EPA Project Officer: Page, Angela
Phase: I
Project Period: August 15, 2010 through August 14, 2011
Project Amount: $9,983
RFA: P3 Awards: A National Student Design Competition for Sustainability Focusing on People, Prosperity and the Planet (2010) RFA Text | Recipients Lists
Research Category: Pollution Prevention/Sustainable Development , P3 Awards , P3 Challenge Area - Sustainable and Healthy Communities , P3 Challenge Area - Chemical Safety , Sustainable and Healthy Communities
Objective:
Our purpose was to produce an accurate and useable analytical product for Southeastern United States foresters growing Pinus taeda in the presence of a carbon market. The decision variables for the model were the traditional stand level management variables of planting density, thinning timing and intensity, and rotation length. Over time these variables influence the proportion of wood going into pulp, chip-n-saw, and sawtimber products where each of these classes have expected use (carbon storage) lives. The optimal management regime is dependent on the relationship between the volumes of pulpwood, chip-n-saw, and sawtimber over multiple rotations. The relationship between pulpwood, chip-n-saw, and sawtimber volumes determines the amounts of above and below ground tree carbon and carbon in wood products. The result of this paper is a methodology to increase knowledge of how forest management practices and time impact commercial volumes of wood and carbon sequestration at an operational level. This practical knowledge can lead to economically viable policies for foresters and effective carbon sequestration policies for the environment.
To model the management of a forest stand in the Southern U.S., an optimization model was created to analyze the trade-offs between economics and carbon. The model had four important stand level variables: planting density, thinning timing and intensity, and rotation length. The model accounted for value as it relates to time and to multiple rotations by utilizing soil expectation value (SEV) rather than net present value (NPV). The model assumed a 4% discount rate for the SEV. Cost per seedling, planting cost per seedling, site preparation cost per acre, thinning profits, and harvest profits were included in the SEV. The model addressed carbon in products by adding a positive value to the price of each product according to the products storage potential. A growth and yield model was employed to develop an equation for sawtimber, pulpwood, and chip-in-saw from planting density (TPA), thinned to density (TPA), thinned year, and rotation length. 456 trials were run on the growth and yield model. For each trial, the amount of sawtimber in thousand board feet (MBF), chip-n-saw in cubic feet, and pulpwood in cubic feet at thinning and at harvest were recorded. Merchantable volume was converted to biomass and then to carbon by multiplying the green volume in cubic feet by the weight of one cubic foot of water, by the specific gravity of the species of the tree, by 1.5 for above ground biomass, 1.25 for below ground biomass (Pretzsch 2009), and by .5 for carbon (Huang 2006).
Thinning product volume equations, harvest product volume equations, and NPV equations for products were input into the optimization model. The model for decay of stored carbon by product is still under development, but a rudimentary way to model carbon in products was to add a positive value of 80 to the price of long term products and a positive value of 1 to the price of short term products to give an advantage to products that store carbon longer. These numbers were chosen since a long term product does not begin to decay until year 80 on average and a short term product begins to decay at year 1. A positive value of 40 was added to the chip-n-saw’s price, which is similar to allotting half of the chip-n-saw to long term uses and half to short term uses. SEVs of potential stands were calculated utilizing the product prices, the assumed positive values for carbon storage potential, seedling costs, planting costs, and site preparation costs. The model was set to maximize SEV of the stand by changing the four management variables (planting density, thinning density, year thinned, and rotation length).
The model can be summarized as:
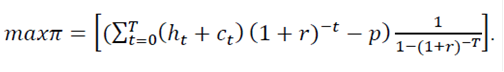
The objective function is to maximize the discounted net revenues over an infinite time horizon with rotation age T and includes (at time t, whenever there is a cut) stumpage prices for sawtimber, chip-n-saw, and pulpwood from the thinning and the rotation (ht), the extra value for each product in accordance with how long the product is expected to continue storing carbon (ct), and regeneration costs (cost of seedlings, planting costs, and site preparation) (p).
Summary/Accomplishments (Outputs/Outcomes):
The expected output of this study was a set of management prescriptions that when used together could increase carbon sequestration and provide wood products and a market structure for trading carbon credits, which foresters could participate in while still producing wood products. The optimal management plan chosen when maximizing the SEV to include carbon in products was to plant 229 trees, thin to 100 trees at year 16, and rotate the stand at year 29. This optimal rotation produced an SEV of $911.15 per acre and had an ending storage of 55923 pounds per an acre of carbon. The average planting density for the South is approximately 600 TPA. Utilizing this planting density, the model was re-optimized. A planting density of 600 TPA produced only 51298 pounds per acre of carbon at the end of the rotation and had an SEV of $838.72 per acre. The optimal solution produced approximately 4625 more pounds per acre of carbon at the end of the harvest and had an increased SEV of $72.43 per acre. This is an increase of 9% for carbon and 8.6% for SEV.
For comparison, different scenarios were input into the optimization model. The scenarios were to maximize SEV without taking into account product storage, to increase the optimal rotation age according to SEV by five years and then to include a value of $19.43 per acre per year for each year of extra carbon storage, and to maximize the total ending carbon in the stand. The SEVs for the scenarios ranged from a low of $579.81 for maximizing the ending carbon in the stand to a high of $912.63 per acre for maximizing SEV. The starting TPAs had a range of 229 for maximizing the SEV with carbon storage in products to 691 for maximizing the ending carbon in the stand. The table below summarizes the SEV, starting and thinning densities, thinning year, and rotation length for all scenarios. It is important to note that maximizing the SEV to include a higher value for carbon stored in long term products is very similar to maximizing the SEV.
|
Objective |
SEV | Ending Carbon in | Planting | Thinning | Thin | Rotation |
| SEV | 912.63 | 56003.71 | 239 | 100 | 17 | 30 |
| SEV with Carbon | 911.15 | 55923.05 | 229 | 100 | 16 | 29 |
| Ending Carbon in |
579.81 |
112291.37 |
691 |
485 |
16 |
40 |
| Ext Rotation SEV | 863.10 | 74060.20 | 314 | 146 | 20 | 35 |
To insure the accuracy of the equations, the optimal solutions for each of the scenarios were input into the Hafley and Smith Growth and Yield Model to compare the predictions of the optimization model to an established growth and yield model. Overall the optimization model predicted a little low for thinned chip-n-saw and a little high for pulpwood. A comparison of the predictions for the optimization of SEV to include product storage is shown in the table below. The total cubic foot predicted by the growth and yield model was 2635.5 versus 2745.3 for the optimization model. This optimization model is within 10% of total results predicted by the Hafley & Smith Growth and Yield model, which was the standard for success.
| Product | Growth & Yield Model | Optimization Model |
| Thinned Sawtimber | 0 MBF | 0 MBF |
| Thinned Chip-N-Saw | 191.4 Cubic Feet | 127 Cubic Feet |
| Thinned Pulpwood | 214.0 Cubic Feet | 282 Cubic Feet |
| Harvested Sawtimber | 8.4 MBF | 8.41 MBF |
| Harvested Chip-N-Saw | 0 Cubic Feet | 0 Cubic Feet |
| Harvested Pulpwood | 480.8 Cubic Feet | 584.21 Cubic Feet |
To further analyze the relationships between carbon and wood products, the data from the Hafley and Smith Growth and Yield Model was graphed according to rotation length and planting density. Figure 1 is a graph of the amount of harvested carbon in sawtimber, chip-n- saw, and pulpwood with the total carbon in merchantable products and the net present value of the harvest at 25 years. Product values are averaged for each planting density and are in cubic feet per acre, carbon is averaged for each planting density and is measured in pounds per acre, and net present value is averaged for each planting density and is in dollars per an acre. The net present value has been multiplied by 10 and the carbon values have been divided by 10 for viewing purposes. Net present value and carbon in sawtimber appear to be parallel.
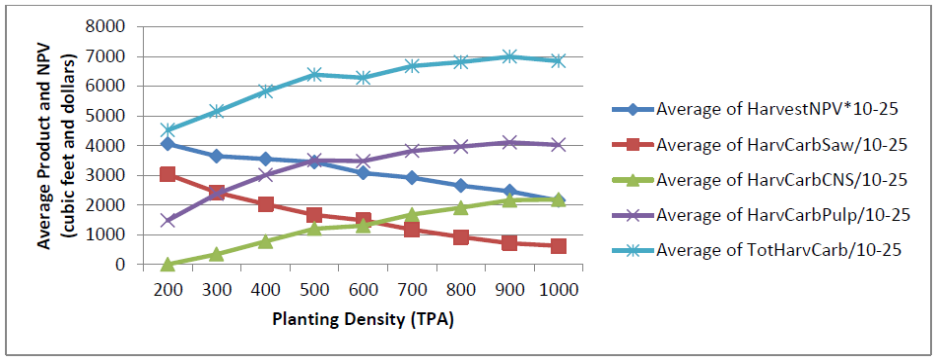
Figure 1: Graph of 25 Year Rotation of Carbon in Products and Net Present Value over Range of Planting Densities
Conclusions:
The model developed in this study includes operational level management variables such as planting and thinning density, thinning timing, and rotation length, which makes it useful for providing guidance at the ground level. It can be used to investigate the competing objectives of maximizing carbon sequestration, carbon storage, and net present value. Although this model was developed for Southeastern United States foresters growing Pinus taeda, equations can easily be changed to different forest types, more active management regimes, and different regions.
This analytical tool can be employed by foresters to maximize SEV or policy makers to compare carbon policies. If long term carbon storage is preferred, then a positive value could be added to the price of sawtimber. If product substitution of fossil fuels is preferred, then a positive value could be added to the price of short term products. Then the model could be optimized to take product storage or product substitution into account. In addition to displaying the optimal management regime for different objectives, the model shows the SEV for each objective. Policies that do not take into account the financial implications for foresters are not going to be effective. A science based decision analysis model such as this can allow environmental policy makers to make economically viable policies and effective carbon sequestration policies for foresters to follow.
Supplemental Keywords:
climate change, operations research, environmentally benign substitute, sustainable construction materials, computer models, global considerations, Red-Cockaded WoodpeckerThe perspectives, information and conclusions conveyed in research project abstracts, progress reports, final reports, journal abstracts and journal publications convey the viewpoints of the principal investigator and may not represent the views and policies of ORD and EPA. Conclusions drawn by the principal investigators have not been reviewed by the Agency.