
Grantee Research Project Results
2011 Progress Report: Improving Emission Inventories Using Direct Flux Measurements and Modeling
EPA Grant Number: R834556Title: Improving Emission Inventories Using Direct Flux Measurements and Modeling
Investigators: Schade, Gunnar W. , Collins, Don , Ying, Qi
Institution: Texas A & M University
EPA Project Officer: Chung, Serena
Project Period: April 1, 2010 through March 31, 2014
Project Period Covered by this Report: April 1, 2011 through March 31,2012
Project Amount: $499,992
RFA: Novel Approaches to Improving Air Pollution Emissions Information (2009) RFA Text | Recipients Lists
Research Category: Air Quality and Air Toxics , Air
Objective:
- Measure volatile organic compound (VOC) and criteria air pollutant fluxes from the Yellow Cab tower on a semi-continuous basis.
- Extend the current measurements by a novel particulate matter (PM) number density flux technique based on REA.
- Carry out flux footprint modeling and subsequent overlays with various GIS data sets to determine flux contributions from the surrounding urban areas.
- Create bottom-up emission fluxes from onsite roadways using detailed traffic surveys and MOBILE6 and MOVES modeling. Compare predicted to measured fluxes.
- Use comparisons to identify inventory shortfalls and create modified inventories used in alternative scenarios of air quality modeling on larger scales.
Progress Summary:
During the second year of this project, measurements at the Houston Yellow Cab tower were continued. They are summarized as follows:
- Reinstalled air quality instrumentation for CO, NOx, and ozone recorded 20-m gradients (60 vs. 40 am agl) on a 20-min (10 min per level) basis until a failure in February 2012.
- Meteorological data were recorded continuously, but some temperature and humidity sensors were lost after a suspected lightning strike in 2011.
- Aerosol sampling from the top level (60 m agl) continued, though lengthy interruptions resulted from equipment issues including (i) failure of the seals in the switching valves installed on the tower, (ii) failure of the primary and back-up compressors used to pump air up the tower in order to provide an aerosol-free air stream, and (iii) cracks in two sections of the associated tubing carrying that compressed air stream.
- Re-installed and maintained hydrocarbon measurements with the SRI GC to obtain VOC concentration and flux measurements during different season; ongoing data analysis and quality control.
- Had two more detailed traffic count periods performed by the Texas Transportation Institute (TTI), one in fall 2011, one in early summer 2012.
The calendar year 2011 was outstanding in Texas due to the extreme drought experienced by almost the entire state. We have had a look at our data with respect to the changes that may or may not be observable as possible effects of the drought. We also investigated how reproducible the criteria air pollutant gradient measurements are by comparing results between winters 10/11 and 11/12, and between winter and summer measurements. Furthermore, we began investigating how representative our site is from the viewpoint of concentration vs. flux measurements for unreactive (typical lifetime >1 day) VOCs.
Criteria pollutant and VOC fluxes (Schade)
In Figures 1 & 2 we compare the measured CO gradients between winter and summer and between 2 winter months during the past 18 months. While winter-to-winter differences were very small (Fig. 2, also for CO and ozone, not shown), there are clear differences between the summer and winter gradients. This is to be expected because atmospheric turbulence is different between the seasons, with low turbulence, especially at night, more common during the winter time. Thus, nighttime gradients are larger in winter, while daytime gradients are more similar. Gradients during the transition from negative heat fluxes at night to positive heat fluxes during the day are largest, but also much more pronounced in winter. Future analysis will estimate eddy diffusivity factors to calculate actual fluxes, which then can be directly compared between seasons. As a first step, we compared the summer/winter ratios between CO and NOx and found no significant differences, suggesting that turbulence (instead of chemistry) is the main driver of seasonal differences. There is, however, a tendency towards lower NOx compared to CO gradient ratios, consistent with expected NOx loss processes (NOz formation) between the 40 and 60 m level. This is consistent both with our previous interpretation of the observed vs. modeled isoprene fluxes at this site (Park, et al., JGR 2011) and the observed positive ozone gradient, shown in Figure 3. Although this kind of diurnal ozone gradient cycle was observed in previous years, it was different in summer 2011, and we need to investigate it further, such as whether this could have to do with the drought. Quality assurance currently is being developed for these gradient data sets, including stationarity testing and atmospheric turbulence discrimination.
Two views of the drought, one for water vapor and one for CO2 fluxes, comparing May 2011 with May 2012, are shown in Figures 4 and 5. As expected, water vapor fluxes were significantly lower during 2011, mostly because of the fact that very few, if any, households in the footprint area of the tower use irrigation for their lawns. The drought led to water stress for the (tree) vegetation, which is expressed in lower stomatal conductance and reduced photosynthesis rates (Barta, Schade, et al., in preparation). Soil CO2 efflux would have been increased with higher temperatures, but simultaneously decreased with decreasing soil moisture deficits, and have evidence for that from a National Oceanic and Atmospheric Administration (NOAA)-funded project. Higher daytime CO2 fluxes in drought-year 2011 clearly point to diminished plant photosynthesis rates and possibly higher plant and soil respiration; lower nighttime rates may reflect reduced soil CO2 efflux due to lack of water for microbial activity.
VOC fluxes have been calculated for a variety of VOCs for which we have sufficiently precise concentration measurements. As an example, Figures 6 and 7 show winter-time (2011/12) diurnal concentrations and flux comparisons between some hydrocarbons measured in this project. The comparison of the aromatic compounds shows that the site is reasonably representative of the larger area in that concentration and flux ratios are similar. There is a tendency for higher toluene concentrations and fluxes, which is likely related to toluene use as a solvent in the area (Park, et al., Atmos. Environ. 2010) and lower atmospheric xylenes vs. toluene lifetimes. In contrast to this, the corresponding comparison of pentane to isopentane depicted in Figure 7 shows that our site is affected by a strong pentane source. While the expected isopentane/pentane ratio is 2, the measured concentration ratio in winter was lower, and the flux ratio appeared to be reversed, i.e., twice as high pentane than isopentane fluxes. As discussed below for the 2008 data, we are aware of a non-reporting pentane source to the SSE of us. However, most 2011/12 winter data were obtained under different wind directions, suggesting that additional pentane sources exist in the area.
Apportionment of Flux and VOC measurements using PMF (Ying)
Source apportionment of the flux and VOC concentrations at the Yellow Cab tower are based on past measurements of 17 VOC species: iso-pentane, pentane, isoprene, 2- and 3-methyl-pentanes, n-hexane, methacrolein, methyl-vinyl-ketone, methyl-ethyl-ketone, iso-heptane, n-heptane, benzene, toluene, m/p-xylene, o-xylene, and ethyl-benzene. Both concentration and flux PMF calculations showed four sources namely: vehicle exhaust, headspace vapor, isoprene and a non-reporting pentane point source (see Figure 8 for wind direction dependence of source contributions). The resolved source contributions along with an analytical footprint model were used to resolve source specific emission rates. The preliminary analysis indicated that the estimated vehicle exhaust emission factor is closer to US EPA MOVES 2000 vehicle fleet and the headspace vapor emission factor is underestimated by MOVES on the order of 4.5 times for 2008 vehicle fleet and 3.2 times for 2000 vehicle fleet. The estimated emission factor of the pentane source was 140 short tons per year (exceeding the regulation limit for reporting of 10 short tons). This technique could be used in the future by regulatory agencies to identify any non-reporting sources in the emission inventory.
Modeling emissions from mobile sources
We compared on-road vehicle emission inventories of CO and NOx for Southeast Texas generated by MOVES and MOBILE with measurements using the EPA's Community Multiscale Air Quality (CMAQ) Model incorporated with a source-oriented gas phase chemical mechanism. This source tracing technique allows direct determination of contributions from gasoline and diesel vehicles to CO and NOx concentrations and identification of stations that are impacted by vehicle emissions. Comparison with vehicle contributions of measured CO and NOx at the Yellow Cab tower (calculated using PMF) indicated an over-estimation of both CO and NOx with slightly better performance in the MOBILE case (see Table 1 as an example). A similar conclusion was made from our analysis at three other TCEQ operated vehicle influenced stations in Harris County. This study suggests that the current version of the MOVES model should be improved to reduce NOx to the levels below MOBILE predictions and significantly reduce CO emissions. We plan to run a local scale dispersion model using the collected vehicle distribution data in the Yellow Cab tower vicinity to get a better understanding of accuracy of emission inventories by comparing predicted Yellow Cab flux and concentrations with measurements and thereby running a regional simulation modifying the emission inventory to see the influence of our findings.
Aerosol flux measurements (Collins)
The DMA system operated at the base of the tower to measure submicron aerosol size distributions has worked well throughout this project. In contrast, the valve system used to shunt one or both of the sample flows has been problematic, and because it is located at the top of the tower, lengthy downtimes often have resulted from minor issues. We continue to work to resolve those issues and prevent them from recurring to give us the highest possible data collection rate over the coming months.
The data acquired and analyzed so far show some interesting features that we will be exploring during the final year of the project. An example subset of data collected between March and May 2011 are presented in Figures 9 and 10. Period averaged differences between size distributions measured in updrafts and those measured in downdrafts are shown in Figure 9. The red and blue curves show size-resolved ratios and differences in concentration (actually dN/dlogDp). The lower graph shows the results for a period during which the purge valves remained off and the updraft and downdraft sample flows were not interrupted. The absence of any significant difference between updraft and downdraft concentrations indicates that any bias between the two inlets is small. The updraft/downdraft concentration ratio in the upper graph shows that emissions and near surface production are most significant for larger and smaller particles, with an apparent slight enhancement in the downdraft concentration in between around 0.2-0.3 µm. The relatively low number concentration of accumulation mode particles resulted in a small absolute difference in concentration in that size range despite the high concentration ratio, which is still increasing with size at the edge of the measured size range.
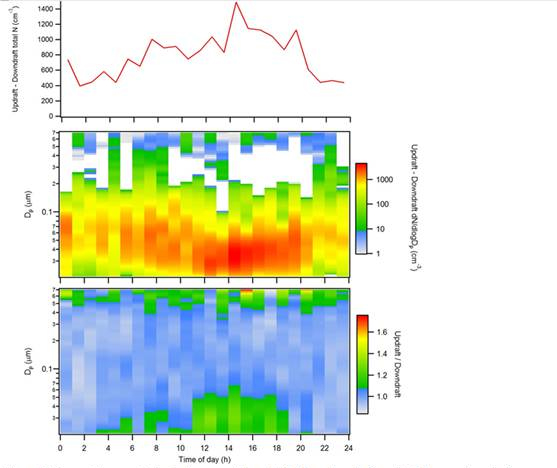
Similar updraft/downdraft differences are shown as a function of time of day in Figure 10. Of interest is the apparent maximum in the concentration enhancement in the updrafts in the early afternoon rather than during morning or afternoon rush hour. This may indicate that the new particle formation rate below the inlet exceeds that above, which may correspond to a similar gradient in ozone mixing ratio. We will continue to analyze and interpret these data and those to be collected over the final project year.
Our measurement goals (proposal section E5, Table 2) for the second year were not completely met for two main reasons:
- Need for graduate students to familiarize with instrumentation and data processing/analysis.
- Equipment failures, such as the above mentioned failure of tubing and valves in the on-tower particle flux system installation.
The analysis of existing aerial photography and LIDAR data for surface type and morphology characterization was completed in early 2012. Unfortunately, raw LIDAR data density was too low to determine local tree locations and crown dimensions in the tower's footprint. However, the data will support interpretations of all flux measurement taken at the site.
| Species | Mobile | Moves | "Obervations"1 |
|---|---|---|---|
| CO | 100.9(17.9) | 110.3(21.4) | 69.4(44.4) |
| NOx | 8.1(0.6) | 11.9(2.6) | 5.9(3.8) |
| 1 calculated using a PMF model on observed CO and NOx mixing ratios (other contributors are biogenic sources and background) | |||
Table 1. Comparison of mean vehicle contributions calculated using CMAQ involving
MOVES and MOBILE cases with PMF resolved vehicle contributions at the Yellow Cab
tower location. Units are in ppb with standard deviations in parentheses.
Figure 1. Measured, seasonally averaged diurnal CO gradients
(□ winter 2010/11, • summer 2011)
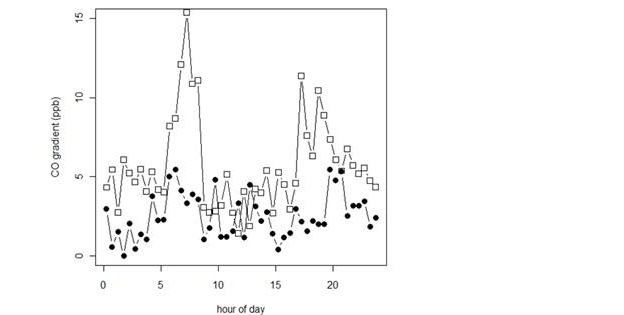
Figure 2. December 2010 (□) vs. December 2011 (•) median dirunal
NOx gradients.
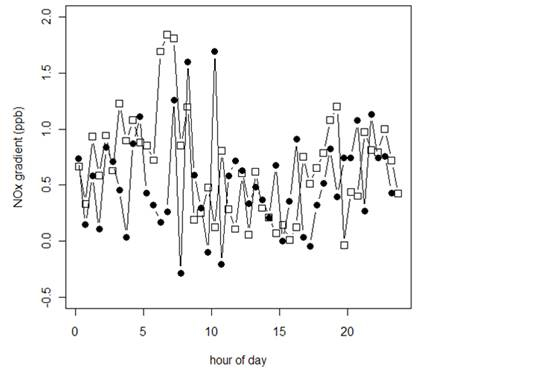
Figure 3. Measured, average fall 2011 diurnal ozone gradient
(□ weekdays, • weekends), suggesting daytime ozone formation
between the 40 and 60 m levels.
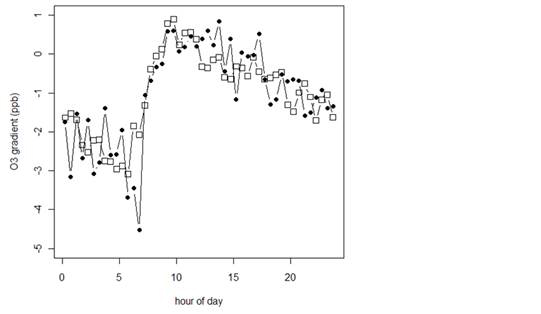
Figure 4. Median monthly water vapor fluxes (uncorrected
for line losses) for May 2011 (red) and May 2012 (blue) as
measured from the Yellow Cab flux tower.
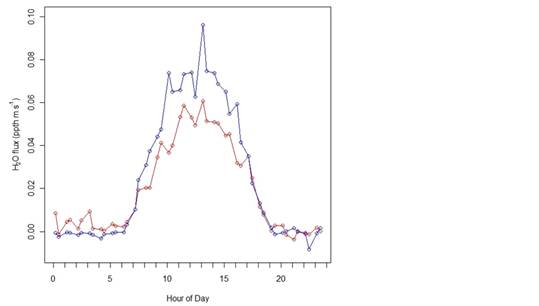
Figure 5. Median monthly CO2 fluxes for May 2011 (red) vs. May 2012 (blue),
similar to Figure 4.
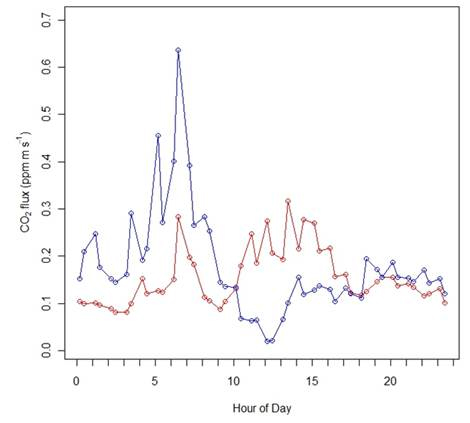
Figure 6. Diurnal median concentrations (top), and flux
scatter plot (bottom) of tolune and the sum ox xylenes for
the Yellow Cab flux tower site. Toluene
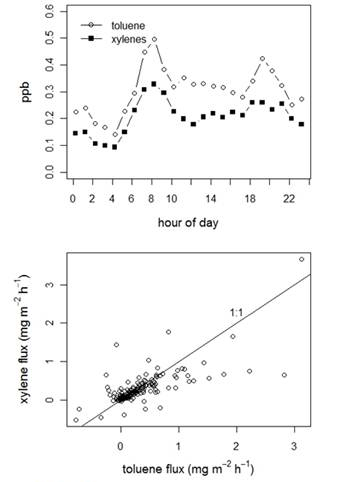
Figure 7. Same as Figure 6 but for pentane and isopentane,
which have near equal atmospheric lifetimes.
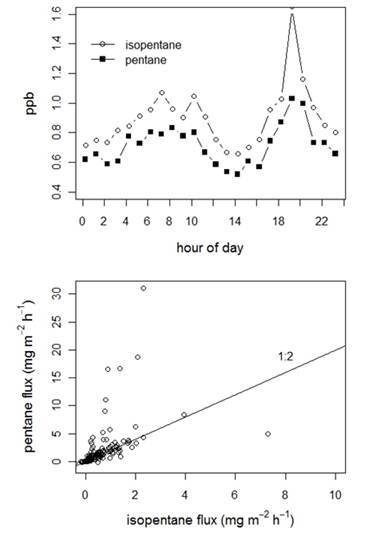
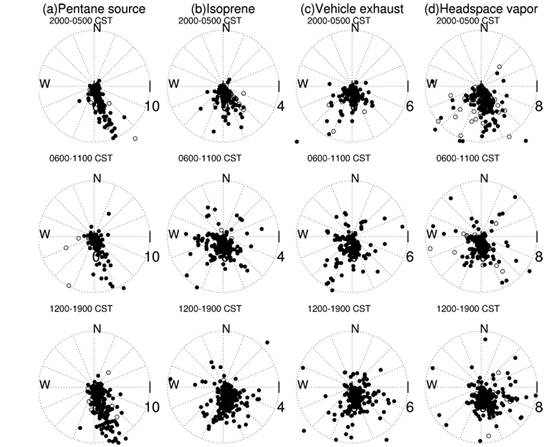
Figure 8. Wind direction dependence of apportioned flux. Units are mg/m3/h. Negative
contributions are indicated as unfilled circles. Note clear SSE signature for the perntane
souces as compared to the more distributed sources for the other three categories. The
indentified source most likely useses pentane as a blowing agent.
Figure 9. Updraft to downdraft ratios and differences as meadured by the DMA system
(geometric means) during sampling with the REA valves in use based on vertical wind
speed (top) and offline (bottom). The bottom graph represents the random error of the
sampling setup.
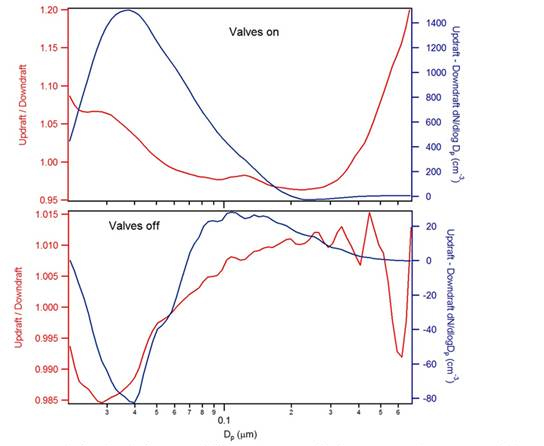
Figure 10. Geometric mean total submicron particle updraft minus downdraft
gradient (top panel), and resulting ratios (bottom panel) from a three-month
spring period in 2011. At average daytime particle density gradient of 1000 sm-3
leads to a flux of approximately 1.5x10³ particles m-2s-1
Future Activities:
Now that the GC is operating again, we are planning the described tracer release experiment to take place in late summer 2012 during a typical southerly flow day.
Data processing and modeling will again be a major part of our activities. Measurement data will be compared to the models, and to older data for consistency. We hope to compare the tracer release results both to the simple footprint model we are using and to the Langrangian back trajectory model operated by Natasha Kljun, who is in contact with us. All GIS data shall be assembled in one location and posted alongside metadata to the webpage.
Journal Articles:
No journal articles submitted with this report: View all 10 publications for this projectProgress and Final Reports:
Original AbstractThe perspectives, information and conclusions conveyed in research project abstracts, progress reports, final reports, journal abstracts and journal publications convey the viewpoints of the principal investigator and may not represent the views and policies of ORD and EPA. Conclusions drawn by the principal investigators have not been reviewed by the Agency.