
Grantee Research Project Results
2010 Progress Report: An Integrated Approach to Understanding and Reducing Fat, Oil, and Grease (FOG) Deposit Formation for Sustainable Sewer Collection Systems
EPA Grant Number: R834264Title: An Integrated Approach to Understanding and Reducing Fat, Oil, and Grease (FOG) Deposit Formation for Sustainable Sewer Collection Systems
Investigators: Ducoste, Joel
Institution: North Carolina State University
EPA Project Officer: Page, Angela
Project Period: August 1, 2009 through July 31, 2012 (Extended to July 31, 2014)
Project Period Covered by this Report: August 1, 2009 through July 31,2010
Project Amount: $569,568
RFA: Innovative and Integrative Approaches for Advancing Public Health Protection Through Water Infrastructure Sustainability (2008) RFA Text | Recipients Lists
Research Category: Pollution Prevention/Sustainable Development , Water , Sustainable and Healthy Communities
Objective:
The objectives of this study are as follows: 1) perform bench scale experiments that attempts to recreate FOG deposits and determine parameters that significantly influence their formation rate, 2) develop a numerical model that describes FOG deposit formation kinetics, 3) perform bench scale tests to explore enhanced treatment methods to improve the removal of FOG deposit chemical precursors with grease interceptors, 4) perform pilot scale experiments on a continuous flow sewer collection system to explore spatial variations in FOG deposit formation, and 5) develop a modified EPA storm water management model (SWMM) to predict FOG deposit formation in sewer collection systems. The research has made progress in the first year in tasks 1, 5, and 6. Overall progress on the project was slowed due to not hiring graduate students as anticipated at the start of the project. A full graduate student staff was not accomplished until the end of the first year. The research team is busy trying to make up for lost time.
Progress Summary:
Task 1: Determine the effect of oil/fat type and concentration, process temperature, and pH on the formation rate and physical characteristics of FOG deposits.
The fatty acid salt formation study was initiated with a trial experiment (Experiment 1: Canola oil 68.7%wt, Calcium hydroxide 0.2%wt, and DI water 31.1%wt; 25°C; mixed for five hours at 350 rpm) and did not display any noticeable salt formation. Confirmation of no salt formation was proven by analyzing the IR spectrum. The pH of the solution was not measured at that time. However, it was hypothesized that the amount of calcium addition was not sufficient to allow saponification compared to the stoichiometry of the fat and calcium ions present in the solution. Therefore the next experiment (Experiment 2: Canola Oil 68.7%wt, calcium hydroxide 0.6%wt, DI water 30.7%wt; pH 7.5) was performed with an increased amount of calcium concentration keeping the other environmental conditions the same as Experiment 1. Although it was also difficult to observe any significant amount of soap formation, a faint amount of whitish solid was found at the bottom of the reactor after the sample was left undisturbed for a day. The largest portion of the sample was oil. No further phase separation was observed after a day. The IR spectrum also did not reveal the presence of Ca-O bond as shown by Poulenat et al. There are three possible reasons for the inability of observing the metal-oxygen bond: 1) low pH, 2) low calcium content, and 3) inability of the ATR to capture the spectrum due to the heterogeneity of the sample (i.e. the fatty acid salt could have been surrounded by oil and the ATR was only able to capture the oil spectrum. The impact of the sample heterogeneity was overcome by applying a higher amount of pressure to ensure the maximum contact between the sample and the crystal surface.
The next two experiments (Experiment 3 & 4) were attempted to make fatty acid calcium salts through base hydrolysis with and without adding sodium hydroxide as a catalyst. The pH of the solutions was 13 and 11, with and without NaOH, respectively. Small white globules were immediately observed at the start of the mixing process. The quick solids formations could indicate the immediate release of fatty acid from alkali hydrolysis. The number of white globules increased with time. However, the sample seemed to be more emulsified as the mixing progressed. Results of these experiments displayed the presence of glycerin and a weak Ca-O bond (buried under the rocking vibration of CH2 near 720 cm-1).
Experiment 5 (Beef Tallow 73.5%wt; water 23.90%wt; calcium chloride 2.6%wt) was performed to understand the saponification process for saturated fats. Enough sodium hydroxide (0.1 ml of 0.1M NaOH) was added to produce a pH closer to 10. The ATR spectra of the final sample showed a decrease in absorption intensity of C=O bond. However the amount of calcium soap may not be significant for the ATR to pick up the metal oxygen bond absorption. The next set of experiments were designed to produce calcium soap with the addition of significant amount of catalyst (sodium hydroxide; which made the pH of the mixture well beyond 14) when the alkali hydrolysis at pH=10 did not show the discrete peak of Ca-O bond after five hours of mixing.
Experiment 6a (Canola 74.7%wt, calcium chloride 9.8%wt, catalyst 0.6%wt, water 14.9%wt) and 6b (Canola 74.7%, calcium hydroxide 9.8%, catalyst 0.6%, water 14.9%) were performed at these higher pH values to observe the presence of the metal oxygen bond. These samples displayed the discrete metal oxygen bond after five hours of mixing. However, their position differed by 5-10 cm-1 wave numbers. It could be due to the presence of different anions in the sample (Chloride in 6a). Experiment 7 was performed keeping all the conditions same as 6a but with Beef Tallow (saturated fat). The Ca-O bond was not displayed in the final sample after five hours of mixing. One possible reason for the absence of the Ca-O bond is that Beef Tallow did not stay in a liquid state long enough to allow the hydrolysis process to occur since the experiment was performed under room temperature conditions (25°C). The next experiment with Beef Tallow (Experiment 8) was performed under warmer conditions (45°C) keeping the oil-water-calcium component mixing ratios same as in Experiment 5. According to the ATR spectral analysis, a significant amount of calcium soap was produced after five hours of mixing for very high pH and warmer conditions using saturated fats (i.e. Beef Tallow). As mentioned earlier for liquid fats (i.e. Canola), five hours of mixing did not create a significant amount of soap for pH = 10.0. Consequently, the total mixing time was increased from five to eight hours.
Table 1.1 Experimental Conditions of the Saponification Experiment
| Temperature, T °C | 22-25 |
| Canola Oil (wt%) | 74.7 |
| CaCl2 (wt%) | 9.8 |
| Catalyst, NaOH (wt%) | 0.6 |
| Water (wt%) | 14.9 |
The next set of experiments was performed to determine not only the effect of increased mixing time but also the kinetics of soap formation. This study also expanded the initial research matrix to investigate the soap formation characteristics using different sources of calcium (i.e. calcium chloride and calcium hydroxide). Samples were collected at every half hour until the final sample collection after eight hours. For these set of experiments the mixing ratios for the ingredients followed those displayed in Table 1.1. Experiment 10 was performed under the same environmental condition (pH >> 14, canola, calcium chloride) as Experiment 6a with an 8 hr total mixing time. Experiment 11a and 12 were performed with Canola and calcium chloride at different pH conditions (≈7.0 and ≈10 respectively). Calcium hydroxide, being a strong alkali when added to water, was difficult to utilize when the target pH was 10 without adding a significant amount of concentrated hydrochloric acid (Experiment 11b). This large addition of HCl resulted in a significant reduction in the concentration of calcium and oil in the initial sample. The final sample, however, resembled the canola soap with calcium chloride at very high pH (Experiment 6a final product) after eight hours of mixing. No further experiments with calcium hydroxide at lower pH were pursued due to possible side reactions that may cause dangerous conditions.
Physical Characteristics
The calcium soaps produced to date were not analyzed for moisture content, compressive strength, and porosity. These tests will be performed with the next round of calcium soap production. However, it is important to mention that there were significant difference observed in the color and appearance of the soap produced with canola and beef tallow. Figure 1.1 displays the final condition of the calcium soaps. For the very high pH conditions (pH>>14), the calcium soap with calcium hydroxide had a rougher surface texture than soap produced with calcium chloride (Figure 1.1).
Figure 1.1. Calcium soaps made in the laboratory (Experiment numbers are shown in the respective pictures)
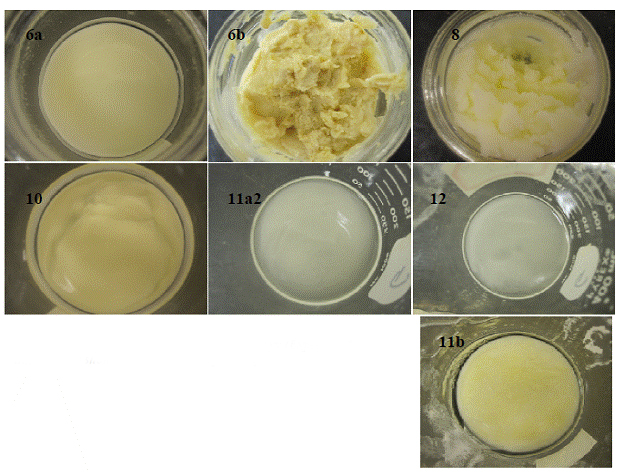
Soaps produced with calcium chloride appeared whiter in color with increasing pH conditions. Soaps left undisturbed for a period of time increased in density due to gravitational settling of fine soap particles in the oil solution.
Detailed Analysis of Soaps using ATR
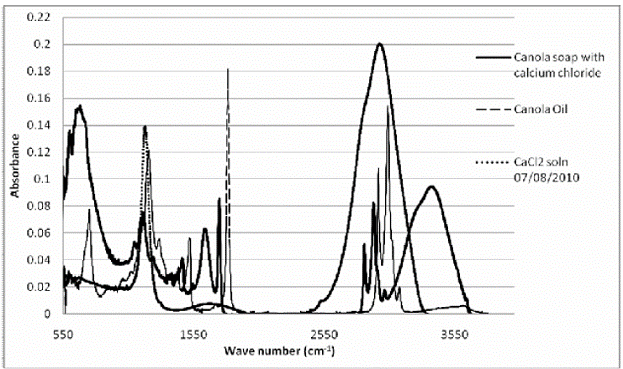
Sherman Hsu (1997) has suggested dividing the IR spectrum, which spans 4000 to 400 cm-1, into two parts for better identification of the constituents within the sample. The first part (4000 to 1500 cm-1) aids in identifying the various functional groups. The second part (1500 to 600 cm-1) called the fingerprint region, represents the characteristic vibrations of the molecule as a whole. Sherman Hsu, C.-P.(1997) and Lee, M. (1997) mentioned that the fingerprint region is usually complex and displays a unique pattern for each organic compound. This fingerprint region also helps to identify an unknown compound by comparing the spectra with known compounds. Poulenat et al. (2003) has chosen four specific regions to identify the characteristic bands of oleic soaps, three (part 1 at 4000-2800 cm-1; part 2 at 1800-1350 cm-1; and part 3 at 1350-1180 cm-1 and near 720 cm-1) being in the sodium chloride region and the fourth (670-440 cm-1) in the potassium bromide region. In this study, the results will be discussed as a combination of these two approaches. Table 1.2 displays the comparison of different calcium soaps obtained in this study to date and their group frequencies (Coates, J., 2000 and Poulenat, et al., 2003). Figure 1.2 displays the ATR spectral analysis of the typical calcium soap obtained in the laboratory. Figure 1.3 displays the comparison between the spectra of calcium soap produced in the lab and the pure reactants (calcium chloride solution, pure initial fats) used in the soap production. A discussion of the different wave band groups are provided below.
· Part 1 (4000 – 2800 cm-1)
The functional group region between 4000 and 2500 cm-1 represents the stretching vibrations between hydrogen and some other atoms with a mass of 19 gm/mol or less. The O-H and N-H stretching frequencies fall in the 3700 to 2500 cm-1 region, with various intensities. Hydrogen bonding has significant influence on the peak shape and intensity, generally causing peak broadening and shifts in absorption to lower frequencies. Broad absorption bands found in the calcium soaps closer to 3400 cm-1 are attributed to the presence of H-bonded OH stretch of hydrated water. This spectral observation also represents the polar end of the soap structure (Koga, et al., 1960; Shoeb, et al., 1999).
Both the soap produced with canola and calcium chloride, or canola with calcium hydroxide displayed stronger absorption band closer to 3400 cm-1 than the soap produced with a saturated fat (beef tallow) as shown in Table 1.2. However, stronger metal oxygen bands were observed only in canola soaps. This observation indicates that beef tallow could not produce a significant amount of soap to display a strong metal oxygen bond. The absorption band closer to 3400 cm-1, however, validates the presence of soap in the beef tallow solid formation.
Figure 1.2 2D Line plot of calcium soap with calcium chloride showing peak locations
Wave number (cm-1)
· Part 2 (1800-1350 cm-1)
This spectral region represents the total disappearance of the C=O stretching vibration (near 1745 cm-1), which is attributed to the ester bond present in triacylglycerol (TAG) and appearance of the carboxylate group of the fatty acid metallic salt (the symmetric stretching vibration, ω1, between 1420 and 1300 cm-1, the asymmetric stretching vibration, ω2, between 1610 and 1550 cm-1, and a bending vibration, ω3, between 950 and 800 cm-1) (Poulenat et al., 2003). As can be seen in Table 1.2, both the symmetric and asymmetric carboxylate group bands appeared in the canola soap with calcium hydroxide. The appearance of these group bands indicates the ionized structure of the calcium soap and that the etaloxygen bond in the soap has also an ionic character (Mehrotra et al., 1994; Mehrotra and Upadhyaya, Wave number (cm-1) Absorbance 1987). The asymmetric and symmetric stretching vibrations were split into two absorption bands (1570-1541 cm-1, and 1462-1419 cm-1 respectively) in canola soap with calcium hydroxide (Experiment 6b) and three symmetric stretching vibrations (1463, 1420, and 1404 cm-1) in beef tallow soap with calcium chloride @22°C (Experiment 7). A single stretching vibration (1456 cm-1) was observed in canola soap with calcium chloride (Experiment 6a) and another single stretching vibration (1461 cm-1) in beef tallow soap with calcium chloride @45°C (Experiment 8). A single symmetric stretching vibration (1313 cm-1) for canola soap with Ca(OH)2, a double stretching vibration (1385 and 1353 cm-1) for BT @22°C, and another single 1380 cm-1 were observed for BT @45°C. Bending vibrations were also observed for canola soap with Ca(OH)2 and BT @22°C. No symmetric and bending vibrations for canola with CaCl2 and no bending for BT with CaCl2 @45°C were observed. Hence the structure of the molecule would be more like type I than type II (Figure 5).
Figure 5. Structure of soap molecule displaying the ionized carboxyl group (Koga and Matuura, 1960)
· Part 3 (1350-1180 cm-1 and near 720 cm-1)
The spectral region between 1350 and 1180 cm-1 represents the presence of aliphatic chains. The skeletal C-C vibrations were observed in each of the calcium soaps in Table 3. The presence of weak glycerin absorption bands was also observed between 1150 and 850 cm-1 (i.e., 1107, 1103, 1101, 1066, 1046, 965, and 914 cm-1) which indicates the formation of crude soap. Crude soap is a mixture containing soap, glycerin, residual alkali, and triacylglycerols (Varma, et al., 2000; Mehrotra, et al., 1994). In the vicinity of 720 cm-1, absorption bands (722, 720, and 712 cm-1) representing rocking vibrations of successive methylene, -CH2-, groups were observed in all crude soaps. The rocking vibrations of methylene absorption bands at 1722 cm-1 were the strongest for pure oil. As more soap was formed, the peak at 1722 cm-1 decreases while the metal oxygen vibration bond in the vicinity of 670 cm-1 increases with time.
· Part 4 (670-440 cm-1)
The spectral observation in the vicinity of 670 cm-1 represents the presence of Ca-O bonds. The strength of Ca-O bond coincides with the strength of the absorption bands in calcium soaps. The calcium soaps produced with both calcium chloride and calcium hydroxide at very high pH and room temperature displayed very strong absorption bands in this region (674 and 675 cm-1). The failure to observe the metal oxygen band in beef tallow at room temperature condition (Table 1.2) led to the same experimentation under warmer environment. The beef tallow soap produced with calcium chloride under very high pH and warm conditions (45°C), however, displayed only a weak metal oxygen band (685 cm-1).
Table 1.2. Comparisons of observed wave frequencies among calcium soaps
| Frequencies (cm-1) | ||||
|---|---|---|---|---|
| Canola with CaC12 | Canola with CA(OH)2 | Beef Tallow with CaCl2 @ 22oC | Beef Tallow with CaCl2 @ 45oC | Assignments |
| 3639 (n, w) | Non binded hydroxol group, OH stretch | |||
| 3558 (n, vw) | Tertuart alcohol, OH stretch | |||
| 3367 (b, ms) | 3881 (b, ms) | 3464 (b, vw) | 3390 (b vw) | Hydroxy group, H-bonded OH stretch |
| 3010 (vw) | 3011 (vw) | 3001 (vw) | Stretching = CH-H | |
| 2924 (s) | Asymmetric stretching CH2, C-H | |||
| 2857 (w) | Symmetric stretching CH2, C-H | |||
| 1744 (s) | 1744 (w) | 1739 (vs) | 1741 (vs) | Stretching C=O (ester) |
| 1702 (vw) | 1696 (vw) | C=C stretching | ||
| 1637 (s) | 1641 (w) | 1640 (vw) | ||
| 1570 (ms) | Asymmetric stretching COO-, C-O (ω2) | |||
| 1541 (ms) | ||||
| 1456 (w) | 1462 (s) | 1463 (w) | 1461 (w) | |
| 1419 (s) | 1420 (vw) | |||
| 1404 (vw) | ||||
| 1385 (vw) | 1380 (vw) | Symmetric stretching COOO-, C-) (ω1) | ||
| 1313 (w) | 1353 (vw) | |||
| 1279 (w) | Twist and wag CH2 | |||
| 1234 (w) | 1240 (w) | 1243 (w) | 1232 (w) | Skeletal C-C vibrations |
| 1231 | Rocking CH3 | |||
| 1159 (s) | 1164 (w) | 1171 (vs) | 1169 (ms) | Deformation COOR |
| 1103 (w) | 1107 (w) | 1101 (w) | 1103 (w) | Glycerin |
| 1046 (w) | 1066 (vw) | Glycerin | ||
| 965 (vw) | 964 (vw) | Glycerin | ||
| 914 (w) | Bending deformation COO- (ω3) or glycerin | |||
| 837 (vw) | ||||
| 713 (vs) | 722 (w) | 720 (s) | Rocking (CH2)n, n>4 | |
| 697 (vw) | ||||
| 675 (vs) | 674 (vs) | 685 (w) | Metal-O bond | |
| 645 | OH out-of-plane bebd | |||
| 599 (vs) | 601 (vs( | 591 (w) | ||
| Abbreviations are explained in Table 5. | ||||
Figure 1.3. 2D Line plots of calcium soap, Canola oil, and calcium chloride solutions
Fatty Acid Compositions
The mass percentage of each type of fat (saturated, monounsaturated, and polyunsaturated) obtained in the calcium soaps were not found to be statistically different compared to the source fats and oils (i.e. Canola and Beef Tallow) as shown in Table 1.3. The primary fatty acids obtained from the GC analyses were the same for all the calcium soaps. However, it is important to mention that although Canola and Beef Tallow had other saturated fatty acids (e.g. Myristic Acid, Stearic acid, etc.) present in the pure fat, the primary acid being used in the soap formation was found to be palmitic as been observed by Keener et al. (2008) with the real FOG deposit samples.
Table 1.3. Comparison between Fatty acid and compositions of different calcium soaps
| Samples/Expt # | Saturated (wt%) | Primary Saturated Fat | Monosaturated (wt%) | Primary Monounsaturated Fat | Polysaturated (wt%) | Primary Polyunsaturated Fat |
|---|---|---|---|---|---|---|
| Canola | 7.60 | Palmitic | 64.04 | Oleic (cis) | 27.36 | Lino-Oleic (cis) |
| Beef Tallow | 49.19 | Palmitic | 46.26 | Oleic (cis) | 2.82 | Lino-Oleic (cis) |
| 6a | 8.82 | Palmitic | 61.12 | Oleic (cis) | 30.06 | Lino-Oleic (cis) |
| 6b | 7.99 | Palmitic | 65.30 | Oleic (cis) | 25.94 | Lino-Oleic (cis) |
| 8 | 47.17 | Palmitic | 49.28 | Oleic (cis) | 2.88 | Lino-Oleic (cis) |
| 10 | 7.98 | Palmitic | 60.76 | Oleic (cis) | 31.26 | Lino-Oleic (cis) |
| 11a2 | 5.83 | Palmitic | 62.17 | Oleic (cis) | 32.00 | Lino-Oleic (cis) |
| 11b | 8.19 | Palmitic | 58.55 | Oleic (cis) | 32.25 | Lino-Oleic (cis) |
| 12 | 7.52 | Palmitic | 60.36 | Oleic (cis) | 32.12 | Lino-Oleic (cis) |
| The amount of soap formation was determined using equation 3 | ||||||
Equation 1 was an enhancement to Poulenat et al. (2003) approach as a number of additional bands were necessary to track the production of calcium based soaps. Figure 1.4 displays noticeable gradual appearances of O-H stretching vibration bands (close to 3400 cm-1), metal-oxygen bands (close to 670 cm-1), and gradual weakening of C=O ester band (1745 cm-1). The phenomenon displaying appearance/disappearance of absorption bands indicates formation of calcium soap.
The kinetic data in Figure 1.5a shows that 100% soap was formed in three hours under very high pH condition (pH>>14). However, the result also indicates that the frequency of data collection should be increased to properly capture the shape of the curve. For pH 10 and below, soap making process stays in the initial retardation period until about 6 hrs (Figure 1.5b). The maximum amount of canola soap (with calcium chloride) observed at both pH 7 & 10 was about 20 percent. There was always approximately 6% of soap being produced as soon as the components were mixed. This phenomenon may be attributable to the presence on some free fatty acid in the initial fat.
As the project moves forward, other additional methods will be used to initiate hydrolysis and allow for the reactions to take place between the free fatty acids and calcium.
Figure 1.4 A 3D waterfall graph of a single batch data showing disappearance and appearance of related absorption bands
Conclusion:
The calcium soaps produced to date displayed same characteristic differences indicating the influence of pH, temperature, and the type of fat being used in the soap making process. In addition, there seems to be some sensitivity to the form of calcium that is introduced at the start of the soap making process and needs to be investigated further. The calcium soaps under alkali hydrolysis (pH>>14) took 3 hours to produce 100% soap. As the pH decreased, the soap formation rate was significantly slower with only 20 percent of the soap being produced after 8hrs under high pH conditions.
Figure 1.5a. Kinetics of calcium soaps in different environmental conditions
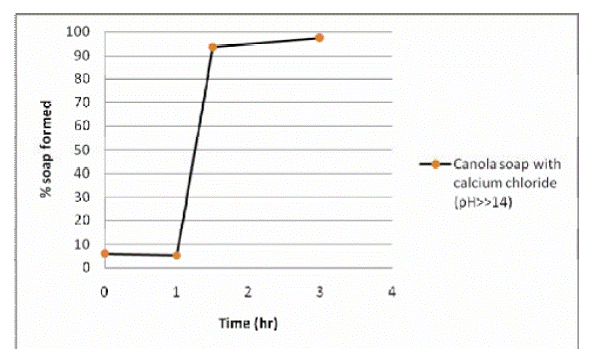
Figure 1.5b. Kinetics of calcium soaps in different environmental conditions

Task 2: Determine the effect of mixing intensity, water hardness, initial free fatty acid, detergent type, and oil rancidity on the formation rate and physical characteristics of the FOG deposit.
No Progress on this task
Task 3: Evaluate the Cotte, et al. (2006) and Foubert, et al. (2002) numerical models for simulating FOG deposit formation kinetics.
No Progress on this task
Task 5: Bench-scale investigation of enhanced FOG separation
Jar test apparatus was setup in the lab to mimic the coagulation and flocculation process that may be used as a conditioning step prior to gravity separation with the current retention grease interceptor (RGI). Initial tests were performed with Alum coagulant. pH was adjusted with appropriate amount of acid (0.1 N of H2SO4) or base (0.1 N of NaOH) to achieve a target coagulation mechanism (i.e., charge neutralization or sweep floc). Figure 5.1 displays the flocs produced in the jars with alum addition. The total oil and grease (TOG) was performed with the EPA Method 1664: N-Hexane Extractable Material (HEM; Oil and Grease) and Silica Gel Treated N-Hexane Extractable Material (SGT-HEM; Non-polar Material) by Extraction and Gravimetry.
FOG samples were collected from a FSE waste discharge (a campus dining hall at NCSU) upstream from the GI influent. For the jar test experiments, the supernatant was collected at the end of quiescent separation stage for FOG removal determination. Jar tests included 1 minute of rapid mixing, 10 minutes of flocculation, and 10 minutes of quiescent separation. Alum concentrations ranged from 0 mg/L to 60 mg/L at a pH=7. Table 5.1 displays the results of FOG concentration and FOG removal rate for each jars. In Table 5.1, the results clearly show a decreasing FOG concentration and thus increasing removal percentage with increasing coagulant addition. However, when Alum addition was below 30 mg/L, the removal rates were less than 25% while above 30 mg/L, the coagulation removal jumped above 50% (Figure 5.2). The low percent removal may be due to several items including potential interference of alum with FOG in the HEM procedure, insufficient flocculation time, as well as Alum being a suboptimal coagulant for FOG removal. A series of additional experiments were performed to investigate if there were any associated interference caused by the introduction of Alum in the FOG sample when performing HEM FOG measurements.
Currently, there are no previous studies in the literature that examine the impact of coagulants with FOG on the HEM process (i.e., interference of coagulant with FOG). Samples were made of a mixture of DI water and Alum to determine if the addition of Alum would produce a false positive. Alum concentrations of 10-, 30-, and 50 mg/L were tested. pH value was adjusted to 4.5 and 7.5 for each concentration to mimic the 2 coagulation mechanisms (i.e., charge neutralization and sweep floc by alum hydroxide precipitates) .
The results from these false positive experiments show that at pH = 4.5, for alum concentration of 10, 30, and 50 mg/L, the average recovered mass was 2.4 mg, with minimum recovered mass of 0.7 mg and maximum of 4.8 mg. At pH = 7.5, the average recovered mass was 2.1 mg, with minimum recovered mass of 0.9 mg and maximum of 4.4 mg. The average recovered mass for all the above experiments was 2.2 mg.
The recovered mass was always positive meaning that the HEM process seems to pickup weight during the extraction process. The gained weights were between 0.7 mg and 4.8 mg, which could be small when the FOG content is greater than 200 mg/L. When no alum was added to determine the baseline of the extraction process, the results showed an average of 2.3 mg recovered mass gain. The gained mass for the blank sample were similar to the weight gain with alum addition. Therefore, alum does not display a false positive result during the extraction process. However, changes to the testing procedure will be performed to reduce the weight addition during the HEM procedure.
Adhesion analysis was also performed to determine how much FOG was lost during sample transfer: (i.e., sample to jar test or jar test to HEM measurement tests). Samples with FOG concentration of 150 mg/L were prepared in 0.2 L mason jars. Table 5.2 displays the adhesion results The “Oil Mass Added” in Table 5.2 was the measured oil mass added to water to make the oil solution concentration. For an oil concentration of 150 mg/L, the oil mass is 0.0300 gram. The “Recovered Mass”, which was the measured amount, varied among the three samples with one displaying a significant mass gain while another displaying mass loss. These tests will be repeated as the variation cannot be explained.
Surface charge measurements were conducted using an electro-kinetic charge analyzer (ECA). Charge titrations were performed with the ECA to determine the coagulant dose associated with charge neutralization. ECA analysis was conducted with a sample collected from campus dining hall, and titrated with increasing coagulant dose.
Figure 5.1 displays the ECA streaming values with the addition of alum concentration in mg/L. The sample’s ECA streaming value started with -4.44, and increased gradually with the addition of alum. When alum addition was 60 mg/L, which was the highest amount tested previously during the jar test experiments, the sample ECA reading was -2.90. These ECA results suggest that higher alum coagulant concentrations should be attempted. However, the jar test results discussed earlier displayed no significant improvement in FOG removal occurred beyond an alum concentration of 30 mg/L. It’s possible that while the solution charge continued to drop, the additional alum produced alum precipitates that did not enhance the gravity separation process and may have allowed for residual oil and grease to remain encapsulated within the alum precipitates. More investigation will be performed to determine if this residual oil and grease encapsulation is occurring.
Table 5.1. Recovered FOG Concentration and FOG Recovered Rate after Jar Testing with Various Coagulant Additions.
| Jar | Coagullant Addition (mg/L) | FOG Concentration (mg/L) | Recovered Rate (%) |
|---|---|---|---|
| 1 | 0 | 133.5 | 22.4% |
| 2 | 20 | 131 | 23.8% |
| 3 | 30 | 142.5 | 17.2% |
| 4 | 40 | 74 | 57.0% |
| 5 | 60 | 86 | 50.0% |
| 6 | 60 | 71 | 52.9% |
Figure 5.2. FOG Removal Rate after Jar Testing with Various Coagulant Additions.
Table 5.2. Adhesion Results 150 mg/L of oil concentration.
| Oil Concentration (mg/L) | Oil Mass Added (gram) | Recovered Mass (gram) |
|---|---|---|
| 150 | 0.0305 | 0.0272 |
| 0.0301 | 0.0301 | |
| 0.0302 | 0.0342 |

Figure 5.3. Solids occurred in hexane layer during extraction process.

Figure 5.4. ECA Analysis with various alum dose.
Task 6: Construct a pilot scale sewer collection system.
In this project, two different pilot collection systems were designed and compared in terms cost and operation feasibility. Collection System #1 (Figure 6.1) was designed to accommodate a 3 hour residence time within the piping system while Collection System #2 (Figure 6.2) was designed to produce an intermittent contact time between the FOG/calcium aqueous solution and the pipe wall perimeter. Both alternatives have advantages, but from engineering and operation point of view, the Collection System #2 is less complicated, has a smaller footprint, and a lower estimated cost than Collection System #1. Therefore, Collection System #2 was recommended for this project.
Figure 6.1a Conceptual isometric view of System #1.
Figure 6.1b Plan view of System #1.
Figure 6.2a Plan View of System #2.
Figure 6.2b: Details for pipeline with and without hydraulic structure, and pipe cross section.
Task 7: Perform Pilot Scale experiments.
No Progress on this task
Task 8: Modify the EPA SWMM model to include FOG deposit formation kinetics.
The Harrison-Pointe shopping center located in Cary, North Carolina, was identified as a segment of the full scale sewer collection system to model using EPA SWMM. The total acreage is 124,000 sq ft. Harrison-Pointe shopping center has a number of FSE’s and has the facility for development of additional establishments. The effect of development of additional establishments on the FOG deposit buildup can be analyzed by comparing the two cases. A GIS image of the Harrison-Point shopping center is provided below. The FSE’s are represented on the model as sub-catchment areas. The nodes represent the manholes connected by the conduits.
Figure 8.1: Harrison-Pointe Shopping center
Task 9: Simulate pilot scale sewer collection system.
No Progress on this task
Task 10: Apply EPA SWMM FOG model to a full scale sewer collection system.
No Progress on this task
Report 8 - Project to Date Budget/Expense Summary
As of July 31, 2010
Project/Project Reference: 550897 / 050897
| Description | An integrated approach to understanding and Reducing Fat OIl and Grease (FOG) Deposit Formation for Sustainable Sewer Collection Systems | ||||
|---|---|---|---|---|---|
| Short Description: | Understanding & Reducing FOG | Budget Period: | 08/01/2009 - 07/31/2012 | ||
| PI Name: | DUCOSTE, J | Project Period: | 08/01/2009 - 07/31/2012 | ||
| Sponsor: | EPA | Status: | Active (A) | ||
| Department: | Civil Engr Contracts & Grants (140340) | F&A Rage: | 48.5% (1st$25K) | ||
| Description | Budget | Current Month Activity | FYTD/PTD Activity | Encumberances | Budget Balance Available |
| Salaries - Budget Pool | 0.00 | 0.00 | 0.00 | 0.00 | 0.00 |
| EPA Non-Teaching Salaries | 177,449.00 | 8,606.24 | 38,922.49 | 36,555.84 | 101,972.67 |
| SPA Employees Salary | 20,000.00 | 0.00 | 0.00 | 0.00 | 20,000.00 |
| EPA Teaching Salaries | 0.00 | 0.00 | 0.00 | 0.00 | 0.00 |
| Temporary Wages | 11,917.00 | 575.00 | 1,579.82 | 0.00 | 10,337.18 |
| Other Personnel Costs | 0.00 | 0.00 | 0.00 | 0.00 | 0.00 |
| Fringe Benefits | 35,518.00 | 1,574.72 | 5,614.84 | 1,398.15 | 28,504.99 |
| Total Personnel Costs | 244,884.00 | 10,755.96 | 46,117.13 | 37,952.03 | 160,814.84 |
| Contracted Services | 0.00 | 0.00 | 0.00 | 0.00 | 0.00 |
| Supplies and Materials | 65,000.00 | 529.89 | 6,198.85 | 152.09 | 58,649.06 |
| Travel - Domestic | 12,000.00 | 0.00 | 0.00 | 0.00 | 12,000.00 |
| Travel - Foreign | 0.00 | 0.00 | 0.00 | 0.00 | 0.00 |
| Current Services | 0.00 | 0.00 | 0.00 | 0.00 | 0.00 |
| Fixed Charges | 27,000.00 | 0.00 | 0.00 | 0.00 | 27,000.00 |
| Equipment | 0.00 | 0.00 | 0.00 | 0.00 | 0.00 |
| Student Aid | 49,730.00 | 0.00 | 12,214.00 | 0.00 | 37,516.00 |
| Subcontractors | 0.00 | 0.00 | 0.00 | 0.00 | 0.00 |
| Other Charges | 0.00 | 0.00 | 0.00 | 0.00 | 0.00 |
| Budget Pool | 0.00 | 0.00 | 0.00 | 0.00 | 0.00 |
| Total Non-Personnel Costs | 153.730.00 | 529.89 | 18,412.82 | 152.09 | 135,185.06 |
| Total Direct Costs | 398,614.00 | 11,285.85 | 64,529.98 | 0.00 | 295,979.90 |
| Total Indirect Costs | 170,954.00 | 5,473.63 | 25,373.30 | 0.00 | 145,580.70 |
| Total Costs | 569,568.00 | 16,759.48 | 89,903.28 | 38,104.12 | 441,560.60 |
Future Activities:
Future work includes repeating experiments of those performed to date and more investigations on the effect of oil/fat type and concentration, process temperature, and pH on the formation rate as well as physical characteristics of calcium soaps using different sources of calcium.
Journal Articles:
No journal articles submitted with this report: View all 19 publications for this projectSupplemental Keywords:
wastewater, treatment, separation, engineering, modeling, pollution prevention, sewer collection system, SSO, FOG, chemical transport;Progress and Final Reports:
Original AbstractThe perspectives, information and conclusions conveyed in research project abstracts, progress reports, final reports, journal abstracts and journal publications convey the viewpoints of the principal investigator and may not represent the views and policies of ORD and EPA. Conclusions drawn by the principal investigators have not been reviewed by the Agency.