
Grantee Research Project Results
2013 Progress Report: Measures of Distribution System Water Quality and Their Relation to Health Outcomes in Atlanta
EPA Grant Number: R834250Title: Measures of Distribution System Water Quality and Their Relation to Health Outcomes in Atlanta
Investigators: Moe, Christine L. , Tolbert, Paige , Klein, Mitchel , Uber, Jim , Sarnat, Stefanie Ebelt , Levy, Karen
Current Investigators: Moe, Christine L. , Sarnat, Stefanie Ebelt , Kirby, Amy , Levy, Karen , Klein, Mitchel , Tolbert, Paige
Institution: Rollins School of Public Health, Emory University
EPA Project Officer: Page, Angela
Project Period: July 1, 2009 through June 30, 2012 (Extended to June 30, 2014)
Project Period Covered by this Report: August 1, 2012 through July 31,2013
Project Amount: $599,756
RFA: Innovative and Integrative Approaches for Advancing Public Health Protection Through Water Infrastructure Sustainability (2008) RFA Text | Recipients Lists
Research Category: Pollution Prevention/Sustainable Development , Water , Sustainable and Healthy Communities
Objective:
The investigators proposed research to link health outcomes, quantified through emergency department (ED) visits for gastrointestinal (GI) illness, to distribution system water quality and infrastructure characteristics. In addition, the investigators proposed an integrative approach for characterizing health risks associated with microbial contamination of drinking water distribution systems through the development of vulnerability assessments and the implementation of an innovative automated continuous water quality monitor for use in distribution systems.
This study has four aims:
Aim A (Spatially refined analysis): Refine the previously conducted analyses assessing the association between rates of ED visits for GI illness and estimated residence times of drinking water serving the study area of two utilities, using geocoded patient address data to identify the closest node in the distribution system.
Aim B (1993-2004, 2005-2009, 1993-2009 analysis): Extend the previously conducted analyses assessing the association between rates of ED visits for GI illness and estimated residence times of drinking water serving the service area of two utilities by considering data from these utilities covering 2005 through 2009.
Aim C (Vulnerability assessment): Assess the association between rates of ED visits for GI illness and exposure metrics derived from the results of the vulnerability assessment. Compare these associations to those observed when only chlorine residual or water age metrics are considered as the exposure. One distribution system will be studied.
Aim D (AMS evaluation of vulnerability assessment results): Use an automated monitoring system (AMS) to examine the results of the vulnerability assessment by comparing continuously monitored water quality in areas of the distribution system predicted to be “high risk” for microbial contamination to areas predicted to be “low risk."
Progress Summary:
Aim A
We have completed analyses for Aim A. Much of Year 4 was devoted to checking and merging of datasets (i.e., data on estimates of water age at nodes in the hydraulic model with geocoded data on emergency department visits) in GIS. This took longer than expected because we had to reconcile some unexpected differences between the datasets. After this was resolved we spent time developing the epidemiologic models to assess the association between water age and emergency department visits for GI illness. We expect to write up these results for publication in 2014.
Aim B
We have obtained and processed the relevant health outcome data to carry out the analyses for Aim B, and we have obtained the water production data from both of our collaborating metro Atlanta water utilities. At this time, we are waiting for our subcontractor Dr. James Uber at the University of Cincinnati to provide water residence time estimates through 2009.
Aim C
The assessment of microbial health risks due to low-pressure intrusion events has received increased attention in recent years, due to concerns that drinking water may contribute a significant fraction of gastrointestinal disease burden within a community. While recent efforts to estimate the health risks from low-pressure intrusion events have shown impressive progress, they would benefit from a general risk assessment framework for water distribution systems. We selected water Utility A for performing the vulnerability assessment because its water distribution system is representative of many older cities in the eastern United States.
Using historical data, we examined three risk factors for distribution system water quality: 1) water residence time; 2) frequency of water main breaks; and 4) frequency of low-pressure (<20 PSI) events.
Using geocoded estimates of water residence time provided by Dr. Uber and the results of Aim A that indicated increased risk of GI illness in geographic locations with water residence times of >100 hours, we analyzed the water residence time dataset for the water distribution system of Utility A using SaTScan v. 9.1.1 software (SaTScan, Boston, MA) and a Ripley’s K function. This analysis identifies spatial clusters and ranks them by statistical likelihood. The cluster with the highest likelihood is the primary cluster and all other clusters are secondary. The center of each cluster and an area around each center point with a radius identified by the SaTScan output was mapped using ArcGIS 10.1 software (ESRI, Redlands, CA). Only nodes with an estimated water residence time ≥ 100 hours were included in the analysis. The nodes and clusters identified by these analyses are shown in Figures 1 and 2.
Figure 1. Primary and Secondary Clusters of Nodes with Estimated Long Water Residence Times (> 100 hours) in Utility A. This figure shows only those nodes within the utility service area that have an estimated water residence time longer than 100 hours (n = 98), obtained from the model. The colors in the map reflect varying water residence times, ranging from 101 hours to the maximum of 335 hours.
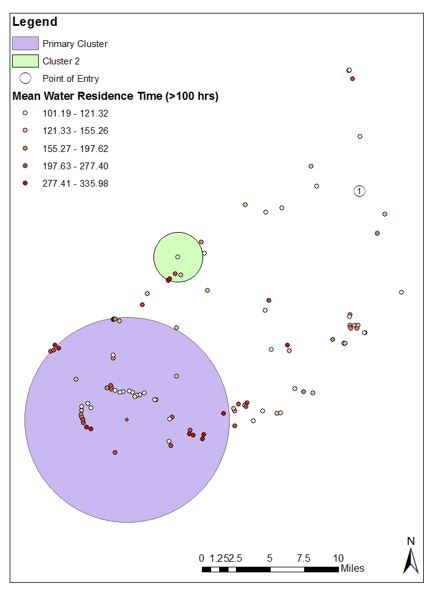
This figure shows the primary and secondary cluster identified by SaTScan cluster analysis on the estimated long water residence time data.
Primary cluster: (p-value < 0.000000000000000010, relative risk = 62.18)
Secondary cluster: (p-value = 0.0021, relative risk = 19.24)
Figure 2A. Clusters identified using SaTScan analysis, from 2010-2011 historical mains breaks data in the Distribution System of Utility A. Total N = 344; N for 2010 = 221; N for 2011 = 123
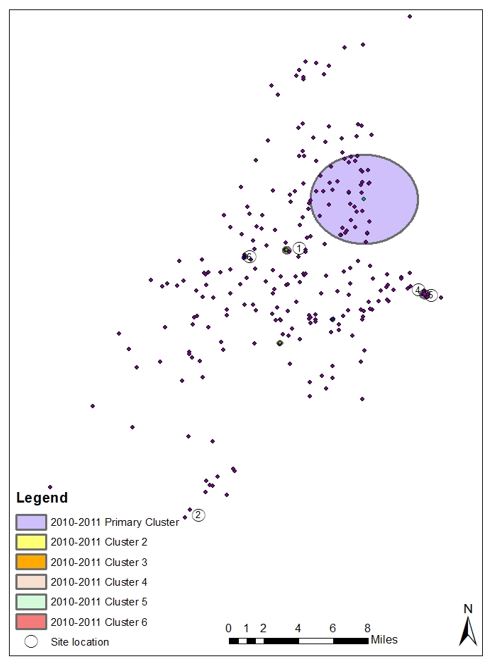
Figure 2B. Close up view of clusters identified using SaTScan analysis, from 2010-2011 historical mains breaks data in the distribution system of Utility A.
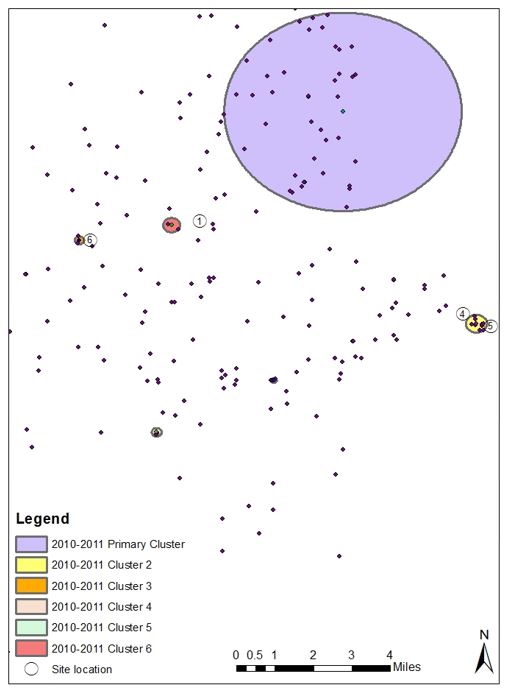
We used the same approach to identify areas in the distribution system that had increased vulnerability due to frequency of main breaks. The utility provided data on main breaks occurring between 2010 and 2011. This dataset included scheduled repairs and renovations of the DS pipes, as well as unexpected breaks. Statistically significant geographic clustering of main breaks occurring between January 2010 and December 2011 were identified and are shown in Figures 3 and 4.
Figure 3. Data from in-line pressure monitor at one site with greatest frequency of low-pressure events in 2011.
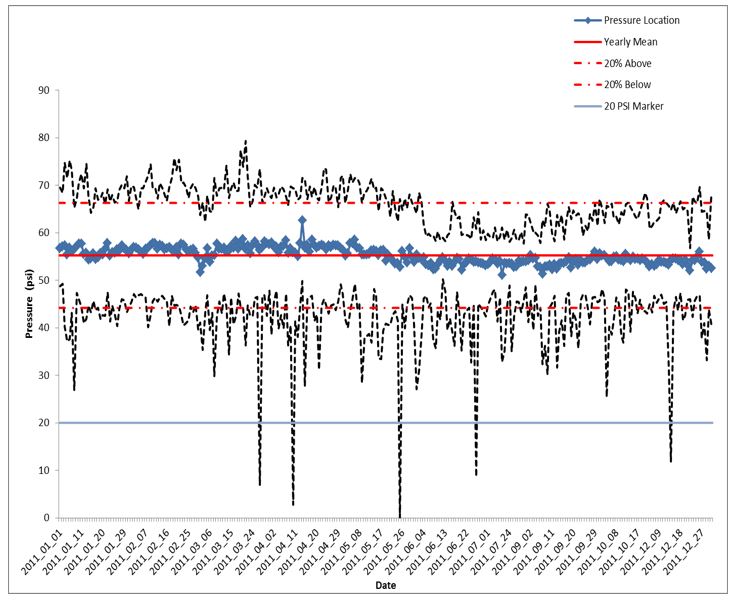
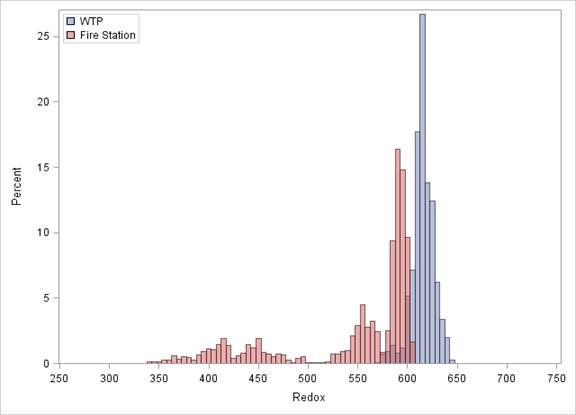
Figure 4. Histogram of Redox (mV) at WTP (n = 160,249) and Fire Station A (n = 157,901)
Finally, we examined frequency of pressure loss events using data from 37 in-line pressure monitors collected during 2011 and provided by the utility. These monitors were not associated with any other equipment, and therefore, provided the best record of water pressure within the DS pipes. The pressure data consisted of hourly pressure averages, minimums, and maximums, calculated from readings every 15 seconds. The hourly averages were used to calculate daily averages for each site. The lowest hourly minimum and highest hourly maximum values became the daily minimum and maximum, respectively. The number of pressure loss events, defined as <20 PSI for any length of time, was calculated for each site. Figure 5 illustrates this analysis for one site.
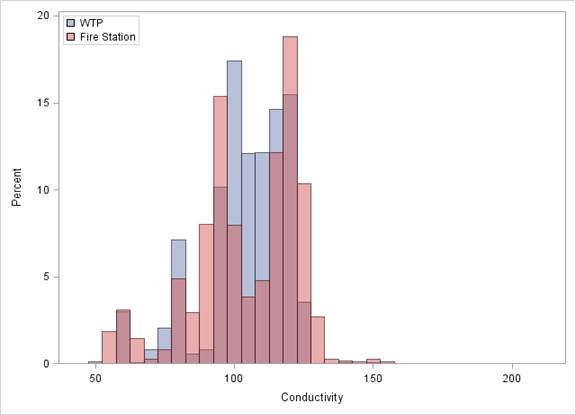
Figure 5. Histogram of Conductivity at WTP (n = 161,369) and Fire Station A (n = 157,901)
It is important to note that these sites of potential vulnerability to water quality degradation were identified based on historical data, and these parameters were not measured at all these sites during the study period. For the main breaks and pressure loss data, the observed vulnerability may not necessarily be the events themselves, but may reflect the larger infrastructure issues that predispose a site to main breaks or pressure loss.
There are no specific U.S. standards for drinking water redox levels, and many experts state that maximum redox levels should be recommended on a case-by-case basis. Most US tap water has a redox between 200-650 mV. The WTP redox levels were generally higher and tighter with a range of about 570 – 640 mV. The redox levels at Fire station A had a wider range of about 340 – 610 mV.
A very similar pattern of conductivity measurements was observed in both locations. Fire Station A did have a slightly larger span of data seen on a daily basis, but the range remained between 50-150 uS/cm There are no national drinking water standards for conductivity, but the typical range safe for consumption is 0-800 uS/cm.
Aim D
The AMS device has been installed in three locations:
- Water treatment plant: Jan-Sept 2012
- DS monitoring site 1 (Fire station A): Sept 2012-March 2013
- DS monitoring site 2 (Fire station B): April 2013 – June 2013
The AMS device monitors seven parameters:
- Redox, conductivity, pH, and temperature data collected once per minute
- Chlorine, turbidity collected once every 5 seconds
- Pressure collected once every second
Analysis of this data is in progress.
Future Activities:
Year 5 Goals:
- We plan to complete the manuscript describing the analyses for Aim A in 2014 and submit this work for publication.
- The spatial analyses for Aim C are complete, and we used the results of these analyses to guide the placement of the AMS device for Aim D. We are working on figures to illustrate the results of these spatial analyses for the final report and publications.
- The data collection for Aim D is complete. The analyses of the AMS data for two locations are complete. The analysis of the data from the third location is in progress. We are working on a manuscript that combines the physical-chemical data from the AMS with the microbiological water quality data from large volume water samples collected at the AMS locations. The water sampling and microbiological analyses were supported by a grant from the Water Research Foundation. We plan to complete this manuscript in summer 2014.
- At this time, we are waiting to receive the necessary information from our subcontractor, Dr. Uber, in order to conduct the analyses for Aim B.
Journal Articles:
No journal articles submitted with this report: View all 14 publications for this projectProgress and Final Reports:
Original AbstractThe perspectives, information and conclusions conveyed in research project abstracts, progress reports, final reports, journal abstracts and journal publications convey the viewpoints of the principal investigator and may not represent the views and policies of ORD and EPA. Conclusions drawn by the principal investigators have not been reviewed by the Agency.