
Grantee Research Project Results
Final Report: The Learning Barge: Environmental + Cultural Ecologies on the Elizabeth River
EPA Grant Number: SU833802Title: The Learning Barge: Environmental + Cultural Ecologies on the Elizabeth River
Investigators: Crisman, Phoebe
Institution: University of Virginia
EPA Project Officer: Page, Angela
Phase: II
Project Period: August 31, 2007 through August 31, 2008
Project Amount: $75,000
RFA: P3 Awards: A National Student Design Competition for Sustainability Focusing on People, Prosperity and the Planet - Phase 2 (2007) Recipients Lists
Research Category: Pollution Prevention/Sustainable Development , P3 Awards , P3 Challenge Area - Sustainable and Healthy Communities , Sustainable and Healthy Communities
Objective:
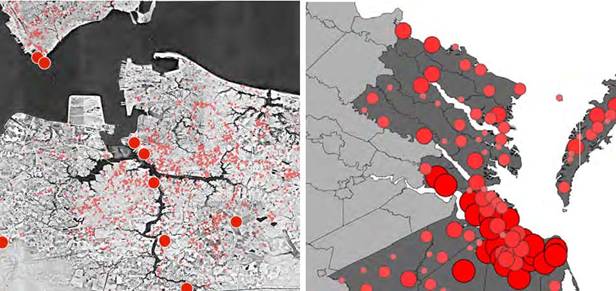
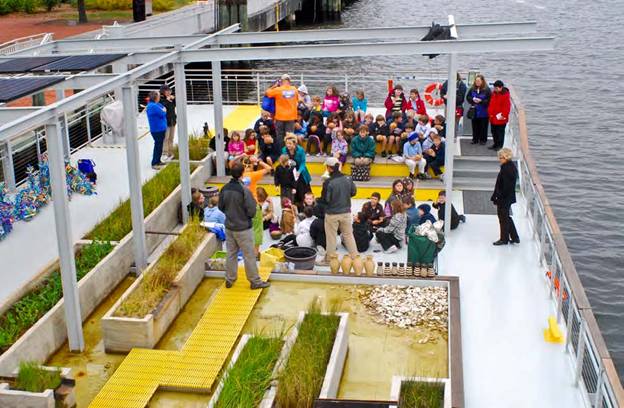
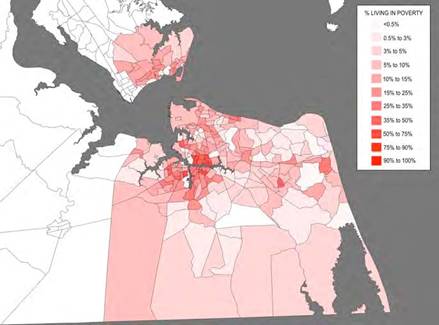
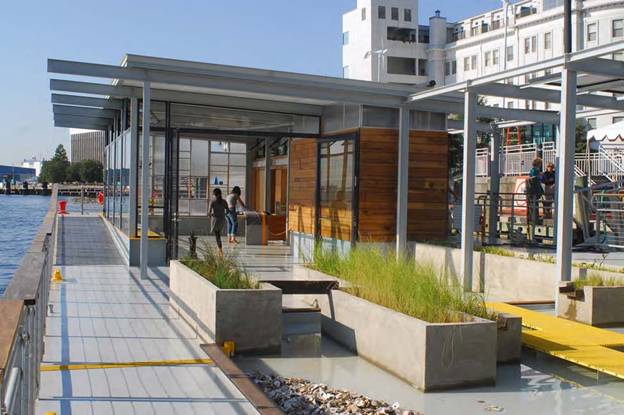
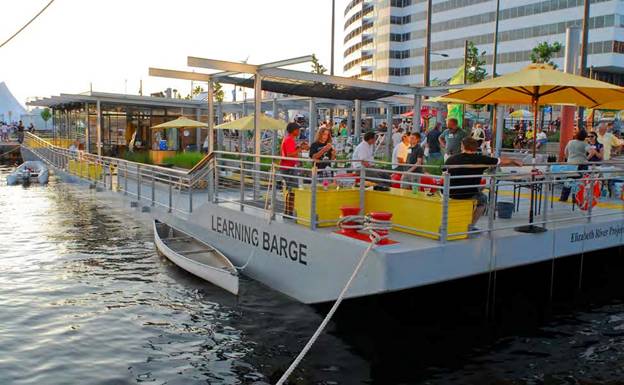
The Phase II objective was to create an innovative and exemplary energy self-sustaining educational environment whose physical design is an integral part of the Elizabeth River Project’s educational outreach programs (figs.6&7). The Barge would traverse the Elizabeth River—a culturally complex, economically challenged, pollution ridden tidal estuary with river health indicators that show a high level of PAHs, instances of cancer, reduced biomass, and degenerating biodiversity. The Barge would tell and embody the story of the inextricable link between water and land, as well as the crucial balance between industrialized human activity and natural environment on the River. This agenda led to numerous design investigations all structured by the context of sustainability. The 32’x120’ Learning Barge is independent of the power, water and waste grid by generating power from the sun and wind, optimizing efficiency and reducing consumption. Daylight and natural ventilation are maximized to reduce electricity demand and negate the need for air conditioning. All rainwater is collected and filtered for non-potable use. The wetland basins filter graywater and two composting toilets are used. The design uses cost effective building techniques to reduce material waste and recycled low maintenance, and durable green materials are utilized. The team discovered there is not a LEED certification for marine vessels and proposed a pilot program to the USGBC, but the project timeline did not allow such a program to be developed. Unlike conventional projects, environmental, technical, aesthetic, social and economic concerns have been balanced throughout the process.
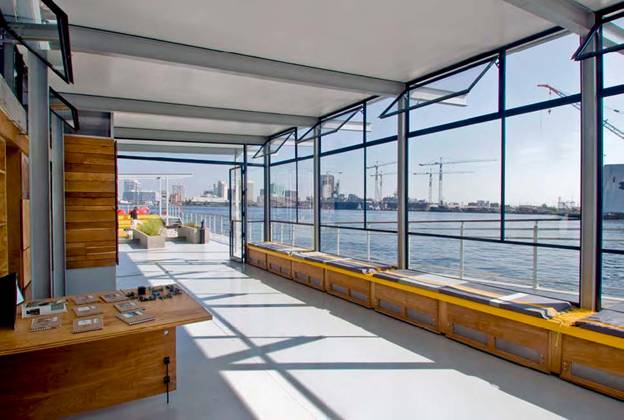
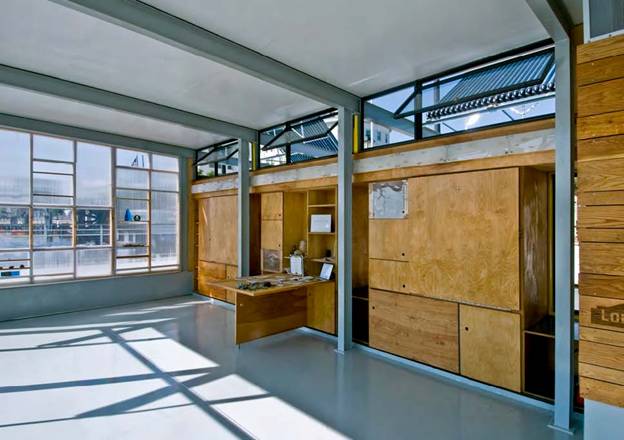
View from onboard wetland filtration basins to classroom “River Lab” beyond. 11 The RiverLab classroom is passively cool by operable windows and high ceilings in summer and heated by a solar thermal system in winter.
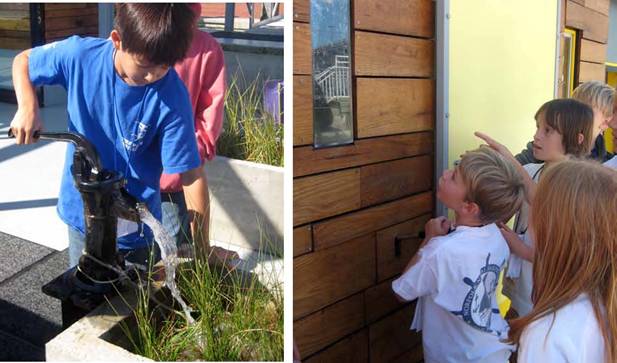
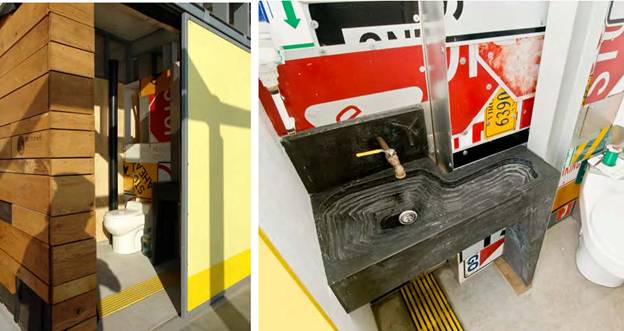
Composting toilet and recycled sign wall. 13 Cast concrete ‘topography’ sink models water flow over terrain.
Summary/Accomplishments (Outputs/Outcomes):
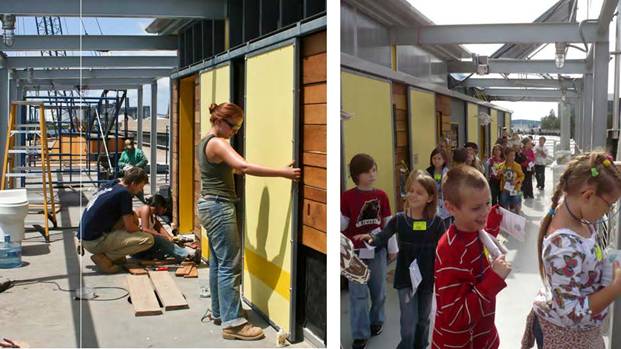
Key Phase II benchmarks were the submission of drawings and specifications for US Coast Guard approval, refinement of final design and calculations, transportation of prefabricated components and final construction on site in Norfolk, physical launch of the Learning Barge and start of educational operations by ERP. Each benchmark was met and the actual accomplishments exceeded the anticipated outcomes specified in the assistance agreement work plan. The greatest challenge was to secure funds to build the entire project and support three years of operations. If the project were to be repeated, the only thing that might be done differently would be to find a partner with a greater ability to raise funds. Nearly all funds were raised by the Faculty Advisor/PI through grant applications, and with her students through prize money. Ultimately we effectively leveraged the EPA P3 funds and reached our goal. We planned to begin final assembly at the Norfolk shipyard in summer 2008, but the start date was delayed until the following summer and the EPA P3 grant was extended by one year.
Photovoltaic & Wind Electrical System: Because the Learning Barge is a vessel (not a building), the entire electrical system is 24V DC power. During the design process ERP decided to use more electrical devices onboard than first calculated, so daily power draw increased and more electric generation capacity was needed. Through comprehensive energy modeling, we determined that an additional 24V, marine grade wind turbine and two 200 watt photovoltaic panels (GEPVp-200w-DC) should be added. Now eight, 200 watt photovoltaic panels and two AirX, 24V, marine grade wind turbine generate approx. 3,600 Watt-hr of electricity per day, which is 20% more than the daily projected load of 2,876 Watt-hr. This provides flexibility to store excess energy in the batteries and avoid over discharge. Six, 12V, 250 Am-hr, deep cycle batteries provide over 3 days of storage capacity for both the solar and wind generators, while allowing for wind faster than 7.5 miles/hour in 24 hours. The system was sized to provide required power, while encouraging Barge visitors to monitor and reduce their energy consumption—thereby developing an awareness of how and where electricity is generated and then consumed.
Solar Hot Water Heating System: The evacuated tube solar hot water heating system warms the classroom in cool months of operation. The system uses fifty evacuated tubes on the roof of the Barge to gather energy from the sun and transfer that energy directly to water contained in insulated water storage tanks below deck. The single 150-gallon water storage tank specified in the schematic phase shifted to two, 400-gallon steel tanks. In order to increase vessel stability, the tanks were designed as an integral part of the hull structure, which produced an interesting hybrid of barge structure and solar heating system.
Water Filtration Systems: Based on usage calculations, we projected gray water quantities would be small enough to be managed through transpiration and evaporation. That has proved to be true and the gray water wetland basins are thriving even during the winter months. The river water filtration basins have become a popular and effective demonstration device, as students measure and record water quality improvements in the river water as it moves through the basins in order to understand the function and effectiveness of native wetland plants that they observe along the river.
Monitoring System: The monitoring system wirelessly collects data from sensor boards such as humidity levels, temperatures, power generated through PV cells and wind turbines, and power consumed per specific time interval. This data is collected and stored on the base station on the flash memory chips built on the boards itself. The base station then connects to a local laptop computer, which acts as a server to extract all the data from the base station and provide it to the Learning Barge interface. This interface displays various data in interactive graphical form to make the system comprehensible to younger students. Several design refinements were developed from the original schematic. For instance, the humidity and temperature board design was modified based on battery sensor boards faults that the engineering team encountered in another research project (ecoMOD3). The new humidity and sensor boards have the same humidity sensor, but integrate an analog temperature sensor LM19 in place of the digital sensor used in eM3 board. This makes reading temperature values into the MSP430 much easier. This temperature sensor is more reliable and accurate than the internal MSP430 temperature sensor that we used for eM3 humidity boards. Another change is the addition of two new voltage regulators. These voltage regulators convert the available 24 V on the barge to 12 V first, and then convert this 12V to 5V for the humidity sensor to use, and 3.3V for the MSP430 to use.
The base station sends all the data to the laptop through its serial port or stores all the collected data and sends in real-time data when connected to a laptop later. The team wrote a Java server code that connects the base station through the serial port and extracts the information. The server can be easily programmed to output this data in any format needed for the Labview interface that displays various visual graphs and charts. See the appendices for board and sensor schematics.
Post-Occupancy Evaluation: The goal of creating a completely energy self-sustaining educational environment was achieved. Now we will analyze impacts of the barge over its life cycle compared to the impacts of a similar classroom. The Barge design adapted readily available sustainable technology so that visitors might easily imagine transferring these small-scale sustainable systems to their own homes or places of work. Barge visitors have expressed great interest in applying these sustainable technologies and we hope to have evidence of home installations soon. While the photovoltaic and wind power generation systems are quantitatively performing as planned, building performance is also determined by user thermal, lighting, spatial and other preferences. Crisman is performing a qualitative post-occupancy evaluation to supplement the numerical data. If necessary, we will make recommendations for ongoing improvements to the systems.
The solar thermal array is highlighted through clerestory ventilating windows in the RiverLab classroom.
Conclusions:
Quantifiable benefits to people, prosperity, and the planet (estimated or actual)
Reduced environmental impact: Two distinct water systems onboard collect and filter water: one freshwater and one brackish. It was estimated that 40 gallons/day of filtered rainwater will be used for hand washing and other non-potable uses. Based on the 276 day operating season, the Barge will cleanse and release 11,040 gallons of freshwater water that has been filtered by native freshwater plants. As part of the educational curriculum, up to 11 gallons/minute of river water can be manually pumped onboard to flow through a series of filtration basins using native saltwater plants. Students test the water at several points along its journey. 325 gallons of river water filter through the basins each week of the 40-week operational period, resulting up to 13,000 gallons of cleansed water returned to the River. Photovoltaic panels and two wind generators supply the 19,350 watt-hours of electricity/year. This power would be acquired from the grid otherwise, which is supplied by a coal burning power plant located nearby. Though the number is small, the conceptual power of this renewable energy demonstration—in sight of the power plant itself, is immense.
Qualitative benefits to people, prosperity, and the planet
Improved quality of life: The Learning Barge directly contributes to improved quality of life through pollution prevention resulting from the renewable energy and water filtration systems onboard, along with the long-term impact of educational programs as they foster environmental stewardship. Pollution prevention is a major public issue in the Norfolk area: the Elizabeth River is at the geographic and political heart of the region. Home to the US Navy’s Atlantic fleet, the world’s largest Naval station and one of the largest commercial harbors in the US, the area is nationally important economically, yet environmentally degraded.7 The toxic benthic levels of the Elizabeth River have had a drastic affect on the food chain and the oyster population that once supplemented the region’s economy has been reduced by 99%.9 In 2005, the River had lower species diversity and biomass, and higher pollution indicative species than the Chesapeake Bay Benthic Restoration Goals.10 As the Barge filters water and provides working space for increased oyster regeneration, researchers on the Barge will constantly monitor the Benthic Index of Biotic Integrity, abundance, and community composition. Researchers analyze how the Barge’s presence improved the B-IBI levels particular branch of the River over several months and compare results with overall Chesapeake Bay Benthic benchmarks. With improved biodiversity pollution-phobic species will begin to repopulate the river; regenerating regional seafood commerce.
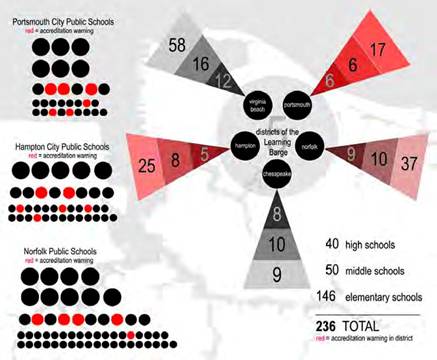
Education: The primary educational benefit is increased K-12 student, teacher and public understanding of Elizabeth River ecology and impact of local watershed cities on this ecosystem. The Barge’s programs will reach over 19,000 people per year, thereby improving their quality of life through knowledge acquisition and connectivity with their home river. Indicators of success will be the number and percent of students attending educational workshops on the Barge, and exhibiting an increased understanding of Elizabeth River ecology. The Virginia Institute of Marine Science will instruct 100 teachers per year, 25 per city each summer, using a popular VIMS curriculum designed for ERP. These teachers will reach approx. 10,000 students. An online data collection system will survey what day to day conservation methods and which sustainable components participants consequently implemented in their own homes due to their experience on the Barge. The impact on science education in the area will be measured by evaluating the science SOL scores of students who participated in the Barge’s program. Science SOL testing occurs in grades 3, 5, and 8 and in high school for Earth Science and Biology, allowing the science progression of Barge students to be tracked for up to nine years after their initial interaction with the Barge.
Transferable impacts: The idea of replicability is appropriate to the Learning Barge as a viable model of integrated sustainable technologies and environmental education. The project adapts existing knowledge and readily available technology to produce in an innovative approach to environmental education so that visitors can easily imagine transferring these small-scale sustainable systems to their own homes or places of work.
Balancing people, prosperity & the planet: The 3 P’s are intertwined in the project. Human health and comfort, and environmental, technical and economic concerns were carefully balanced at each decision point. Design decisions for conventional projects are often made in isolation and environmental impact is not sufficiently considered.
References:
 |
 |
 |
 |
 |
 |
 |
 |
 |
 |
 |
P3 Phase I:
The Learning Barge: Environmental + Cultural Ecologies on the Elizabeth River | Final ReportThe perspectives, information and conclusions conveyed in research project abstracts, progress reports, final reports, journal abstracts and journal publications convey the viewpoints of the principal investigator and may not represent the views and policies of ORD and EPA. Conclusions drawn by the principal investigators have not been reviewed by the Agency.