
Grantee Research Project Results
2007 Progress Report: The Impact of Nutrients, Zooplankton, and Temperature on Growth of, and Toxin Production by, Cyanobacteria Blooms in the Upper Reaches of Chesapeake Bay
EPA Grant Number: R833220Title: The Impact of Nutrients, Zooplankton, and Temperature on Growth of, and Toxin Production by, Cyanobacteria Blooms in the Upper Reaches of Chesapeake Bay
Investigators: Gobler, Christopher , Coyne, Kathryn J. , Dawson, Celia
Institution: The State University of New York at Stony Brook , University of Delaware , Maryland Department of Natural Resources
Current Institution: The State University of New York at Stony Brook , Maryland Department of Natural Resources
EPA Project Officer: Packard, Benjamin H
Project Period: March 28, 2007 through March 27, 2010
Project Period Covered by this Report: March 28, 2007 through March 27,2008
Project Amount: $449,947
RFA: Ecology and Oceanography of Harmful Algal Blooms (2006) RFA Text | Recipients Lists
Research Category: Aquatic Ecosystems , Water
Progress Summary:
PART I. Molecular work
To date, we have made significant strides in our progress toward microcystin synthetase D (mcy D) gene expression. We have perfected our nucleic acid extractions from field samples to result in high-quality RNA with a 260/280 ratio of 1.9-2.0. Several changes made in the past year have eliminated the affects of environmental inhibitors on our PCR methods. From the high-quality RNA, we have successfully used the Invitrogen Superscript III and random hexamer primers to reverse transcribe the transcripts of interest into cDNA. Using quantitative PCR with fluorescently labeled TaqMan probes, we are able to quantify cDNA levels over four orders of magnitude. NoRT controls are consistently negative indicating complete digestion of—and therefore no contamination with—genomic DNA. We have successfully quantified the cDNA from in vitro transcribed RNA, RNA from cultured Microcystis cells and are currently working on quantification from field samples. In the coming year, we expect to apply the technique to field samples collected from the Potomac River sample sites to add quantitative values of mcy D gene expression to our suite of Microcystis field data.
PART II. Laboratory culture experiments
Although it was not part of our original proposal, we have begun to conduct laboratory experiments with toxic strains of Microcystis in order to better interpret results from our field experiments. We have toxic Microcystis strain LE-3 in culture and have begun to conduct experiments manipulating levels of nutrients, temperature, light, carbon dioxide, and zooplankton grazing. In the coming year, we will be assessing the degree to which expression of the microcystin synthetase gene per cell is altered by these various biological, chemical, and physical factors. We believe creating such a comprehensive data set will provide the ideal background information from which to interpret results we obtain during our studies of cyanobacteria blooms in the upper reaches of Chesapeake Bay.
PART III. Stidoes of cyanobacteria blooms in the upper reaches of Chesapeake Bay
Materials and Methods:
Field collection and experimental sites
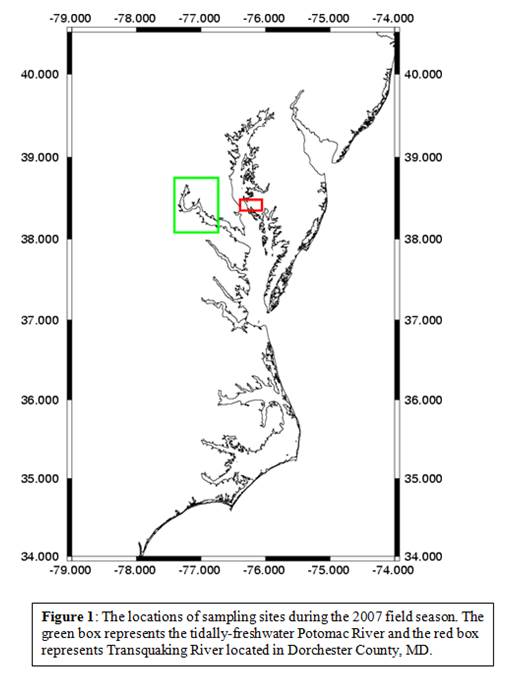
A critical component of understanding the ecology of harmful algal blooms is to conduct sampling which spans spatially and temporally across intense blooms. This approach allows the signature conditions of a bloom event to be clearly observed and contrasted to "non-bloom" conditions. In the tidally freshwater Transquaking River located in Dorchester County, Maryland (Figure 1), which is a tributary to the Chesapeake Bay, field sampling was conducted during and after cyanobacterial bloom events (July-November) on a bi-weekly to monthly basis to understand how various factors impact bloom conditions. Sampling was also conducted on a bi-weekly basis from April through October at four stations in the Potomac River, although cyanobacteria blooms did not occur in this system in 2007.
Water quality sampling
At each site, the general water quality was evaluated. A hand-held CTD was utilized in order to determine surface and dissolved oxygen. 20 L of surface water was collected and taken to the lab where triplicate size-fractionated (whole, > 20 µm) chlorophyll (total phytoplankton) and in vivo phycocyanin (total cyanobacteria) were measured with Turner Designs fluorometers using standard techniques (Parsons et al., 1984; Watras & Baker, 1988; Lee et al, 1994). For toxin analysis, whole water was filtered onto triplicate 47 mm GFF glass fiber filters and placed in 5 mL cryovials, which were stored at -20°C until analysis. Samples were 0.2 µm filtered with capsule filters for dissolved nutrient analysis and unfiltered for total N and P. We also collected duplicate whole water samples, which were preserved with Lugol’s iodine solution (5% final concentration) in order to quantify the phytoplankton assemblage within these bodies of water. For the molecular analysis of cyanobacteria, water was filtered onto triplicate 0.22 and 2 µm polycarbonate filters, immediately placed in CTAB lysis buffer and stored at –80 °C.
Impacts of nutrients on toxic and non-toxic cyanobacteria
Two experimental approaches were used to assess the impact of nutrients on toxic and non-toxic cyanobacteria populations. For the first approach, triplicate, 1 L bottles were filled with surface water from each experimental site and will be amended with nitrogen (20 µM ammonium) or phosphorus (1.25 µM orthophosphate), or will be left unamended as a control. The bottles were incubated at ambient light and temperature conditions for 24-48 hours at the end of which aliquots were filtered for levels of pigments (chlorophyll a, phycocyanin), densities of toxic and non-toxic cyanobacteria, expressed copies of the microcystin synthetase gene per toxic cell, concentrations of cyanotoxins (see below for methodological details), and preserved in 5% Lugol’s iodine solution for cell enumeration.
In hypereutrophic systems there is often an excess of nutrients exceeding the requirements for algal growth; therefore, nutrients addition experiments may not indicate the nutrients limiting algal growth rates (Paerl & Bowles 1987). To estimate which nutrient could be limiting in a hypereutrophic system, we will employ nutrient dilution bioassays to complement nutrient addition experiments and estimate how reductions in nutrient loading may limit growth of various cyanobacterial populations (Paerl & Bowles 1987). Nutrient dilution bioassays dilute out the major nutrients (N,P) to concentrations where cyanobacterial growth will become limited or reduced as opposed to unaltered controls (Paerl & Bowles, 1987).
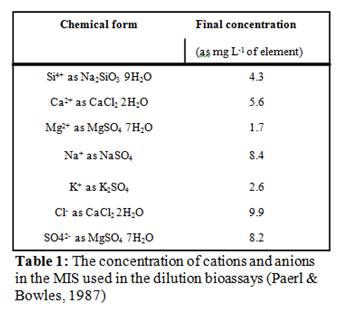
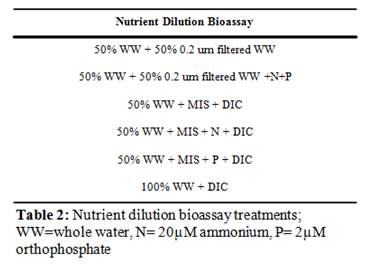
In order to create conditions similar to ambient conditions with respect to all variables other than nutrient concentrations, we diluted whole lake water (WW) with a multiple ion solution (MIS) which contained all the major constituents of lake water (cations and anions) but was free of N or P (Paerl & Bowles, 1987) (Table 1). For this assay, there were six treatments, run in triplicate 250 mL bottles totaling 18 experimental bottles (Table 2). Whole lake water was diluted to 50% concentration using 0.2 µm filtered lake water in order to keep ambient dissolved nutrient concentrations but reduce the number of grazers by half. We then filled triplicate bottles with 50 WW plus nutrients, to determine if ambient concentration of either nutrient was limiting. Third, we filled triplicate bottles with 50% WW + MIS in order to determine the growth rate at half the ambient nutrient concentrations and will act as a control. Finally, we filled two sets of triplicate bottles with 50% WW + MIS and spiked one set with 20µM nitrate and the other set with 2 µM orthophosphate to determine if increased concentration of either nutrient will elicit a growth rate greater then that of the control. Dissolved inorganic carbon (DIC) additions (12 mg L-1), in the form of NaHCO3, were added to all the experimental bottles that were diluted with MIS, as the MIS did not contain DIC and over the incubation period DIC could have become limiting in these bottles (Table 2; Paerl & Bowles, 1987). The bottles were incubated at ambient light and temperature conditions for 24-72 hours, at the end of which aliquots were filtered for levels of pigments (chlorophyll a, phycocyanin), densities of toxic and non-toxic cyanobacteria, expressed copies of the microcystin synthetase gene per toxic cell, concentrations of cyanotoxins (see below for methodological details), and preserved in 5% Lugol’s iodine solution for cell enumeration. The effect of each nutrient on each parameter was analyzed with a one-way ANOVA with each nutrient considered a treatment effect (α = 0.05).
Impacts of increased temperature on toxic and non-toxic cyanobacteria
Parallel sets of nitrogen (20 µM ammonium) and phosphorus (1.25 µM orthophosphate) addition experiments were incubated at elevated and reduced temperatures (+/- 4°C) to assess the role of recent and future climatic warming in bloom occurrence and toxin production. These temperatures approximate levels seen during pre-industrial times in North America (- 4°C; Assel & Robertston, 1995) and levels projected for the coming century (+4°C; Houghton et al, 2001). In preliminary research of coastal marine ecosystems, compactly designed experimental incubators which use ambient circulating water in tandem with heaters and chillers have been perfected to maintain such a temperature regime over extended periods (Figure 1). 1 L bottles were incubated for up to 48 h under ambient light conditions and aliquots were monitored for changes in levels of pigments (chlorophyll a, phycocyanin), densities of toxic and non-toxic Microcystis, expressed copies of the microcystin synthetase gene per toxic cell, concentrations of cyanotoxins (see below for methodological details), and preserved in 5% Lugol’s iodine solution for cell enumeration. The effect of each nutrient and temperature on each parameter will be analyzed with a three-way ANOVA with nitrogen, phosphorus, and temperature as the main effects (α = 0.05). Post hoc comparisons of significant impacts will be elucidated with a Sheffe’s comparison (Day & Quinn, 1989).
The impact of zooplankton grazing on toxic cyanobacteria bloom dynamics
We evaluated the potential role of zooplankton grazing in cyanobacteria bloom occurrence using multiple methods. One approach involved experimentally manipulating macrozooplankton concentrations and evaluating changes in cyanobacteria densities over time (Carrick et al, 1991). We have recently found that Daphnia pulex, which we culture in our laboratory, is quite sensitive to actively toxic cyanobacteria (Gobler et al, 2007). For this method, cultured cladoceran Daphnia pulex and amphipod Hyalella azteca were added at environmentally realistic densities (100 L-1 and 12 L-1; George & Edwards 1974; Threlkeld 1979; Sellner et al 1993). In addition, to ensure that the zooplankton are capable of actively grazing and to determine a control grazing rate on an ideal food source, 13 experimental bottles were filled with 0.2 µm lake water and add a concentration of Selenestrum sp., a nutritious green algae, to achieve the same in vivo fluorescence as the unfiltered lake water. One bottle was immediately filtered for initial chlorophyll a, and of the 12 remaining bottles, three were left unammended to serve as controls, three had D. pulex added, and three had H. azteca. A parallel set of bottles were filled with whole lake water and had the same treatments (control and D. pulex addition, or H. azteca addition). To minimize the effects of nutrient recycling via zooplankton excretion, saturating nutrients (N, P) were added to all experimental bottles. Bottles were incubated for 48 h at ambient light and temperature in an in situ incubator. We collected initial and final samples from each incubation bottle to assess the degree to which enhanced zooplankton concentrations alter densities of toxic and non-toxic Microcystis, expressed copies of microcystin synthetase gene per toxic cell, and pigment levels (chlorophyll a, phycocyanin). Chlorophyll-specific net growth rates among treatments (Selenestrum control, Selenestrum with D. pulex addition, Selenestrum with natural zooplankton enrichment, whole lake water, and whole lake water with D. pulex addition, whole lake water with H. azteca enrichment) were determined. Significantly lower chlorophyll-specific growth rates in the whole lake water with D. pulex addition or natural zooplankton enrichment than the whole lake water will confirm that the zooplankton were healthy and capable of grazing on the ambient algal population.
Currently, the ability of microzooplankton to directly or indirectly alter concentrations of toxic cyanobacteria is unknown, although our preliminary results suggests this functional group of herbivores continues to graze during highly toxic events (Gobler et al, 2007). To estimate microzooplankton grazing, the dilution technique was utilized (Landry et al, 1995). We used filtered sample water to create a dilution series consisting of four dilutions (100%, 75%, 50%, 25% whole water WW; n = 3 for each) in acid-washed, 250 mL polycarbonate bottles, all with complete nutrient enrichment (N,P; Landry et al, 1995). A bottle of 100% filtrate and a triplicate set of unenriched WW will also be included in the experimental series to ensure filtration removes all particles and to understand the effects of nutrients (Landry et al, 1995). Experimental manipulations were incubated in situ for 24-48 h under ambient light conditions and water temperature. After the incubation period had expired, experimental flasks were filtered for levels of pigments (chlorophyll a, phycocyanin), densities of toxic and non-toxic cyanobacteria, expressed copies of the microcystin synthetase gene per toxic cell, concentrations of cyanotoxins (see below for methodological details), and preserved in 5% Lugol’s iodine solution for cell and microzooplankton grazer enumeration. Quantifying densities of toxic and non-toxic Microcystis during these experiments should determine the ability of protozoa grazers to consume each sub-population. Net growth rates of each population will be calculated from changes in cell densities and pigment using the formula: µ = [ln(Bt / Bo)] / t / % WW where µ is the net growth rate, Bt is the amount of biomass (cell density or pigment) present at the end of the experiments, Bo represents the amount of biomass at the beginning of experiments, t is the duration of the experiment in days and % WW is the percent of whole water used. Grazing mortality rates (m) of populations will be determined using the slope of a linear regression of the dilution of sample water (x-axis) versus apparent net growth rates (y-axis), while nutrient enriched growth rates (µn) will be determined from the y-intercept of these plots (Landry et al, 1995).
Results:
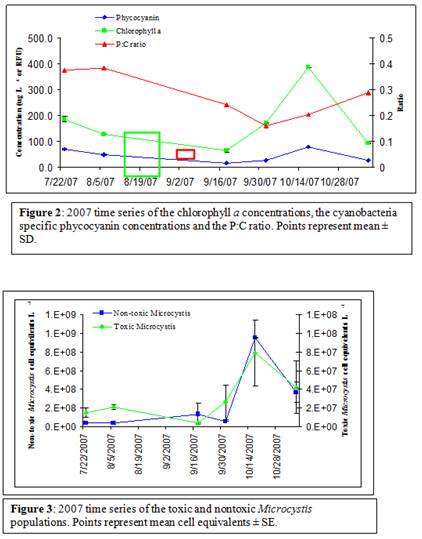
During the 2007 sampling period (July-November), water temperatures ranged from 8.2 to 26.7˚C. The highest temperature was recorded on August 6. Chlorophyll a concentrations ranged from 64.5 to 384.9 µg L-1 (Figure 2). Chlorophyll a concentration averaged 171.1 ± 46.8 µg L-1, and the peaked on October 17 at 385.9 ± 1.30 µg L-1 (Figure 2). Cyanobacteria were present on each sampling date and phycocyanin concentrations ranged from 15.6 to 70.0 relative fluorescence units (RFU). On average the phycocyanin concentration was 44.5 ± 10.4 RFU and the maximum was reached on October 17, 2007 (Figure 2). However, even though cyanobacteria were at the highest concentrations on this date, the phycocyanin:chlorophyll ratio indicated that cyanobacteria were more dominant among the total phytoplankton community on previous sampling dates (Figure 2). During the summer of 2007, cyanobacteria reached their peak dominance (0.37; Figure 1) on August 6, and averaged (0.27 ± 0.03) throughout the sampling period. Both toxic and non-toxic populations of Microcysits were present on all sampling dates (Figure 3). Toxic Mirocystis cells (those containing the mcyD, microcystin synthetase gene as detected via qPCR) peaked at 7.87 ± 3.51x10⁷ cell equivalents L-1 on October 17 and averaged 3.11x10⁷ cell equivalents L-1 over the entire sampling period. Throughout the sampling period, toxic Microcystis comprised 2.7-35.6 % of the total Microcystis population and reached maximum dominance on August 6, coinciding with the maximum cyanobacterial dominance of the overall phytoplankton community.
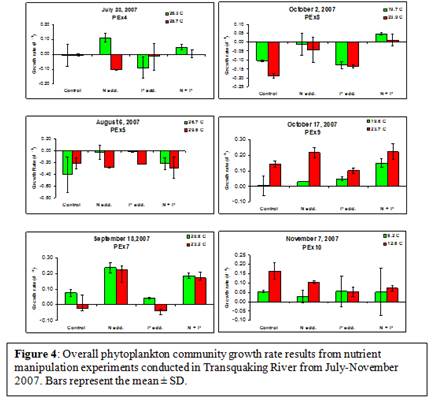
Nutrient manipulation experiments did not yield any significant increases in algal growth rates (based on chlorophyll a) during the experiments conducted in late July and early August (3-way ANOVA; Figure 4). However, during the fall months (September and October), the total phytoplankton community became nitrogen limited, as increases in ammonium concentrations yielded increased growth rates (experiments PEx7,8,9; p < 0.005; 3-way ANOVA; Figure 4). When considering the cyanobacteria population only, in 83% (5 of 6) of experiments conducted, increased nitrogen concentrations yielded significantly increased cyanobacterial growth rates (PEx4-9, p< 0.002; 3-way ANOVA; Figure 5), suggesting that cyanobacteria were experiencing nitrogen limitation from late July through October (Figure 5). Furthermore, the experiments conducted in July and early August indicated that cyanobacteria were also undergoing P-limitation to a certain extent (PEx5&6; p<0.02; 3-way ANOVA; Figure 5), however, only PEx4 yielded a significant interaction between N and P on the growth rate of the total cyanobacterial community (PEx4; p=0.003, 3-way ANOVA; Figure 5).
In 83% of the experiments conducted during the summer of 2007, increased temperatures did not significantly increase algal growth rates (based on chlorophyll a; PEx4,5,7,8,10; 3-way ANOVA; Figure 4). One experiment, PEx9, yielded significantly increased algal growth rates with an increase in temperature (p < 0.001; Figure 4). Also, there were no significant interactions between temperature and nitrogen or phosphorus on algal growth rates in any experiment conducted. However, an increase in temperature yielded a significantly increased growth rate in cyanobacteria in 67% (4 of 6) of experiments conducted (PEx4,5,7,9; p<0.001; 3-way ANOVA; Figure 5). Also, there were significant interactions between temperature and both nitrogen and phosphorus throughout the summer of 2007. Increased temperature and nitrogen yielded increased cyanobacterial growth rates in 67% (2 of 3) of the experiments conducted from August and September (PEx5&7; p< 0.03; 3-way ANOVA; Figure 5). In 67% (4 of 6) of all experiments conducted during 2007, there was a significant interaction between temperature and phosphorus concentrations (PEx4,5,7,9; p< 0.04; 3-way ANOVA; Figure 5). There was also a significant interaction between temperature, phosphorus, and nitrogen on cyanobacterial growth rates in 50% (3 of 6) of the experiments conducted (PEx7,9,10; p<0.04; 3-way ANOVA; Figure 5).
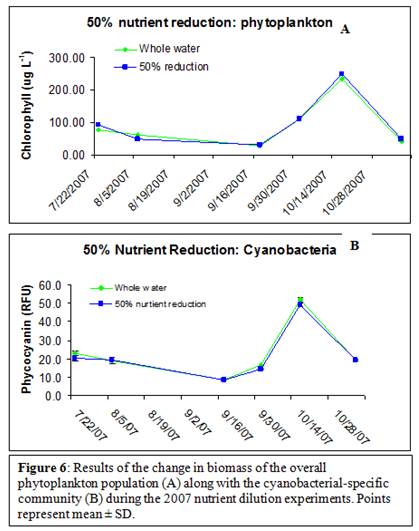
Also, a reduction of the ambient nutrient concentration by 50% did not decrease biomass for either the total phytoplankton community or the cyanobacterial-specific community (Figure 6 A & B).
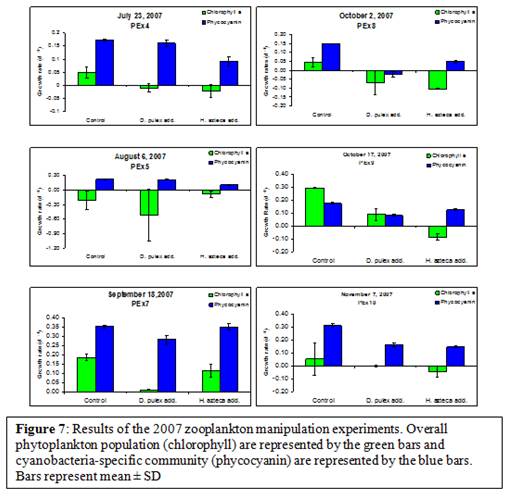
The additions of both mesozooplankton D. pulex and H. azteca to Transquaking River water yielded significantly lower net growth rates relative to control treatments on the overall phytoplankton community on two dates during the 2007 sampling season, September 18 and October 17 (p <0.02; t-test; Figure 7). However, enrichment with D. pulex yielded significantly lower net growth rates of cyanobacteria in 100% of the experiments conducted from September to November (PEx7,8,9,10; p<0.03; t-test; Figure 7). As well as H. azteca additions yielded significantly lower net cyanobacteria growth rates in 83% (5 of 6) of experiments conducted during the entire sampling period of 2007 (PEx4,5,8,9,10; p<0.006; t-test; Figure 7).
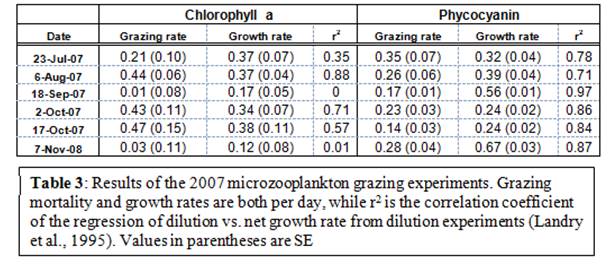
Microzooplankton were able to graze on the total phytoplankton community during 67% of all experiments conducted (PEx4,5,8,9; Table 3). Grazing rates were lower during the end of July (0.21 ± 0.10 per day) but increased in August and remained consistent throughout the experiments where grazing occurred (average = 0.45 ± 0.02 per day; Table 3). However, microzooplankton grazing was found to occur on cyanobacteria in 100% of the experiments conducted during the summer of 2007 (Table 3). In contrast to the grazing rates on the entire phytoplankton community, grazing rates on cyanobacteria were similar and lower during all experimental dates (average = 0.24 ± 0.08, Table 3). Also, intrinsic growth rates of the cyanobacteria community outpaced their grazing rates (0.40 ± 0.07 per day), while the growth rate of the entire phytoplankton community was slightly lower than its grazing rate (0.29 ± 0.05 per day; Table 3).
Discussion:
Transquaking River experienced large and intense cyanobacteria blooms throughout the summer and fall of 2007. Both toxic and non-toxic populations of Microcysits were present on all sampling dates with toxic Mirocystis cells peaked at 7.87 ± 3.51x10⁷ cell equivalents L-1 and comprising 1 - 40 % of the total Microcystis population. As such, our future analysis of the toxic and non-toxic strains of this cyanobacterium during these blooms will squarely meet main objective of this project.
Nutrient manipulation experiments indicated that the overall phytoplankton community was not P-limited throughout the entire sampling period (Figure 4). However, the phytoplankton community did become N-limited during the fall months as increases in nitrogen yielded increased algal growth rates (Figure 4). On the other hand, nutrient manipulation experiments indicated that the cyanobacteria-specific community was P-limited during the late summer (July and August) and N-limited during the fall (September & October; Figure 5). This decoupling of the responses to increased nutrient concentrations of the overall phytoplankton community and the cyanobacterial specific community could be explained by the possibility that the cyanobacterial community comprised a small portion of the overall phytoplankton community during these early experiments. We know from the phycocyanin:chlorophyll ratio that the cyanobacterial community peaked in dominance in early August (Figure 2); therefore, the response seen by the overall community might not parallel the cyanobacterial community as it would in systems where cyanobacteria comprise a greater portion of the overall community. Also, it is well known that cyanobacteria are able to outcompete other phytoplankton at elevated nutrient concentrations (Fogg, 1969; Renoylds & Walsby, 1975; Renolds, 1987; Paerl, 1988b; Paerl, 1997; Chorus & Bartram 1999). Therefore, if the cyanobacterial growth rate was being hindered by a lack of N, a shift toward N-replete conditions could yield higher growth rates in cyanobacteria and potentially a shift in dominance towards cyanobacteria within this system.
Increased temperature did not elicit an increased growth response in the overall phytoplankton community on any date except October 17 (Figure 4). This indicates that the phytoplankton community growth rate was not being limited by water temperature. Furthermore, there were no significant interactions between temperature and either N or P (Figure 4), indicating that it was not a lack of nutrients that was hindering the phytoplankton growth rate at the elevated temperatures. However, cyanobacterial growth rates were elevated with increased temperature in 4 of the 6 experiments. It has been well established that cyanobacteria yield maximal growth rates around 25˚C (Robarts & Zohary, 1987). Increased temperatures in all experiments where temperature was a significant treatment effect fell between 23 and 30˚C (Figure 5), which is within the range for maximal growth rates. Furthermore, significant interactions between temperature and N and P indicated that the growth rates of cyanobacteria could be further elevated if this system contained higher nutrient concentrations (Figure 5). This could lead to the preliminary suggestion that if water temperature alone could lead to a shift in cyanobacterial dominance and if nutrient concentrations increase within Tranquaking River, there could be a further shift towards a phytoplankton community comprised primarily of cyanobacteria.
Neither phytoplankton concentration nor cyanobacterial concentrations were decreased by a 50% reduction in nutrient concentration (Figure 6). This could be because during most experiments, one nutrient was limiting for both the overall and cyanobacteria-specific communities (Figures 4 & 5). If the communities were limited by either N or P, one might not expect to see a further decrease in concentration if the non-limiting nutrient concentration was decreased; however, this could be largely dependent on the nutrient concentrations (data analysis currently ongoing).
The interaction between zooplankton and cyanobacteria is a crucial aspect to understanding and effectively managing harmful cyanobacterial blooms. It has been established that many species of cyanobacteria are not readily grazed by mesozooplankton (Lampert, 1987; Paerl, 1988; de Bernardi & Giussani, 1990; Sellner et al, 1993, Boon et al, 1994; Christoffersen, 1996; Paerl et al, 2001). However, the mechanism by which grazing is disrupted is unknown. During the summer of 2007, our experiments showed that neither D. pulex nor H. azteca were able to graze on the overall phytoplankton community on 4 of the 6 experiments (Figure 7). Cell counts need to be completed before any conclusion can be drawn as to why these species were unable to graze the overall phytoplankton community. However, our data show that both zooplankton species were able to graze readily on cyanobacteria for a majority of the experiments conducted (Figure 7). Again to more fully understand the interaction between these mesozooplankton grazers and cyanobacteria, toxin analysis, molecular analysis as well as species abundance and diversity within the cyanobacterial community need to be completed. However, based on preliminary data on species diversity and abundance (data not shown) we know that the cyanobacteria community was comprised of many species of cyanobacteria; therefore, we cannot state at this time that this grazing was occurring on any specific species as opposed to others. In order to determine the interaction of these grazers on the toxic and non-toxic populations of Microcystis and potentially other harmful species of cyanobacteria molecular analysis of the data needs to occur.
Microzooplankton are known to be the primary source of mortality for phytoplankton in aquatic ecosystems (Calbet & Landry, 2004), and microzooplankton densities have been shown to be well-correlated with densities of toxic cyanobacteria in the Potomac River of Chesapeake Bay (Lacouture et al, 1993). Therefore, microzooplankton may act as an important trophic link between mesozooplankton and toxic cyanobacteria blooms as it has been suggested that microzooplankton may graze on toxic cyanobacteria (Dryden & Wright, 1987; Paerl et al, 2001). Our preliminary results support this idea as the microzooplankton community was able to graze on the overall phytoplankton community in 4 of the 6 experiments and 6 of the 6 experiments for cyanobacteria (Table 3). However, it is notable that there was a significant difference between cyanobacteria growth and grazing rates during experiments, while the total phytoplankton community experience tighter grazing control (Table 3). As such, it is possible that a lack of adequate grazing pressure facilitated the occurrence of cyanobacteria blooms in this system. We cannot at this point interpret the data any further as molecular analysis; species diversity and abundance, as well as microcystin concentration analysis needs to occur in order to elucidate the data further.

Future Activities:
New Directions for 2008
Finally, for the 2008 field sampling season we are expanding on our experimental design from 2007 in order to further understand the dynamics of the cyanobacterial blooms in this region. For the summer of 2008, we are striving to conduct experiments examining the impact of nitrogen speciation (20 µM NO3-, NO2-, NH4+, urea, and glutamic acid) and enhanced CO2 levels on toxic and non-toxic cyanobacteria. Enhanced CO2 levels will be achieved by bubbling air with ambient (370 ppm) and elevated (750 ppm) concentrations of CO2 and the interactions with increased temperature and nutrients. We will also conduct mesozooplankton grazer manipulation experiments with copepods collected from the field as well as increases in the natural mesozooplankton community. We will continue to analyze the 2007 to further elucidate the trends found in the preliminary results. This will be extremely informative as this study is focused not only on the overall cyanobacterial community but also more specifically the toxic and non-toxic subpopulations of Microcystis, which can comprise a very small percent of the overall cyanobacterial community (unpublished data) and might not follow the same trends seen in the preliminary results. Therefore, in order to gain a better understanding of these specific populations, especially the toxic population and the toxin they can produce, quantitative molecular analysis will be ongoing.
References:
Assel, R.A., Robertson, D.M., 1995. Changes in winter air temperatures near Lake Michigan, 1851-1993, as determined by regional lake-ice records. Limnol. Oceanogr 40(1) 165-176.
Boon, P.I., Bunn, S.E., Green, J.D., Shiel, R.J., 1994. Consumption ofcyanobacteria by fresh-water zooplankton—implications for the success of top-down control of cyanobacterial blooms in Australia. Aust. J. Mar. Fresh Res. 45, 875–887.
Calbet, A., Landry, M.R., 2004. Phytoplankton growth, microzooplankton grazing, and carbon cycling in marine systems Limnol Oceanogr 49: 51-57
Carrick,H J., Fahnenstiel,G.L., Stoermer, E.F., and Wetzel, R.G., 1991. The importance of zooplankton-protozoan trophic couplings in Lake Michigan. Limnol Oceanogr., 36, 1335-1345.
Chorus, I. & Bartram, J. 1999. Toxic cyanobacteria in water: a guide to their public health consequences, monitoring and management. World Health Organization. E&FN Spon, Routledge, London.
Christoffersen, K., 1996. Effect of microcystin on growth of single species and on mixed natural populations of heterotrophic nanoflagellates. Nat. Toxins 4, 215–220.
Day, R.W., Quinn, G.P., Comparaisons of treatments after an analysis of variance in ecology. Ecological Monographs 59(4) 433-463.
de Bernardi, R., Giussani, G., 1990. Are blue green algae a suitablefood for zooplankton? A review. Hydrobiologia 200/201, 29–41.
Dryden, R.C., Wright, S.J.L., 1987. Predation of cyanobacteria by Protozoa. Can. J. Microbiol. 33, 471–482
Fogg, G. E., 1969. The physiology of an algal nuisance. Proc. Roy. Soc. Lond. [Biol.], 173: 175-189.
George, D. G., Edwards, R. W., 1974. Population dynamics and production of Daphnia hyaline in a eutrophic reservoir. Freshwater Biol. 4: 445-465.
Gobler, C. J., Davis, T. W., Coyne, K. J., and Boyer, G. L., 2007. The interactive influences of nutrient loading and zooplankton grazing on the growth and toxicity of cyanobacteria blooms in a eutrophic lake. Harmful Algae 6:119-133.
Houghton, J. T., Ding, Y., Griggs, D. J., Noguer, M., Van der Lin-den, P. J., Dai, X., Maskell, K. & Johnson, C. A. 2001. Climate Change 2001: The Scientific Basis. Cambridge University Press, Cambridge, 881 pp.
Lacouture, R. V., Sniezek, J. H., Sellner, K. G,. 1993. Level I Report: Maryland Chesapeake Bay Water Quality Monitoring Program-Phytoplankton and Microzooplankton Component. Academy of Natural Sciences, Philadelphia, Benedict Estuarine Research Laboratory, Benedict, Maryland.
Lampert, W., 1987. Laboratory studies on zooplankton-cyanobacteria interactions. N. Z. J. Mar. Freshw. Res. 21: 483–490.
Landry, M.R., Kirshtein, J., Constantinou, J., 1995. A refined dilutiontechnique for measuring the community grazing impact of microzooplankton, with experimental test in the central equatorial Pacific. Mar. Ecol. Prog. Ser. 120, 53–63.
Lee, T., Tsuzuki, M., Takeuchi, T., Yokoyama, K., Karube, I., 1994. In vivo Fluorometric Method for Early Detection of Cyanobacterial Waterblooms. Journal of App. Phycology. 6: 489-495.
Paerl, H.W., Bowles, D.N., 1987. Dilution bioassays: Their application to assessments of nutrient limitation in hypereutrophic waters. Hydrobiologia 146, 265-273.
Paerl, H. W. 1988a. Nuisance phytoplankton blooms in coastal, estuarine, and inland waters. Limnol. Oceanogr. 33: 823-847.
Paerl, H. W., 1988b. Growth and reproductive strategies of freshwater blue-green algae (cyanobacteria), In: Growth and Reproductive Strategies of Freshwater Phytoplankton. C. D. Sandgren, ed. Cambridge University Press, Cambridge, pp. 261-315.
Paerl, H.W., 1997.Coastal eurtophication and harmful algal blooms: Importance of atmospheric deposition and groundwater as “new” nitrogen and other nutrient sources. Limnol. Oceanogr. 42(5, part 2), 1154-1165.
Paerl, H. W., Fulton, R.S., Moisander, P.H., and Dyble, J. 2001. Harmful freshwater algal blooms with an emphasis on cyanobacteria. The Scientific World 1: 76-113
Parsons, T.R., Maita, Y., Lalli, C.M., 1984. A Manuel of Chemical and biological Methods for Seawater Analysis. Pergomon Press, Oxford.
Renyolds, C.S., Walsby, A.E., 1975. Waterblooms. Biol. Rev. 50, 437-481.
Reynolds, C.S., 1987. The response of phytoplankton communities to changing lake environments. Aquat. Sci. 49(2), 220-236.
Sellner, K.G., Brownlee, D.C., Buundy, M.H., Brownlkee, S.G., and Braun, K.R. 1993. Zooplankton grazing in a Potomac River cyanobacteria bloom. Estuaries 16: 859-872.
Threlkeld, T., 1979. The midsummer dynamics of two Daphnia species in Wintergreen Lake, Michigan. Ecology 60: 165-1 79.
Watras, C.J. and A.L. Baker. 1988. Detection of Planktonic Cyanobacteria by Tandem in vivo Fluorometry. Hydrobiologia. 169: 77-84.
Journal Articles:
No journal articles submitted with this report: View all 1 publications for this projectSupplemental Keywords:
Zooplankton, cyanobacteria blooms, Chesapeake Bay, Microcystis , RFA, Scientific Discipline, Ecosystem Protection/Environmental Exposure & Risk, Water, algal blooms, Oceanography, Ecology and Ecosystems, Environmental Monitoring, water quality, HAB ecology, bloom dynamics, cyanobacteria, algal bloom detectionProgress and Final Reports:
Original AbstractThe perspectives, information and conclusions conveyed in research project abstracts, progress reports, final reports, journal abstracts and journal publications convey the viewpoints of the principal investigator and may not represent the views and policies of ORD and EPA. Conclusions drawn by the principal investigators have not been reviewed by the Agency.