
Grantee Research Project Results
Final Report: Land Use Land Cover Change Governing Watershed Nitrogen Threshold And Stream Water Quality
EPA Grant Number: R832449Title: Land Use Land Cover Change Governing Watershed Nitrogen Threshold And Stream Water Quality
Investigators: McGlynn, Brian , Patten, Duncan T. , Shanley, James , Gardner, Kristin , Schmitz, Denine
Institution: Montana State University
EPA Project Officer: Packard, Benjamin H
Project Period: September 1, 2005 through August 31, 2007 (Extended to August 31, 2009)
Project Amount: $293,397
RFA: Exploratory Research: Understanding Ecological Thresholds In Aquatic Systems Through Retrospective Analysis (2004) RFA Text | Recipients Lists
Research Category: Aquatic Ecosystems , Water
Objective:
This research examined the impact of N loading on thresholds of watershed N retention. The crossing of watershed N retention thresholds were exhibited as altered patterns in the magnitude and speciation of streamwater N export. Studies across the U.S. and northern Europe have indicated that long term, equally distributed inputs (e.g. atmospheric deposition) of anthropogenic N can surpass ecosystems thresholds to retain N. These ecosystems have become “N saturated” [Aber et al., 1989; Murdoch and Stoddard, 1992; Lovett et al., 2000; Magill et al., 2000; Baron et al., 2000; Burns, 2003]. According to Aber et al. [1989], a sequence of four recognizable stages emerges in response to long-term loading and leads to seasonal patterns of streamwater NO3- concentrations. Stage characteristics range from Stage 0, in which there is a slight seasonal pattern in streamwater NO3- to Stage 3, in which chronic year-long elevated NO3- concentrations persist with no recognizable seasonal pattern. Our research suggests that localized N loading can exhibit similar watershed outlet solute characteristics to spatially distributed N loading.
Summary/Accomplishments (Outputs/Outcomes):
The West Fork of the Gallatin River in the northern Rocky Mountains of southwestern Montana (Figure 1a) drains Big Sky, Moonlight Basin, Yellowstone Club, and Spanish Peaks resort areas (Figure 1b). The West Fork watershed (212 km2) is characterized by well-defined steep topography and shallow soils. Sixty percent of precipitation falls during the winter and spring months [USDA NRCS, 2008]. Hydrographs of the West Fork River indicate peak flows during spring snowmelt typically occurring in late May/early June followed by a general recession throughout the summer, autumn, and winter months. Streams in the West Fork watershed range from first-order, high-gradient, boulder dominated mountain streams in the upper elevations to fourth-order, alluvial streams near the watershed outlet. Stream productivity is generally low due to cold temperatures and short growing seasons (mid June through mid September), however in recent years, increased algal growth has been noted in streams draining developed subwatersheds near the watershed outlet. Diverse geologic materials are present in the West Fork watershed, including metamorphosed volcanics of Archean age, sedimentary and meta-sedimentary formations of various ages, and colluvium and glacial deposits that dominate the surficial geology in valley bottoms. Vegetation below tree line consists of coniferous forest (Lodgepole pine, Blue and Engelmann spruce, and Douglas fir), grasslands, shrublands, and willow and aspen groves in the riparian areas.
The Big Sky Water and Sewer District services the two village areas with public water supply and sewer in the West Fork watershed (Figure 1b). Public wastewater receives secondary treatment and is released into three sewer detention ponds and stored until late spring when it is released as irrigation water onto the Big Sky Golf Course (Figure 1c). Golf course irrigation begins in mid spring when the ground thaws and continues through mid fall, when the ground again freezes. Areas outside of the sewer district are on individual or community septic systems and private wells [R. Edwards, personal comm., 2007].
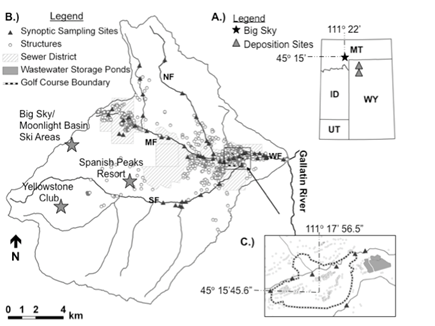
Figure 1: (A) Location of the West Fork watershed (212 km2) in southwestern Montana, with locations of the atmospheric deposition data sites. (B) Map of the West Fork watershed showing locations of 50 synoptic sampling sites, 6 weekly sampling sites, building structures, and the Big Sky Water and Sewer District boundaries. The West Fork (WF) drains into the Gallatin River (a tributary of the Upper Missouri River) and is comprised of three main tributaries: the Middle Fork (MF), the North Fork (NF), and the South Fork (SF). (C) An expanded view of the wastewater storage ponds and the Big Sky Resort Golf Course. Wastewater effluent is stored in the ponds and irrigated onto the golf course from mid-May through early October.
Data Collection
For this study, we collected the following sources of contemporary field data from the West Fork watershed to examine the effects of anthropogenic N loading on watershed N thresholds: 1) synoptic and temporal sampling for N species, 2) isotopic ratios of NO3-, 2) terrain analysis of high resolution topography data (Airborne Laser Swath Mapping), 3) land use/ land cover (LULC) delineation from high resolution imagery (QuickBird) and ALSM data, 4) instream N uptake experiments, and 5) geologic weathering experiments.
Spatial and temporal streamwater sampling was conducted between September 2005 and August 2007. The spatial distribution of watershed N export was explored through synoptic, or “snapshot-in-time,” sampling in which streamwater was collected from 50 sites across the West Fork watershed (Figure 1b) 2-3 hours time. Water samples collected for this study were analyzed for all major N species and a subset of the analyzed for d15N and d18O of NO3-. Six repeated synoptic sampling campaigns were conducted between September 2005 and August 2007, to represent a range of hydrological conditions and potential biological activity. In addition, weekly samples were collected at 7 sites. Sampling sites were randomly selected to represent a range of subwatershed characteristics including: LULC, number of wastewater disposal units, geology, stream order, elevation, and discharge (Figure 1b).
Instream N uptake experiments were conducted in six stream reaches representing a range of watershed and land use characteristics. Two tracer addition methods were followed: constant-rate tracer additions using modified methods from Webster and Valett (2006) and instantaneous tracer additions using the newly developed TASCC method (Tracer Additions for Spiraling Curve Characterization) accomplished as part of this project and related research by the MSU Watershed Hydrology Laboratory [Covino et al. in review A, B]. N, chloride, and specific conductance data collected during the tracer addition experiments determined nitrate-N retention, Michaelis-Menten kinetics and spiraling parameters for each stream reach.
Geochemical solute production by various rocks located throughout the West Fork watershed was assessed in laboratory experiments in order to quantify mineral weathering source of N. A geochemical weathering experiment was performed on 8 different mechanically-crushed rocks reacted with ultrapure water over a period of 30 days. Time interval samples were collected and analyzed for N. Isotopic d15N compositions of rock-water extracts were also compared to stream waters throughout the watershed during baseflow [Ackerman et al., in prep]
Terrain and imagery analysis was used to extract relevant watershed characteristics to use as potential predictor variables for modeling streamwater N concentrations. The MD∞ flow accumulation algorithm [Seibert and McGlynn, 2007] was used to define the hydrological flowpaths in the West Fork watershed using a 10m DEM developed by parsing a 1m resolution Airborne Laser Swath Mapping data set. Terrain analysis extracted the following relevant terrain characteristics from the 10m DEM: 1) hydrological flowpaths and travel times [McGuire et al., 2005], and 2) riparian buffering potential [McGlynn and Seibert, 2003]. Land use/land cover was delineated from QuickBird imagery with ALSM bare ground and surface model data in an object-oriented approach [Campos, in review]. Land use classes included: forest, impervious surface, grass, golf, soil, and sewerpond. Septic locations were mapped by masking the Big Sky Water and Sewer District boundary GIS layer over a 2006 structure layer supplied by the Gallatin County Planning District. Geologic maps, acquired from the Montana Bureau of Mines and Geology [Kellog and Williams, 2005] were used to determine the percent of geology with greater potential for N weathering in each subwatershed [Ackerman et al., in preparation].
Data Analysis
Spatial and seasonal influences of LULC impacts on streamwater N were determined by utilizing the following methods: 1) exploratory spatial analysis of streamwater N, 2) empirical data analysis of streamwater N and data from instream N uptake and geochemical weathering experiments, and 3) N export coefficient model applying Bayesian markov chain monte carlo methods [Gardner et al., 2009]
Exploratory spatial analysis of land use/ land cover influences on spatial streamwater NO3- concentrations was performed through spatial linear models following the methods of Ver Hoef et al. [2006] and Peterson et al. [2007].
N export was approximated for NO3-, DON, and TDN over 2006-2007 by multiplying weekly measured streamwater chemistry by measured discharge or area-weighted discharge on days when stage height or discharge was not measured. Annual N export, reported as kg Nha-1yr-1, was determined by summing daily flux, which was linearly interpolated between weekly flux calculations. Annual and seasonal N retention was calculated by subtracting N export from N loading [Gardner et al., in prep A].
Data from N uptake experiments was used to calculate N retention was calculated using the methods similar to Ruggiero et al. (2006) and Tank et al. (2008) and detailed in Covino et al. [JGR, in review B]. A Michaelis-Menten hyperbolic relationship was used to determine maximum areal uptake rate (Umax) and a half-saturation constant (Km) for each stream reach, detailed methods can be obtained in Earl [2006], Newbold [2006] or Covino et al[(L&O, in review A]. Other nitrate-N spiraling parameters for each stream reach were calculated using our newly developed TASCC method by Covino et al. [L&O, in review A]; JGR, in review B]
The relationship between LULC, watershed characteristics, and N export was determined by an N export coefficient model adapted from mechanistic and spatial modeling approaches used by [Worrall and Burt, 2001] and [Endreny and Wood, 2003]. The model incorporated all data collected from the West Fork watershed including: streamwater N, instream uptake and mineral weathering experiments, and terrain and land use analysis [Gardner et al., in prep B].
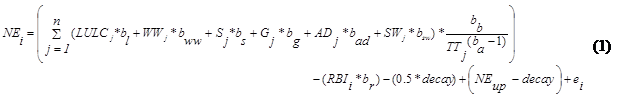
In the model, N export to the downstream end of stream reach i (NEi – kg/day) is a function of: 1) lateral N loading from the incremental drainage i decayed N along terrestrial flowpaths and half of stream reach i, and 2) N loading from one or more adjacent upstream reaches decayed along the length of stream reach i (Nup). (Eqn. 1, Figure 2):
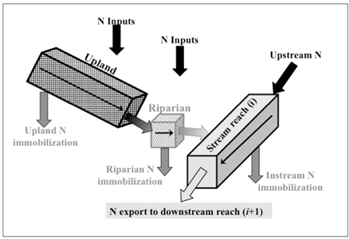
Figure 2: Conceptual model of processes controlling N loading and retention West Fork watershed. Stream reach N is as function of upstream N inputs and lateral loading from the reach contributing area. N can be immobilized instream and in the upland and riparian areas as it travels along hydrological flowpaths to the stream.
Upland lateral loading consists of LULC, land use/land cover, WW, wastewater application, S, the number of septic systems, G, the existence of high N weathering materials, AD, atmospheric deposition, and SW, sewerpond, in each grid cell j. The load from each pixel exhibits a power law decay as it travels along hydrological flowpaths to the stream as a function of 1) TTj, the TT index for each grid cell j, and 2) RBIi, a riparian buffer index ratio for each subwatershed i. ba and bb are calibrated parameters of the power law function associated with TTj. blu, bw, bs, bg, bad, bsw and br are calibrated nitrogen export coefficients associated with LULC, W, S, G, AD, SW, and RBI, respectively.
In addition to upland loading, NEi is a function of N export from one or more upstream reach(es) (NEup). NEup and the decayed upland lateral loading are subject to instream N loss, decay. decay (areal uptake-kg/d/m2) was inferred from instream N experiments conducted in the West Fork watershed during the study period [McNamara, unpublished data, 2006-2008; McNamara et al., in prep]. N export was computed for each of the 231 stream reaches and compared to the observed N export at 50 stream reaches. The total watershed export for the West Fork watershed is the NE calculated for the most downstream reach in the watershed and represents the integrated watershed response.
N export model parameters were estimated Bayesian Markov chain Monte Carlo (MCMC) techniques. Recent research in hydrologic modeling has shown Bayesian statistical inference to provide a powerful framework for assessing parameter uncertainty and subsequent uncertainty in rainfall—runoff model simulations [Bates and Campbell, 2001; Marshall et al., 2004], groundwater flow [Hassan et al., 2009], and solute export [Qian, 2005, Zobrist and Reichert, 2006, Shrestha, 2008]. This is because uncertainty in the model parameters can easily be assessed through the posterior distribution. Instead of a single fit to the data, Bayesian methods estimate a distribution of possible parameter values, known as the posterior distribution. To ensure that the simulated posterior distribution was representative of the true posterior distribution, the convergence of an MCMC chain was assessed by the Gelman-Rubin convergence diagnostic test [Gelman and Rubin, 1992]. The Gelman-Rubin diagnostic test is based on running multiple chains with starting points widely dispersed throughout the posterior distribution. The Gelman-Rubin approach diagnoses convergence by calculating the estimated potential scale reduction (R), which compares the variance within and between the multiple chains. At convergence, R should be close to 1.
For this project, model simulations were performed in Matlab. Each model simulation was run for 200,000 iterations. The first 100,000 iterations were discarded and the remaining 100,000 were visually assessed for convergence. The model was rerun after changing the starting parameters to the mean parameter values of the last 100,000 iterations. Once the chain visually appeared to have converged, multiple chains were run with starting values chosen across the simulated posterior distribution to compute the Gelman-Rubin statistic. If R was not close to 1, then further model simulations were performed.
Conclusions:
Exploratory spatial analysis provided evidence that spatial and seasonal variability existed in the influences of LULC and watershed characteristics on streamwater quality (Table 1, Figure 3) [Gardner and McGlynn, 2009]. The results suggest that at lower elevations during the growing season (high biological potential), N immobilization may lead to a break down of spatial streamwater N patterns, therefore masking or potentially inhibiting LULC impacts on streamwater NO3-concentrations. In high-elevation alpine environments, N concentrations remained elevated year-long (Figure 3). Spatial linear models indicated seasonal differences in the range of spatial autocorrelation of synoptic streamwater NO3- concentrations: streamwater NO3-concentrations were spatially correlated at a larger scale during the dormant season as compared to the growing season (Figure 4). Spatial linear models of streamwater NO3- revealed seasonal shifts in the influence of LULC and watershed characteristics on streamwater NO3- (Table 1). In the dormant season, N loading variables explained the most variability in streamwater NO3- concentrations, while during the growing season, riparian buffering potential and percent forest most strongly influenced streamwater NO3-.
Empirical analysis of the spatial and seasonal streamwater N indicated that spatial and seasonal variability existed among watersheds in the magnitude and speciation of streamwater N export [Gardner and McGlynn, in prep. B]. Specifically, our research found:
- Developed watersheds had much higher annual NO3- export and a slightly higher DON export compared to undeveloped watersheds (Figure 5).
- Snowmelt dominated annual export budget of DON and NO3- (Figure 5).
- In streams receiving limited anthropogenic N loading, there was a seasonal shift in the relative abundance of DIN and DON. DIN:DON was less than one during the growing season (snowmelt and summer) and greater than one in the dormant season (winter). In the stream receiving the most anthropogenic N, DIN:DON was greater than one throughout the year (Figure 5).
- Our research suggests seasonal variability of thresholds of watershed N retention: winter N thresholds were less than summer N thresholds when increased potential for biological activity allowed for increased watershed N retention (Figure 5, Figure 6).
- N loading impacts were most apparent in the winter months when streamwater NO3- concentrations downstream of N loading sources were two to three times greater than streamwater NO3- concentrations in pristine areas (Figure 5, Figure 6).
- Our research suggests spatial variability in thresholds of watershed N retention. During summer low flow, N saturation signs were exhibited in high elevation watersheds (high DIN:DON), however in lower elevations, with greater potential for biological activity, N concentrations were low (Figure 3).
- 15N isotopes provided insight into sources of elevated streamwater N at high elevations and sites downgradient of the golf course (Figure 7). Wastewater did contribute to elevated N downgradient from the golf course, but did not contribute to elevated N at high elevations.
- 15N illustrated seasonal variability of N sources (wastewater vs. soil water) in developed watersheds (Figure 8). During baseflow, d15N of NO3- values indicated a significant contribution from wastewater to streamwater NO3- concentrations in the Middle Fork, while during snowmelt d15N of NO3- values were more similar to soil/geologic NO3-.
- 18O provided information on the seasonal variability of N sources (atmospheric vs. soil water) in developed and undeveloped watersheds (Figure 8). d18O of NO3- signatures were more similar to soil NO3-signifying that soil NO3- was the main contributor to streamwater NO3- concentrations. During snowmelt, enriched d8O of NO3- values at all sites pointed to higher contributions from atmospheric NO3- than other times of year.
PhD student Kristin Gardner is currently working on publishing this work and we expect submission to Water Resources Research later this spring.
Table 1: Spatial linear models fitted to streamwater NO3- for each synoptic sampling campaign.
|
Synoptic Month | Explanatory Variables |
Coefficient |
p-value |
r2 |
RMPSE |
| October 2006 | Intercept | 0.033 | 0.023 | 0.75 | 0.047 |
| (Late Fall) | SepticTT | 2.379 | 0.002 |
|
|
|
| Wastewater | 0.092 | < 0.001 |
|
|
|
|
|
|
|
|
|
| February 2006 | Intercept | 0.085 | < 0.001 | 0.90 | 0.037 |
| (Winter) | Septic | 0.0005 | < 0.001 |
|
|
|
| Wastewater | 0.221 | < 0.001 |
|
|
|
| Geology | 40.0 | 0.008 |
|
|
|
|
|
|
|
|
|
| March 2007 | Intercept | 0.083 | < 0.001 | 0.37 | 0.059 |
| (Early Spring) | SepticTT | 1.942 | < 0.001 |
|
|
|
|
|
|
|
|
|
| June 2006 | Intercept | 0.209 | < 0.001 | 0.06 | 0.045 |
| (Late Spring) | SepticTT | 1.437 | 0.002 |
|
|
|
| Riparian Buffer Potential | -1.441 | 0.004 |
|
|
|
| Stream Order | -0.033 | 0.006 |
|
|
|
| Forest | -0.135 | 0.027 |
|
|
|
|
|
|
|
|
|
| August 2007 | Geology | 53.5 | <0.0001 | 0.53 | 0.0203 |
| (Summer) | Forest | -0.117 | 0.003 |
|
|
|
|
|
|
|
|
|
| September 2005 | Intercept | 0.139 | < 0.001 | 0.45 | 0.028 |
| (Late Summer) | Geology | 45.42 | < 0.001 |
|
|
|
| Wastewater | 0.058 | < 0.001 |
|
|
|
| Forest | -0.018 | < 0.001 |
|
|
|
| Riparian Buffer Potential | -0.626 | 0.077 |
|
|
Instream uptake experiments
Analysis of data from the instream N uptake experiments indicated that watershed area, discharge, stream order, number of residences per watershed, and background nitrogen (N) concentrations influenced nitrogen uptake dynamics [McNamara et al., in prep]. For the six stream reaches studied in the West Fork watershed, physical N retention generally decreased as watershed area increased, biological N retention increased as watershed area increased, and physical N retention generally decreased as biological N retention increased (Figure 9). N uptake lengths (Sw-amb) across the six sites varied with ambient conditions. For the majority of stream reaches, N uptake length decreased as watershed area, discharge and stream order increased. Streams reaches with increased background nitrogen concentrations generally had decreased Sw-amb values. We observed a general decrease in Sw-amb with an increase in average annual N concentration for all six reaches. Watershed area, stream order and number of residences had a significant influence on ambient areal uptake rates (Uamb) across the six reaches. For maximum areal uptake rate (Umax), watershed area and discharge both had significant positive correlations. N uptake velocity values (Vf-amb) were quite similar for four of the six streams despite other ambient conditions varying across these four sites. Master’s student Rebecca McNamara is currently working on publishing this work and we expect submission to JGRBiogeosciences later this spring. For additional description of the methods developed as part of this project to determine full stream N uptake kinetic curves, the relative importance of physical and biological N retention, and related research by the MSU Watershed Hydrology Lab, please see Covino et al [in review A, B].
N mineral weathering experiments
Geochemical weathering experiments revealed that the eight different rock types produced a range of N concentrations within 3 days: 0.2 to 435 µM NO3- and < 0.5 to 37 µM ammonium (NH4+) [Ackerman eta l., in prep]. NO3- concentrations generated by the rock-water extracts were significantly greater (p= 0.05) than controls for 5 samples of the 8 rocks sampled and were notably higher (> 2.8 mg L-1 or 200 uM) for the rock extracts representing the surface geology in the Yellow Mule Stream basins (Figure 10).
Comparisons of aqueous chemical composition between rock:water extracts and stream waters from the same areas provided several insights to the source of streamwater NO3-. Because of their surface minerals, the southern portion of the watershed may be more susceptible to erosion and or stream water NO3- export. The δ15N- NO3- values generated from the rock-weathering experiment (1.9 to 3.1 ‰) separate headwater streams from those downstream of development (septic influences), and establishes a background 15N- NO3- signal that can be explained by the catchment geology (Figure 11). These isotopic values are important to establish a range of natural N sources since soil d15N values from the literature span up to 9 ‰ [Kendall and McDonnell, 1998]. Montana State University Watershed Hydrology Lab chemist Galena Ackerman is currently working on publishing this work which is to be submitted later this spring.
N export coefficient model
Preliminary results of the N export model developed as part of this project include [Gardner and McGlynn, in prep]:
- The N export coefficient model was a good predictor of streamwater N (Nash Sutcliffe = 0.90)
- Wastewater loading, riparian buffer, and travel time (spatial location) parameters were most identifiable, and therefore the primary controls on streamwater N.
- Total N loading in West Fork watershed ranged from 39 to 73 kg/ha/yr
- The majority of N loading was retained in the uplands either through biological retention or a lack of hydrologic connectivity between the uplands and the stream.
PhD student Kristin Gardner is presently working on publishing this work and projects submission this spring to Water Resources Research.
References:
Aber, J.D., Nadelhoffer, K.J., Steudler, P., and J.M.Melillo. (1989). Nitrogen saturation in northern forest ecosystems: excess nitrogen from fossil fuel combustion may stress the biosphere. BioScience. 39(60: 378-385.
Ackerman, G., B.L. McGlynn, S. Montross, and K. Gardner. In prep. Rock nitrogen weathering relationships to mountain streamwater N variability.
Baron, J.S., Rueth H.M., Wolfe, A.M., Nydick, K.R. Alstott, E.A., Minear, J.T. and B. Moraska, 2000. Ecosystem response to nitrogen deposition in the Colorado Front Range. Ecosystems 3: 352-368.
Bates, B.C., and E.P. Campbell (2001). A Markov chain Monte Carlo scheme for parameter estimation and inference in conceptual rainfall-runoff modeling, Water Resources Research, 37(4), 937-947.
Burns, D.A. (2003). The effects of atmospheric nitrogen deposition in the Rocky Mountains of Colorado and southern Wyoming, USA – a critical review. Environmental Pollution, 127: 257-269.
Campos, N. In review. Effects of Lidar-Quickbird fusion on object oriented classification of mountain resort development, Photogrammetric Engineering and Remote Sensing.
Covino, T.P., B.L. McGlynn, R.A. McNamara. In review A. Quantifying stream nutrient uptake kinetics from ambient to saturation: Tracer Additions for Spiraling Curve Characterization. Limnology and Oceanography: Methods.
Covino, T.P., B.L. McGlynn, and M.A. Baker. In review B. Separating physical and biological nutrient retention and quantifying uptake kinetics from ambient to saturation in successive mountain stream reaches. Journal of Geophysical Research - Biogeosciences.
Earl, S. R., H. M. Valett, and J. R. Webster. 2006. Nitrogen saturation in stream ecosystems. Ecology 87:3140-3151.
Edreny T.A., and E.F.Wood. 2003. Watershed weighting of export coefficients to map critical phosphorous loading areas. Journal of the American Water Resources Association, 39(1): 165-181.
Gardner, K.K. and B.L. McGlynn. 2009. Seasonality in spatial variability and influence of land use/land cover and watershed characteristics on streamwater nitrate concentrations in a developing watershed in the Rocky Mountain West. Water Resources Research. DOI: 10.1029/2008WR007029.
Gardner, K.K, B.L. McGlynn, and L.A. Marshall. In preparation A. All nitrogen loading is not created equal: disproportionate land use impacts on stream water nitrogen.
Gardner, K.K., B.L. McGlynn. In preparation B. Seasonal and spatial variability of nitrogen saturation dynamics across environmental and land use gradients in a developing mountain watershed.
Gelman, A., and D.B. Rubin (1992). Inference from iterative simulation using multiple sequences. Statistical Science, 7:457-511.
Hassan, A.E., H.M. Bekhit, and J.B. Chapman (2009). Using Markov Chain Monte Carlo to quantify parameter uncertainty and its effect on predictions of a groundwater flow model. Environmental Modelling & Software, 24: 749-763.
Kaushal, S.S., W.M. Lewis, and J.H. McCutchan (2006). Land use change and nitrogen enrichment of a Rocky Mountain Watershed. Ecological Applications, 16(1):299-312.
Kellog, K.S. and V.S. Williams (2005). Geologic Map of the Ennis 30’ X 60’ Quadrangle, Madison and Gallatin counties, Montana and Park County, Wyoming. Montana Bureau of Mines and Geology Open File No. 529.
Kendall, C and J.J. McDonnell (1998). Isotope Tracers in Catchment Hydrology. Chapter 16. Elsevier, New York.
Lovett, G.M., Weathers, K.C., and W.V.Sobczak. (2000). Nitrogen saturation and retention in forested watersheds of the Catskill Mountains, New York. Ecological Applications, 10(1): 73-84.
Magill, A.H., Aber, J.D, Berntson, G.M, McDowell, W.H., Nadelhoffer, K.J., Melillo, J.M., and P. Steudler. (2000). Long-term nitrogen additions and nitrogen saturation in two temperate forests. Ecosystems, 3: 238-253.
Marshall, L., D. Nott, and A. Sharma (2004). A comparative study of Markov chain Monte Carlo methods for conceptual rainfall-runoff modeling. Water Resources Research, 40, W02501, doi: 10.1029/2003WR002378.
McGlynn, B.L., and J. Seibert (2003). Distributed assessment of contributing area and riparian buffering along stream networks. Water Resources Research, 39(4), 1082, doi:10.1029/2002WR001521.
McGuire, K. J., J. J. McDonnell, M. Weiler, C. Kendall, B. L. McGlynn, J. M. Welker, and J. Seibert. 2005. The role of topography on catchment-scale water residence time. Water Resources Research, 41, W05002, doi:10.1029/2004WR003657.
McNamara, R., B.L. McGlynn, T.C. Covino, K. Gardner. In preparation. The kinetics of instream N immobilization acrss space and time in a developing mountain watershed.
Messerli, B. and J.D. Ives. 1997. Mountains of the World: A Global Priority (London and New York: Parthenon Publishing Group.
Murdoch, P.S., and J.L. Stoddard. 1992. The role of nitrate in the acidification of streams in the Catskill Mountains of New York. Water Resources Research, 28(10): 2707-2720.
Newbold, J. D., T. L. Bott, L. A. Kaplan, C. L. Dow, J. K. Jackson, A. K. Aufdenkampe, L. A. Martin, D. J. Van Horn, and A. A. de Long (2006), Uptake of nutrients and organic C in streams in New York City drinking-water-supply watersheds, Journal of the North American Benthological Society, 25(4), 998-1017.
Peterson, E.E., D.M. Theobald, and J.M. Ver Hoef (2007). Geostatistical modeling on stream networks: developing valid covariance matrices based on hydrologic distance and stream flow. Freshwater Biology. 52: 267-279.
Qian, S.S., K.H. Reckhow, Zhai, J., and G. McMahon (2005). Nonlinear regression modeling of nutrient loads in streams: A Bayesian approach. Water Resources Research, 41, W07012, doi: 10.1029/2005WR003986.
Ruggiero, Antonio, Solimini, Angelo G., Anello, Manuela, Romano, Antonio, De Cicco, Marco and Carchini, Gianmaria (2006) 'Nitrogen and phosphorus retention in a human altered stream', Chemistry and Ecology, 22:4, S1 - S13. DOI: 10.1080/02757540600556753
Seibert, J. and B.L. McGlynn (2007). A new triangular multiple flow-direction algorithm for computing upslope areas from gridded digital elevation models. Water Resources Research, 43, W04501, doi:10.1029/2006WR005128.
Shrestha, S., F.Kazama, and L.T.H. Newham (2008). A framework for estimating pollutant export coefficients from long-term in-stream water quality monitoring data. Environmental Modelling & Software, 23: 182-194.
Tank, J. L., E. J. Rosi-Marshall, M. A. Baker, and R. O. Hall (2008), Are rivers just big streams? A pulse method to quantify nitrogen demand in a large river, Ecology, 89(10), 2935-2945.
Ver Hoef, J.M., E.E. Peterson, and D.M. Theobald (2006). Spatial statistical models that use flow and stream distance. Environmental and Ecological Statistics, 13: 449-464.
Webster, J. R. & H. M. Valett. (2006). Solute Dynamics. In, F. R. Hauer & G. A. Lamberti (Ed.). Methods in Stream Ecology. (pp169-185). Burlington, MA: Elsevier.
Worrall, F., and T.P. Burt. 2001. Inter-annual controls on nitrate export from an agricultural catchment- how much land-use change is safe. Journal of Hydrology, 243: 228-241.
Zobrist, J. and P. Reichert (2006). Bayesian estimation of export coefficients from diffuse and point sources in Swiss watersheds. Journal of Hydrology, 329: 207-223.
Journal Articles:
No journal articles submitted with this report: View all 25 publications for this projectSupplemental Keywords:
RFA, Ecosystem Protection/Environmental Exposure & Risk, Scientific Discipline, Aquatic Ecosystem, Aquatic Ecosystems & Estuarine Research, Ecological Risk Assessment, Ecology and Ecosystems, Environmental Monitoring, environmental history, water quality, anthropogenic impact, estuarine research, ecological thresholds, ecosystem indicators, modeling ecosystem change, ecosystem response, ecosystem stress, riverine ecosystems, trophic interactions, land use, nitrogen cycling, aquatic ecosystems, landscape changeProgress and Final Reports:
Original AbstractThe perspectives, information and conclusions conveyed in research project abstracts, progress reports, final reports, journal abstracts and journal publications convey the viewpoints of the principal investigator and may not represent the views and policies of ORD and EPA. Conclusions drawn by the principal investigators have not been reviewed by the Agency.