
Grantee Research Project Results
2008 Progress Report: A Valley Fever (Coccidioidomycosis) Public Health Decision Support System Based on Climate and Environmental Changes
EPA Grant Number: R832754Title: A Valley Fever (Coccidioidomycosis) Public Health Decision Support System Based on Climate and Environmental Changes
Investigators: Comrie, Andrew C. , Yool, Stephen R.
Institution: University of Arizona
EPA Project Officer: Chung, Serena
Project Period: December 14, 2005 through December 13, 2007 (Extended to December 13, 2009)
Project Period Covered by this Report: December 14, 2007 through December 13,2008
Project Amount: $265,004
RFA: Decision Support Systems Involving Climate Change and Public Health (2005) RFA Text | Recipients Lists
Research Category: Climate Change
Objective:
Develop a Valley Fever decision-support database for Arizona. This objective has not changed.
Progress Summary:
Understanding the basis of environmentally-mediated infectious disease is central to the mission of a number of federal agencies, including the Environmental Protection Agency, National Institutes of Health, Department of Homeland Security, and the Department of Defense. Valley fever (coccidioidomycosis) is an environmentally-controlled infectious disease endemic to arid regions in the Western Hemisphere. Valley Fever is caused by the soil-dwelling, fungal pathogens Coccidioides immitis and Coccidioides posadasii. The Arizona Department of Health Services (ADHS) continues to report significant incidence, exceeding other climate-related diseases (e.g., Hantavirus; West Nile Virus). Much of the seasonal variability in Valley Fever appears to be based on antecedent precipitation and atmospheric dust concentrations (Comrie, 2005; Comrie and Glueck, 2007; Stacy et al., in review). We are developing under the present agreement, and in collaboration with the ADHS, a public health decision-support database that builds on these findings. The database will serve as a practical reference for health officials and as a model for health information support systems in general. In Year 1, we worked with ADHS to secure human case data for model validation, developed initial climate-satellite-derived data relationships, and performed initial multi-layer, multi-scale remote sensing based spatial analysis of the surface landscape. In Year 2, we modeled exposure dates, continued development of remote sensing databases related to surface moisture, fungal ecology and dust exposure. In Year 3, we continued to develop and validate models begun in Years 1 and 2, working towards a multi-disciplinary suite of models to be included in our decision support database: We compiled from the free Landsat Thematic Mapper the timeseries required to characterize relationships between fugitive dust production and incidence (Ph.D. dissertation work of F. Scott Pianalto). We have gained access to zip-code level incidence data that, when upscaled to county level, provide the reference against which we will validate exposure and ecological databases. We have been developing ecological databases using the Landsat data archive. These ecological databases include space-time variations in moisture and greenness. We have added soils data to our decision support database that will characterize differences in soil organic content related to Coccidioides habitat requirements. Related presentations and papers are abstracted in the Appendix.
Year 3 Climate Modeling Progress
We continued sensitivity analyses of the seasonal modeling approach of Comrie (2005) using different quality control and adjustment procedures, evaluating model performance on coccidioidomycosis incidence data updated through 2005 (Comrie and Glueck, 2007). We acquired in Year 2 zip code level data from ADHS and developed a strategy for modeling exposure dates. Relationships identified between climate conditions and coccidioidomycosis incidence support the broader “grow and blow” hypothesis of regional climate influence on Valley Fever. We reported in Year 1 that climate explains a large proportion of variability in coccidioidomycosis incidence; however, it appears that the overall trend exceeds the magnitude of the variability. We found that a) antecedent fall precipitation appears to have some long-term influence on detrended incidence; and b) dust remains important for dispersion in winter and foresummer. It is unclear whether the longer trend is due to a non-climate factor (e.g., urban expansion, improved reporting, etc.) or some decadal-scale climate response not resolved in these short periods of data.
In Year 2, we carried out extensive bivariate and multivariate analyses to complete a thorough evaluation of potential predictors for detrended and variance-corrected incidence data. We began developing our final suite of multivariate models. Interim results appeared to confirm that climate and associated fluctuations in seasonal and year-to-year environmental factors account for as much as 80 percent of the coccidioidomycosis incidence variability about the trend.
In Year 3, we conducted numerous univariate and bivariate lag analyses of case rates in Maricopa and Pima counties in 2008. The case-data received from ADHS has a strong trend that we conclude is an artifact of enhanced surveillance. To perform analyses on the data, we removed the trend and equalized the variance across time. Several epidemics are apparent in the corrected time-series of case rates (Figure 1). Both counties have strong peaks in late-Fall, and Pima has an additional peak in late-Spring. The univariate analyses demonstrate strong-positive correlations between case-rates in late-Winter through early-Spring. The case rates during this period are also modulated by precipitation and humidity (see lag correlations in Figure 2), supporting the “blow and grow” hypothesis. No relationship is identified between the case rates during the Spring months and early Summer. It is unknown what factors are related to this characteristic, but it occurs near the beginning of the monsoon season suggesting that precipitation may reduce the likelihood of infection during this time of year, also supporting the “grow and blow” hypothesis. We are in the process of finalizing multivariate models to provide greater insight into these processes.
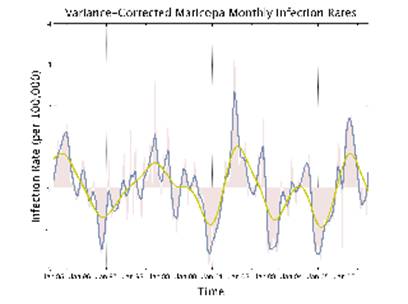
Figure 1: Case-rate anomalies for Maricopa County. Two splines are fit to the data to highlight the general trends.
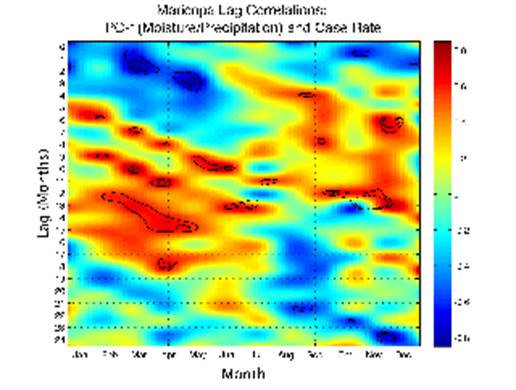
Figure 2: Lag correlation matrix indicating the correlation coefficient between Maricopa County case-rate and PC-2 (humidity and precipitation). The solid black line is significant at 0.05 and the dotted lines are significant at 0.05 w/ Bonferonni correction. X-axis is months (Jan to December). Y-axis is Lag(months). Correlation coefficient ranges from –1 ( dark blue) to 1 (red).
Year 3 Surface Modeling Progress
A major aim of this project was to investigate the fitness of remote sensing technology for development of data relevant to Valley Fever decision support. We extended remote sensing protocols in Year 3 for moisture modeling, ecological modeling and exposure modeling.
Year 3 Multi-Scale Remote Sensing Surface Moisture Modeling
We used the AVHRR NDVI database assembled in Year 1 to compare NDVI time series with Valley Fever incidence--testing hypotheses linking soil moisture to fungal growth. Incidence has a strong upward trend in recent years that is not reflected in modeled soil moistures, consistent with other findings that the cause of the trend is non-climatic. Seasonal patterns of the disease and NDVI in all three counties display an apparent inverse bimodal relationship consistent with fungal spore dispersion in the dry seasons, but we find that these are not significant from year to year. Results of lagged regression modeling show that moist soil in the early spring, resulting from winter precipitation, is significantly associated with increased incidence up to a year later in all three counties (Stacy, et al., in review).
We selected the Normalized Difference Vegetation Index (NDVI) as a proxy for surface moisture based on results from prior work. We reported in Year 1 results of studies designed to test the viability of the MODIS for higher-resolution modeling of surface moisture. We reported suitable agreement between the 250m resolution MODIS NDVI and the 1km AVHRR NDVI. This result demonstrates that the surface moisture data can be rescaled linearly between resolutions, an important consideration when using data obtained at multiple resolutions in monitoring and modeling environmentally-mediated diseases such as Valley Fever. We developed in Year 2 a MODIS Organic Matter Index in support of ecological modeling.
We are in Year 3 using the Landsat Thematic Mapper data to characterize temporal trends in surface moisture at comparatively fine scales. We believe the operational scale (i.e., the scale of action) of Coccidioides is likely quite fine, and that these finescale spectral data will enable us to investigate the ‘grow’ scale of the fungus closer to its likely scale of action. We can with the nominal 30m spatial resolution of Landsat thus provide higher quality areal database of surface moisture variability than possible from the 1km AVHRR. We will be using Landsat band 5 (i.e., the ‘water’ band: 1.55-1.75 μm) to track temporal trends in surface moisture; we can at this ‘granularity’ correlate more readily putative relationships between surface moisture and disease incidence.
Year 3 Ecological Modeling
We are continuing the ecological modeling work in Year 3 of this project. We have acquired 90 free LANDSAT TM images of Maricopa (Phoenix), Pima (Tucson), and Pinal (Casa Grande) counties that establish time series for the three scenes (p36 r37, p36 r38, and p37 r37) from 1984 to 2008 of the late spring (late May to early June). Subsets of the areas common to all images from the three scenes are being radiometrically and atmospherically corrected. These images will be used to establish a decision support database that includes surface disturbance, soil moisture, soil temperature, and other ecological parameters.
Year 3 Exposure Modeling
The objective of our exposure modeling is to identify areas of land surface disturbance as potential fungal spore dispersion. Landsat Thematic Mapper 5 satellite data were obtained from U.S. Geological Survey covering the central and southeastern Arizona counties of Maricopa, Pima and Pinal. Annual images were obtained for the three counties for the period between 1984 and the 2008. Image preprocessing procedures were commenced. A band differencing technique (Landsat TM Band 5; 1.55 through 1.75 micrometers, mid-infrared spectral region) was investigated and implemented due to its simplicity and superior results achieved over the Principal Component Analysis technique. The band differencing change detection technique was tested with the Pima County satellite data set. As shown in Figure 3, the spatial change signal generated from the satellite data was compared with Pima County dust inspection permit data, consisting of spatial data for grading, trenching, road construction and subdivision development activities occurring in the county, to validate the change detection method. Results show good cross-correlation between the Thematic Mapper change detection protocol and dust inspection data.
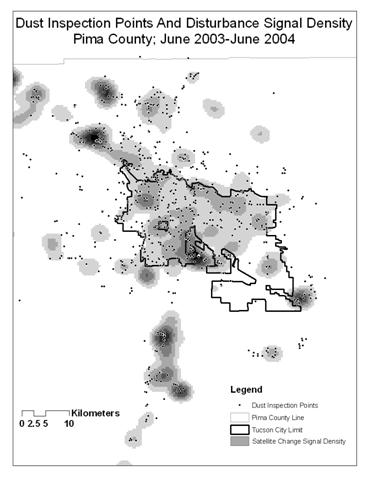
Figure 3: Tucson area map showing a kernel density function generated from change pixels from the Landsat TM satellite images. The Band 5 layer (1.55 through 1.75 micrometers, mid-infrared spectral region) of the May 15, 2003 image was subtracted from the corresponding layer in the June 2, 2004 image for a change image. All pixels with a change signal greater or less than four standard deviations were input into a quadratic kernel density function. Dust inspection locations of the Pima County Department of Environmental Quality for the corresponding time period are shown as points on the map for comparison.
Exposure modeling stages nearing completion:
- complete preprocessing of all three county's annual satellite images;
- accomplish change detection for all three counties;
- fine-tune change signal thresholding criteria to minimize false positives and omissions;
- develop annual county-wide and zip code surface disturbance ratings or rankings for the period between 1984-2007;
- compare surface disturbance signal to coccidioidomycosis incidence by county and zip code in the tri-county area.
The final product is intended to be a workable exposure/surface disturbance model appropriate for use by stakeholders engaged in public health decision-making. The objective of exposure modeling is to identify areas of land surface disturbance as potential fungal spore dispersion. Year 2 progress included application of ‘mask’ that isolates the Lower Sonoran Life Zone (LSLZ). The LSLZ is considered by mycologists to be prime habitat for Coccidioides. We applied change detection techniques to six non-thermal bands of Landsat Thematic Mapper satellite images over the period of 2000 to 2005 in eastern Pima County, identifying locations and extent of human disturbance (e.g., grading; subdivision construction; road construction; and trenching). We collected dust inspection permit data from Pima County to validate the change detection methods. Results show good cross-correlation between the Thematic Mapper change detection protocols and dust inspection data. This is an important finding: Although dust inspection permits go back only a few years, the Landsat Thematic Mapper timeseries extends back to the mid 1980s. We thus have an excellent historical record of surface disturbance for modeling purposes. Year 3 progress involved choosing best image subset from which to derive exposure statistics. We explored methods to reduce false alarms (e.g., those apparent signals arising from seasonal changes in vegetation rather than disturbance.
The exposure model is being developed by a Ph.D. candidate who is not funded by this EPA grant.
Year 3 Data Quality Assurance
We are confident we conform to 40 C.F.R. 30.54. Climate and satellite data derive from government sources. Satellite data are calibrated to achieve maximum accuracy in space and time, thus are optimal for environmental measurement and data generation. Human disease case data have been processed into GIS format and certified accurate by ADHS. In Year 3, we continue to use human case data in conformance with federal human subjects guidelines.
Year 3 Stakeholder Involvement
We are continuing collaborations with stakeholders at the ADHS to put in place a set of seasonal models and associated databases that will enable anticipation of coccidioidomycosis outbreaks and improved public health actions to mitigate them. We have maintained contact with Arizona State Epidemiologist Ken Komatsu, securing release of human incidence data for model validation and pre-processing released data to suit our project needs. The package of decision support tools will become part of the management environment for coccidioidomycosis control and prevention at ADHS. Results apply and increase the use of climate information for public health decision makers. This information will provide ADHS and other state health stakeholders a range of public health responses tailored by place and time to the level of potential risk.
In addition we have engaged in discussions with international colleagues at University of Adelaide through an Invited Colloquium presentation (Yool) as well as numerous regional U.S. stakeholders through outreach and professional presentations.
Future Activities:
The overall aim of Year 3 was to fully develop our climate, surface moisture, ecological and exposure databases. We have articulated these databases with zip code and county level human cases so outcomes are useful potentially at both county and local scales. The zip code data provide a basis for fine scale studies we believe are key to understanding the operational scale of this pathogen. The fine scale work on fungal ecology and disturbance was neither proposed nor funded for the current effort. We have engaged graduate student researchers to expand the merits of this (see exposure modeling section).
We will in the last phase of this project compare growth and exposure databases with incidence data. We will configure the databases in a format accessible readily to the Arizona Department of Health Services, the Valley Fever Center for Excellence, and other practitioners. We will use results of this work to leverage new funded research. We will present our findings at major disciplinary technical meetings, including international venues.
Journal Articles:
No journal articles submitted with this report: View all 29 publications for this projectSupplemental Keywords:
Geographic epidemiology, climate modeling, geospatial information technology, remote sensing & GIS,, RFA, Health, Air, Scientific Discipline, Ecological Risk Assessment, Health Risk Assessment, Risk Assessments, Atmosphere, Air Pollution Effects, climate change, Environmental Monitoring, ecosystem models, Global Climate Change, air quality modeling, human exposure, regional climate model, decision making database tool, climate models, demographics, ambient air pollution, human health risk, modeling, climatic influence, coccidioidomycosisProgress and Final Reports:
Original AbstractThe perspectives, information and conclusions conveyed in research project abstracts, progress reports, final reports, journal abstracts and journal publications convey the viewpoints of the principal investigator and may not represent the views and policies of ORD and EPA. Conclusions drawn by the principal investigators have not been reviewed by the Agency.