
Grantee Research Project Results
2007 Progress Report: Development of a Virulence Factor Biochip and its Validation for Microbial Risk Assessment in Drinking Water
EPA Grant Number: R831628Title: Development of a Virulence Factor Biochip and its Validation for Microbial Risk Assessment in Drinking Water
Investigators: Rose, Joan B. , Whittam, Thomas S. , Gulari, Erdogan , Hashsham, Syed
Institution: Michigan State University , University of Michigan
EPA Project Officer: Packard, Benjamin H
Project Period: November 1, 2004 through October 31, 2007 (Extended to April 30, 2009)
Project Period Covered by this Report: November 1, 2006 through October 31,2007
Project Amount: $600,000
RFA: Microbial Risk in Drinking Water (2003) RFA Text | Recipients Lists
Research Category: Drinking Water , Water
Objective:
The concept of using genetic databases for identifying microbial risks in water, coined as Virulence-Factor Activity Relationships (VFARs), was first developed by the Committee on Drinking Water Contaminants, National Research Council as an approach to screen microorganisms for their occurrence in water and/or their ability to cause harm and waterborne disease. We currently are developing a bioinformatics pilot program for the assessment of VFARs and have developed a biochip known as GeneScreen for the detection of Escherichia coli bacteria exploiting the sequence variability inherent in 16S and 23S rRNAs, spacer region, and virulence and functional genes that can provide identification (taxonomy) to the genus and species, as well as pathogenicity and potential risk.
In our original proposal, we had proposed the development and validation of a high-density biochip for some 15 groups or genera/species of targeted bacteria and viruses, some of which are on the Contaminant Candidate List and others that are important for the assessment of the microbial safety of water. We targeted traditional indicator organisms, pathogenic bacterial strains and viruses, as well as key virulence factors. Our specific goals were to: (1) select gene targets to encompass the microorganisms of interest to water safety; (2) design probes to uniquely identify each of the above microorganisms and provide reliable detection; (3) synthesize microfluidic biochips containing the above set of probes in replicate with positive and negative controls (biochip synthesis); (4) validate and field test the synthesized biochips using standard individual targets, appropriate target mixtures, and field samples (validation and field testing); and (5) undertake a pilot risk analysis of a water system(s), testing a variety of computational approaches for interpreting the results of the biochip (analysis).
In this report, we summarize the work done and results achieved thus far in two areas: (1) Developments of a Functional Gene Based Fecal Indicator Biochip (2) Detection of Circulating Enteric Viruses in Sewage Using Oligonucleotide Microarrays
Progress Summary:
Development of a Functional Gene-Based Fecal Indicator Biochip
To improve the identification of host-specific gene sequence signatures indicative of fecal contamination, a second version of the fecal indicator biochip was designed using an extensive set of functional genes as genetic markers. These included mainly genes linked to virulence, antibiotic resistance, and cellulose degradation. A fecal indicator biochip based on functional genes as genetic targets is anticipated to circumvent a number of issues inherent to 16S rRNA gene based diagnostic platforms, including their limited ability to differentiate among closely related microorganisms. The following tasks were performed as part of the developmental and validation process:
- Gene selection and probe design,
- Chip synthesis, and
- Sample collection and sample preparation (including whole-genome amplification)
This version of the fecal indicator biochip extends upon previous work focusing on the application of a 16S rRNA gene based fecal indicator biochip (see previous reports). Experimental evaluation of this earlier biochip with various samples yielded, however, no host-specific 16S rRNA gene signature sequences. New analysis of the hybridization patterns based on positive fraction (i.e., the fraction of probes for a given target yielding positive hybridization signal, Miller et al., 2007) supported our initial observations and yielded no substantial differences among samples (data not shown). A number of factors may have attributed to the limited success of the 16S rRNA gene biochip in identifying host-specific signature probe sets, such as target dangling end effects (Stedtfeld et al., 2007), large 16S rRNA gene amplicons size, and complexity of the microbial community. The following sections describe the work completed so far with the new chip based on functional gene targets of various potential indicator groups.
Probe design and chip synthesis. To build a comprehensive sequence database for probe design, over 900 Protein IDs were collected from publically available databases, and used as training sequences (‘seeds’) in The Functional Gene Pipeline Repository (FGPR; www.cme.msu.edu/rdp/fungene/) to automatically collect and update all available homologues for each gene family. Probe selection was subsequently performed according to well-established design criteria using the software CommOligo (Li et al., 2005). This design yielded a total of ~8,000 probes targeting either specific alleles or groups of alleles depending on the sequence diversity of the genes. New indicator chips were synthesized using a light-directed in situ synthesis technology at the University of Michigan. These chips have a serpentine shape and produce clear hybridization images with high signal to noise ratio. Another change that was made compared to the previous chip was that only one sample was hybridized to a given chip eliminating the potential for cross hybridization. Fig. 1A is an example of the performance of this chip for selected set of model amplicons.
For the new chip, probe length was increased to 45 nucleotides. For the earlier 16S rRNA gene probe set, mainly 18-mer probes were used. As shown in Fig. 1B, long oligonucleotide probes generally yield higher hybridization signals in comparison with short probes due to their higher target binding affinity. This enhanced target binding capacity is important to allow gene target detection at abundance levels below 0.1 to 0.01% after target amplification using multiplex PCR (Miller et al., 2007). In addition, we observed an increase in signal uniformity for 45-mer probes in comparison with 18-mer probes, as evident from the steeper slope of the cumulative frequency distribution in Fig. 1. Signal uniformity is important to allow more reliable signal comparison among gene targets since the inherently more variable hybridization characteristics among short probes may complicate comparative analysis among different targets (Miller et al., 2007).
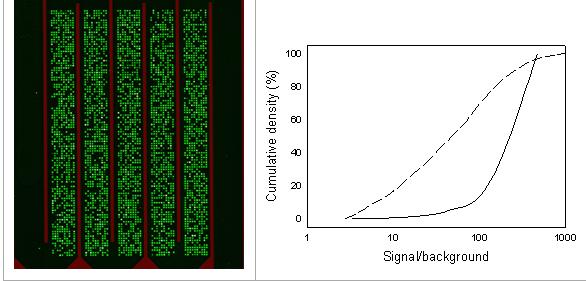
Figure 1. A) Image of a hybridized in situ synthesized serpentine microfluidic biochip containing 45-mer probes. Spot features are 50 µm, and probes were synthesized in the inner five channels. B) Cumulative frequency distribution of hybridization signals for 18-mer probes (dashed line) and 45-mer probes (solid line). Note that only probes with positive signals were included in this analysis to reduce potential skews in the distributions due to failed probes.
Sampling and sample preparation. The success of experimental screening of theoretically selected marker genes depends upon collection of samples covering a wide variability with respect to sample location, and time, and potentially outbreaks. Therefore, we collected samples from raw, primary, secondary, and tertiary effluent from 5 separate wastewater treatment plant in Michigan, river water upstream and downstream of the tertiary waste outfall, fecal matter from various hosts (horse, cow, chicken, sheep, and swine) from multiple farms, and multiple samples from surface waters in close proximity to manure storage facilities (Table 1).
All samples collected from wastewater treatment plants were concentrated using both dead-end filtration with 0.22 mm filters (Millipore) and conventional centrifugation. Surface water samples were concentrated using a portable continuous flow centrifugation device (PCFC) as described by Zuckerman et al. (1999; 2006). This device has been shown to be a superior alternative for concentration of waterborne protozoa compared to US-EPA method 1623. The PCFC allows concentration of 1000 L samples down to a few hundred milliliters, making it far superior to any other method for concentrating water samples.
Sample concentrates were subsequently centrifuged, and nucleic acids extracted using the UltraClean Mega Soil DNA Isolation Kit (MoBio Labs) according to the provided instructions. Extracts were further concentrated and purified using Microcon Centrifugal Filter Units (Millipore). The quantity and purity of the DNA extracts were measured with a NanoDrop ND-1000 UV-Vis spectrophotometer (NanoDrop Technologies). For all samples, successful PCR amplification of the 16S rRNA gene was observed demonstrating that a sufficient amount of high quality DNA was obtained. However, real time 16S rRNA gene amplification demonstrated substantial variability in threshold cycles for identical starting amounts (mass-based) of DNA. This may be attributed to impurities leading to PCR inhibition or variable amounts of bacterial DNA due to the presence of variable amounts of eukaryotic DNA. Additional efforts will be directed towards normalization approaches to account for these differences.
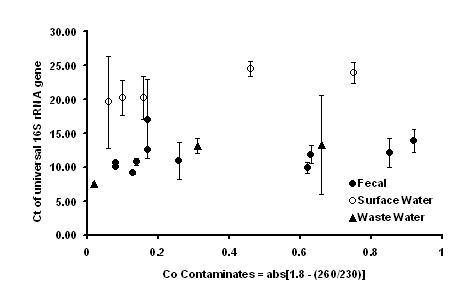
Figure 2. Effect of DNA sample purity and origin on the threshold cycle for the 16S rRNA gene primer set for equal amounts of starting material (mass-based).
Whole-genome amplification. We also evaluated whole-genome amplification (WGA) using rolling-circle amplification as an alternative means to obtain increased amounts of high quality DNA from environmental water samples. WGA using the TempliPhi DNA Amplification Kit (GE Healthcare Life Sciences) significantly enhanced hybridization signals in comparison with un-amplified total DNA from sewage samples with signal enhancements up to 10-fold (data not shown). This capability is important when dealing with water samples yielding either low amounts of DNA or DNA of low purity. To validate this approach, we are also evaluating the extent of potential amplification biases during WGA using real time PCR. Analyzed samples will include both pure culture DNA or complex DNA obtained from anaerobic bioreactors.
We are now in the process of validating the new fecal indicator biochip using the samples listed in Table 1. Target gene enrichment prior to hybridization will be performed using a split-multiplex PCR approach as previously developed for 47 virulence genes covering 12 bacterial pathogens (Miller et al., 2007).
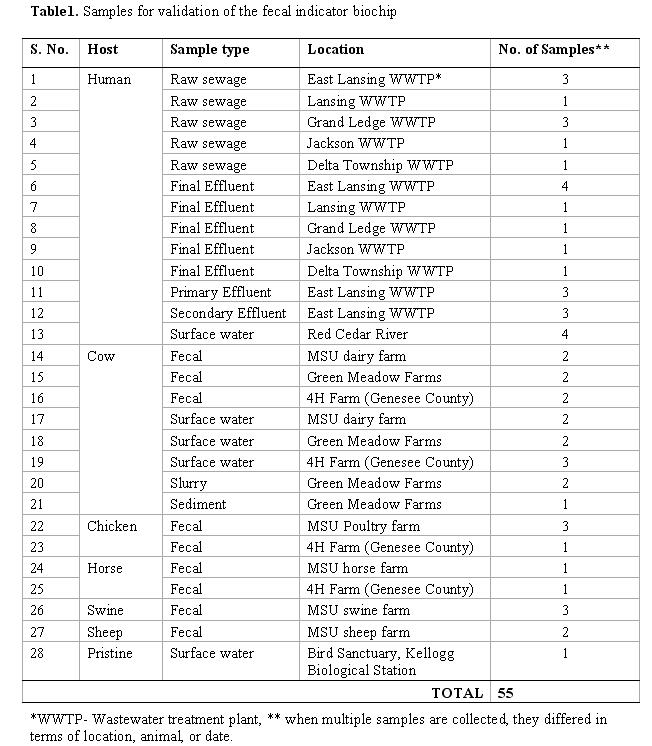
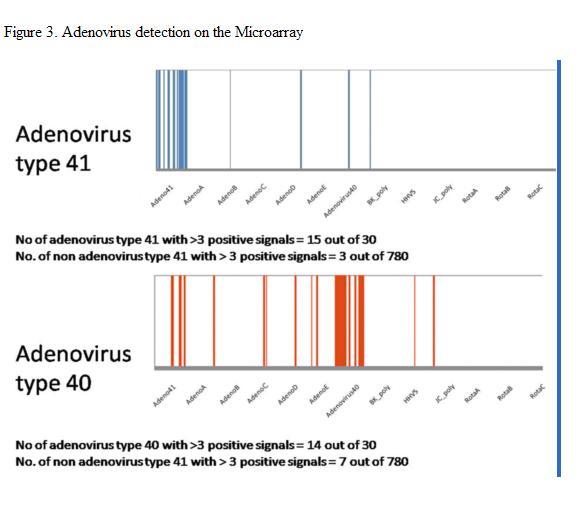
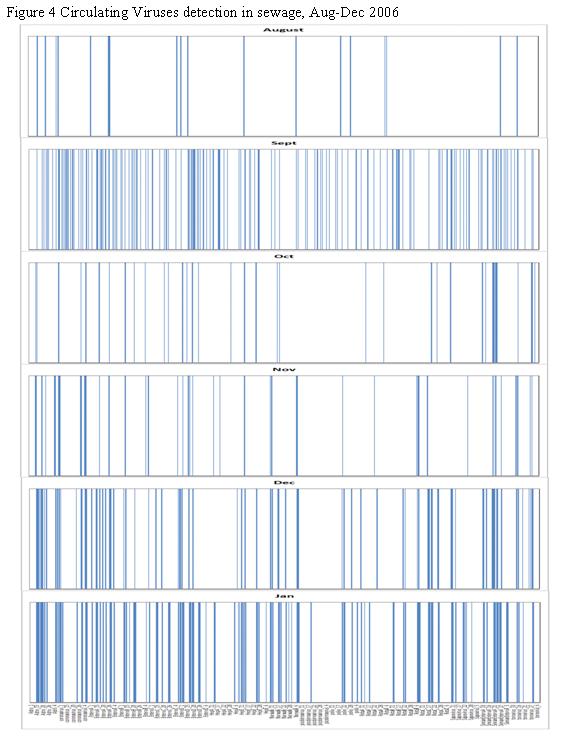
Figure 3. Detection of Circulating Enteric Viruses in Sewage Using Oligonucleotide Microarrays
Human viruses are responsible for a number of disease idiopathies ranging from mild gastroenteritis to more severe neurological symptoms. Their presence at high numbers in human excreta has been well documented. Current detection methods are limited in their ability to detect multiple virus types from single samples. Microarray technology has been used in the clinical arena to screen patient samples for many hundreds of pathogenic viruses in a single reaction. Adapting microarray technology to screen environmental samples for multiple pathogens has been suggested as an efficient tool with many potential applications. This study describes the novel use of a viral microarray to screen municipal wastewater for the presence of circulating human viruses. A total of 780 unique probes targeting 27 different groups of human pathogenic viruses were designed and tested against laboratory strain viruses and environmental samples. Approximately thirty probes were used to target each viral group. Results from testing against laboratory strains of poliovirus and adenovirus type 40 and 41 (Figure 3) indicate that the probes are highly specific for their targets and that cross hybridization of target nucleic acid is minimal even when closely related viruses species are mixed and co-hybridized on the array. Wastewater was screened from August to January (2006-2007) for circulating viruses in the community (Figure 4). RNA viruses were more frequently detected compared to DNA viruses. Some seasonality among certain viral groups was observed. All the sewage samples were found to contain infectious virus particles as determined by cell culture assay. Hybridization of total nucleic acid extracts from these six samples showed more target probes generating signals in December and January compared to August, September, October, March, April and May. Group A-D and type 41 Human Adenoviruses were detected more frequently than Group E and type 40 Human Adenoviruses. BK polyomaviruses were detected in January, but no JC polyomaviruses were detected in the same sample. RNA viruses were more frequently detected compared to DNA viruses but there was also a trend of increasing hits for RNA viruses in December and January compared to August, September, October, March, April and May. The astroviruses were observed throughout the period of study. RNA viruses present in August, September, October, March, April and May samples include Human Astroviruses, Hepatitis E viruses, Enterovirus groups A, C, D and E. Enterovirus group B, Hepatitis A virus, Sapovirus and Norwalk viruses were present only in December and January samples. Rotavirus group C was the most commonly detected rotavirus among the three groups (A-C) and likewise were generally present only in December and January samples.
In this study, probes targeting a broad group of 27 different viral families were designed and tested against lab strain and environmentally derived viruses. The use of short (approximately 25-mer) oligonucleotide probes allowed a high degree of specificity to be achieved. Specificity was also supplied by the use of the OligoArray software that pre-screened the generated probes in-silico to discard probes that were calculated to cross hybridize with other viral sequences. The use of multiple (approximately 30) probes targeting each broad group of viruses allowed the microarray, in theory, to target even unknown viral pathogens so long as they bore sufficient genetic relationship to the type strains represented on the array.
Background
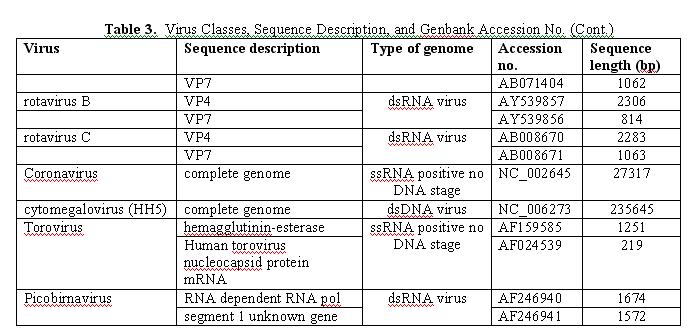
The virus microarray was designed to detect sequences from the group of viruses that are known or are suspected to cause diseases in drinking water. This group is comprised primarily of the enteroviruses but also includes several other viral families, for example, the hepatitis A virus, hepatitis E virus, sapovirus, Norwalk virus, rotavirus, etc. Table 3 shows the 23 major families of viral pathogens chosen for the chip, the reference genetic sequences used to perform the analysis (listed by accession number), and the sequence length. Wherever possible, complete viral genomes were chosen for probe design; however, in a few instances, such information was lacking and whatever sequence information available was used instead (e.g., the three human rotavirus families were represented by their viral protein 4 and 7 [VP4 and VP7, respectively], toroviruses were represented by the genes encoding hemagglutin-esterase and nucleocapside protein mRNA, picobirnaviruses were represented by their RNA-dependent RNA polymerase sequence and the first segment of an as-yet-unknown gene).
This approach of using representative genome sequences for probe design was adopted to provide as broad a chance of identifying a target virus from among these 23 target groups as possible, while at the same time being able to differentiate between these groups as specifically as possible.

Detection of Viral Pathogens in Water. Advantages to using a microarray approach versus conventional detection methods is that they can potentially be used to detect the gene sequences of a large number of viral targets in a single reaction. The use of multiple probes for a single viral target has the two-fold benefit of increasing specificity while reducing the likelihood that a mutation in the viral genome will result in false negatives. Unlike PCR, in which the specificity of detection is the result of the selective binding of primers to nucleic acid sequences followed by subsequent amplification, our approach in the viral microarray is to use random six-base nucleotide primers (random hexamers) to nonspecifically label the sample with amino allyl 2-deoxyuridine 5’-triphosphate, which then can be coupled to fluorescent dye molecules. These fluorescently labeled strands of nucleic acid then can be specifically detected using probes bound to the silica-based microarray.
Probe Design. Probes were designed using the OligoArray version 2.1 software available from http://berry.engin.umich.edu/oligoarray2_1/.
The probes were designed to conform to the following specifications:
- Maximum Temperature: 75°C (except for torovirus: 80°C)
- Minimum Temperature: 70°C (except for torovirus: 65°C)
- Maximum GC: 60%
- Minimum GC: 40%
- Maximum temperature for secondary structure: 45°C
- Maximum temperature for cross-hybridization: 45°C
Probes were designed from the positive strand of the genetic sequence. The local BLAST database against which the probes were compared is comprised of all the probe sequences in both positive- and negative-sense strands and also the sequences that showed a large degree of homology to nonspecific sequences as determined by a MEGABLAST search using the following criteria (database: nr; E value: 10; Wordsize: 11). This allowed the OligoArray software to filter out nonspecific gene sequences from the probes designed.
A total of 690 specific probes were designed targeting the 23 viral families (approximately 30 probes per viral family target). Generating multiple probes for each target family would enhance the reliability of detection.
Microarray Construction. An initial batch of three microarray chips was synthesized by the University of Michigan Engineering Machine Shop to specifications determined by Dr. Gulari. The microarray chip format used for the virus chip was a 68 by 119 array with a potential for containing a maximum of 8092 wells; 3054 wells were randomly populated with five copies of each of the 690 designed probes representing 42 percent of the chip capacity. Multiple copies of probes were used to provide technical replication of the signals.
Probes were synthesized in situ in an automated process similar to making oligonucleotides on a DNA synthesizer. The major difference in the process is the use of a photo-generated acid rather than an acid in the dimethoxytrityl (DMT) deprotection step to control the parallel synthesis. This deprotection is initiated by directing light at selected three-dimensional nano-chambers in microfluidic chips. In a synthesis cycle, upon light activation, acid forms in seconds, removing the DMT group. An incoming phosphoramidite nucleoside monomer then is coupled to the growing oligonucleotide chain. The synthesis cycle is repeated for each additional monomer until an array of thousands of oligonucleotides in a microfluidic chip is formed.
Arrays of oligonucleotides are made by in-situ coupling of DMT-protected nucleotide monomers at selected reaction sites according to the sequences of the oligonucleotides at each synthesis cycle. The process uses computer-generated light patterns to control a projection device (similar to a seminar presentation using a PowerPoint file), which in turn projects a light pattern onto the chip at each reaction cycle to create a specific chip reaction pattern. The localized light energy generates the photo-generated reagent allowing selective deprotection; only these deprotected sites couple with the incoming monomer.
These synthesis cycles are repeated to produce the desired oligonucleotide arrays. This digital photolithography process avoids the expensive and time-consuming photomasks used in conventional photolithographic processes and, more importantly, it enables flexibility and enhances efficiency for oligonucleotide array synthesis (Figure 4).
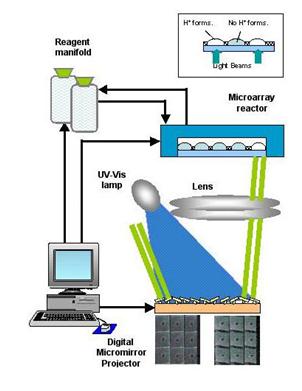
Figure 5. Light Beams From a UV-Vis Lamp is Controlled by a Microprocessor to Directed Portions of the Chip. Incidence of a light beam on a section of a chip causes the formation of acid ions that deprotect the site and allows probe elongation. Incremental addition of probe bases results in the synthesis of complete probes of desired length and base sequence.
Sample Processing. Viruses were extracted from cell culture supernatant by three quick cycles of freeze-thaw. The viruses were concentrated using an Amicon Ultra 100kTM ultrafiltration column (Millipore Inc., Billerica, MA ) following manufacturer’s instructions. Viruses were extracted using the Ultrasens Viral Nucleic Extraction kit from Qiagen, which extracts both viral RNA and viral DNA.
Viral nucleic acid extracts then were divided in half to be processed for RNA and for DNA viruses. RNA was labeled using a modified BioPrime labeling protocol and The Institute for Genomic Research microarray protocol (http://pga.tigr.org/sop/M004_1a.pdf). Briefly, between 2-5 μg of template RNA is used to generate a first strand cDNA molecule using reverse transcriptase and incubation at 45°C. Reverse transcriptase uses RNA as a template and synthesizes a complementary strand of DNA (complementary DNA). The synthesized cDNA strand then is coupled to N-hydroxysuccinimide (NHS)-ester cyanine (Cy) dye available from Amersham Biosciences.
DNA targets were generated in a manner similar to that used for RNA targets. However, the large fragment of the DNA polymerase I enzyme (Klenow fragment) was used instead of reverse transcriptase to generate the modified DNA daughter strands (Figure 5). Less template is required for DNA targets (between 0.5 and 1 μg of template DNA) and incubation is carried out at 37°C as opposed to 45°C. The modified DNA daughter strand then is coupled to NHS-ester Cy dye. Different colored Cy dyes are used to differentially label RNA and DNA targets.
The labeled DNA and RNA targets then were hybridized together or separately to the microarray. They can then be detected using a microarray scanner where they will fluoresce at their own specific wavelengths.
Microarray Hybridization. Microarray hybridization is performed using a Xeotronä microfluidic hybridization station. Hybridization is initially carried out at 20°C to allow the target DNA to bind to the probes on the chip for 16-18 hours. The array then is subsequently washed at 1°C incremental temperatures with a flow rate of 500 μl/minute for 1.4 minutes in the presence of hybridization wash buffer (10 mM Na2HPO4 5 mM EDTA pH 6.6). The microarray is scanned between each wash cycle to generate a melting curve.
Microarray Scanning and Data Collection. Microarray scanning is carried out using the GenePix 4000B Microarray Scanner (Molecular Devices Inc., Sunnyvale, CA ). The software used to analyze the scanned images was Genepix Pro 5.0. Data were collected and normalized using filters built into the software. Data then were graphed using the Microsoft Excel spreadsheet program.
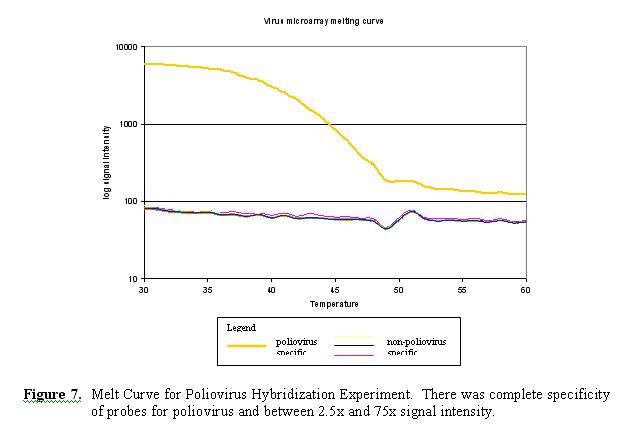
Initial Results. Preliminary results were obtained for the hybridization of labeled poliovirus LSC-1 to the viral microarray. The 30 probes generated for poliovirus were found to be completely specific (30/30 hybridization). There was no significant cross hybridization with nonpoliovirus probes (0/660) throughout the melting curve temperature range (25°C - 60°C). Signal intensities for poliovirus specific probes were between 2.5 to 75 times greater than non-poliovirus probes within the 30°C - 48°C temperature range (Figure 6). Two additional repeat hybridizations generated similar results.
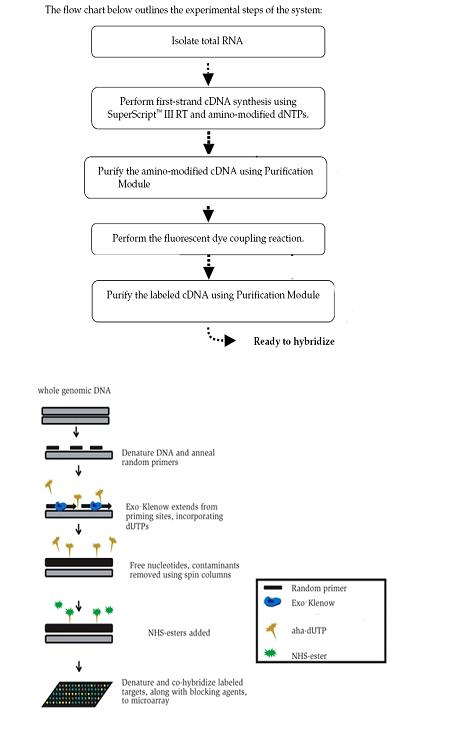
Figure 6. Top: Experimental Steps for the Labeling of RNA Targets to be Hybridized to the Array. Bottom: Experimental Steps for the Labeling of DNA Targets to be Hybridized to the Array.
References:
Li, X.; He, Z.; Zhou, J. (2005) Selection of optimal oligonucleotide probes for microarrays using multiple criteria, global alignment and parameter estimation. Nucleic Acids Research, 33 (19), 6114-6123.
Miller, S.M.; Tourlousse, D.M.; Stedtfeld, R.D.; Baushke, S.W.; Herzog, A.B.; Wick, L.M.; Rouillard, J.M.; Gulari, E.; Tiedje, J.M.; and Hashsham, S.A. (2007) An In-situ Synthesized Virulence and Marker Gene (VMG) Biochip for the Detection of Bacterial Pathogens in Water. Manuscript in revision (submitted to Applied and Environmental Microbiology).
Stedtfeld, R.D.; Baushke, S.; Tourlousse, D.; Chai, B.; Cole, J.R.; Hashsham, S.A. (2007) Multiplex approach for screening genetic markers of microbial indicators. Water Environment Research, 79 (3): 260-9. Stedtfeld, R.D.; Wick, L.M.; Baushke, S.W.; Tourlousse, D.M.; Herzog, A.B.; Xia, Y.; Rouillard, J.M.; Klappenbach, J.A.; Cole, J.R.; Gulari, E.; Tiedje, J.M.; Hashsham, S.A. (2007) Influence of dangling ends and surface-proximal tails of targets on probe-target duplex formation in 16S rRNA gene-based diagnostic arrays. Applied and Environmental Microbiology, 73 (2): 380-9.
Zuckerman, U.; Armon, R.; Tzipori, S.; Gold, D. (1999) Evaluation of a portable differential continuous flow centrifuge for concentration of Cryptosporidium oocysts and Giardia cysts from water. Journal of Applied Microbiology, 86 (6), 955-961.
Zuckerman, U.; Tzipori, S. (2006) Portable continuous flow centrifugation and method 1623 for monitoring of waterborne protozoa from large volumes of various water matrices. Journal of Applied Microbiology, 100 (6), 1220-1227.
Journal Articles:
No journal articles submitted with this report: View all 14 publications for this projectSupplemental Keywords:
RFA, Health, Scientific Discipline, PHYSICAL ASPECTS, Water, Ecosystem Protection/Environmental Exposure & Risk, Environmental Chemistry, Health Risk Assessment, Risk Assessments, Monitoring/Modeling, Environmental Monitoring, Physical Processes, Drinking Water, microbial contamination, monitoring, measurement , microbial risk assessment, biochip, microbiological organisms, detection, exposure and effects, virulence factor activity relationships, virulence factor biochip, bacteria monitoring, exposure, other - risk assessment, E. Coli, human exposure, microbial risk management, microorganism, measurement, assessment technology, drinking water contaminants, other - risk managementProgress and Final Reports:
Original AbstractThe perspectives, information and conclusions conveyed in research project abstracts, progress reports, final reports, journal abstracts and journal publications convey the viewpoints of the principal investigator and may not represent the views and policies of ORD and EPA. Conclusions drawn by the principal investigators have not been reviewed by the Agency.