
Grantee Research Project Results
Final Report: Effective Strategies for Regional Packaging Reuse Systems
EPA Contract Number: 68HERC23C0029Title: Effective Strategies for Regional Packaging Reuse Systems
Investigators: Senesky, Matthew
Small Business: Iterant, Inc.
EPA Contact: Richards, April
Phase: I
Project Period: December 1, 2022 through May 31, 2023
Project Amount: $99,889
RFA: Small Business Innovation Research (SBIR) Phase I (2023) RFA Text | Recipients Lists
Research Category: SBIR - Water , SBIR - Homeland Security , SBIR - Sustainability , SBIR - Air and Climate
Description:
This project investigated technology-enabled strategies for regional plastic packaging reuse systems. Iterant has implemented an online marketplace for reused packaging that provides economic incentives for key stakeholders in the packaging lifecycle. We sought to demonstrate that this platform can deliver profitable reuse models for these stakeholders, and can thereby be scalable and self-sustaining.
The overall objective of the research was to assess the feasibility of a for-profit, open reuse system, in which reusable packaging can be collected and resold by any company or organization, and need not return to the same reseller or the same buyer each time. We chose to focus the study on a specific set of products: the rHDPE “can carriers” that have become a quasi-standard in the craft brewing industry as secondary packaging for 4- and 6-packs of aluminum cans. These products are an excellent use case, as they are durable and relatively easy to collect and process.
The technical portion of the research focused on recovery cost reduction. Prior work identified manual quality inspection and collection logistics as the most costly steps in the recovery process, hence these were two main areas of technical focus. In pursuit of reduced inspection costs, we engaged with a mechanical design firm to create a custom test fixture. A series of designs were evaluated for speed and accuracy.
In order to reduce collection logistics costs, we created a tool to compare collection timing and route options, to roughly optimize trip economics. A spreadsheet-based tool was developed using Google Sheets that provides for route selection, route costing (via calls to Google Maps to return the distance and time of each leg of the trip), and volume projection, which uses historical collection data to estimate collection quantity for each site. The total quantity is then used along with the total cost to calculate the average cost per piece for the trip.
Our commercial objectives were focused on growing the business and reducing costs. Growth serves two purposes – to demonstrate and validate demand for the product, as well as to reduce costs through economies of scale. Expanding on our existing store drop-off model, we recruited additional retail locations, including brewery taprooms, bars, liquor stores, refill stores and grocery stores. We sought to increase consumer returns to these sites with marketing activities including social media promotions and attractive, informative collection bins. We attempted to recruit partners in traditional logistics and waste management businesses to provide higher volumes of materials than individual retail sites could provide.
To document our overall cost reductions, we implemented a data logging tool using Google Forms that captured key data for each step of our collection, processing and distribution activities. This tool was used by employees in real time as they performed tasks. This data was then used to calculate COGS reductions under various scenarios.
Summary/Accomplishments (Outputs/Outcomes):
Results for the mechanical test fixture were mixed. Accuracy and speed results for the 5 operational prototypes are shown in Table 1. Speed was improved over manual inspection by more than a factor of 2, meeting our objective of 3 seconds per piece, but accuracy suffered. Of the 5 prototypes tested, v4.0 represents a reasonable tradeoff of speed for accuracy, being only a factor of 2 less accurate than manual inspection. However, future work can likely improve accuracy.
Table 1: test fixture results. “False negative” refers to pieces that tested as broken, but were found to be unbroken upon reinspection. “False positive” refers to broken pieces that tested as unbroken. Note that the given percentage rates refer to the percentage of pieces of that type. So if out of 100 known broken pieces, 10 return a test result of unbroken, the false positive rate would be 10%.
| Prototype | Throughput [sec/pc] | False Negative [%] | False Positive [%] |
|---|---|---|---|
| Manual | 7.00 | 0.00 | 10.6 |
| v2.0 | 3.26 | 14.4 | 100 |
| v2.1 | 2.88 | 4.03 | 25.0 |
| v3.0 | 2.49 | 0.00 | 83.3 |
| v3.1 | 2.50 | 0.22 | 45.0 |
| v4.0 | 2.78 | 0.00 | 21.4 |
To study reduction of collection costs, four collection scenarios were modeled using the route planning tool described above for each of 5 geographic areas in Northern California (East Bay, Sacramento, San Francisco, Santa Cruz and Santa Rosa), using the following assumptions:
Scenario A1: When any bin in an area is 100% full, collect from all bins in the area and bring to headquarters for processing.
Scenario A2: When any bin in an area is 100% full, collect from bins in the area that have at least 100 pieces, and avoid intermediate legs longer than 20 minutes. Bring material to headquarters for processing.
Scenario A3: Same as scenario A1, but assume material is brought to a local area processing facility. Scenario A4: Same as scenario A2, but assume material is brought to a local area processing facility.
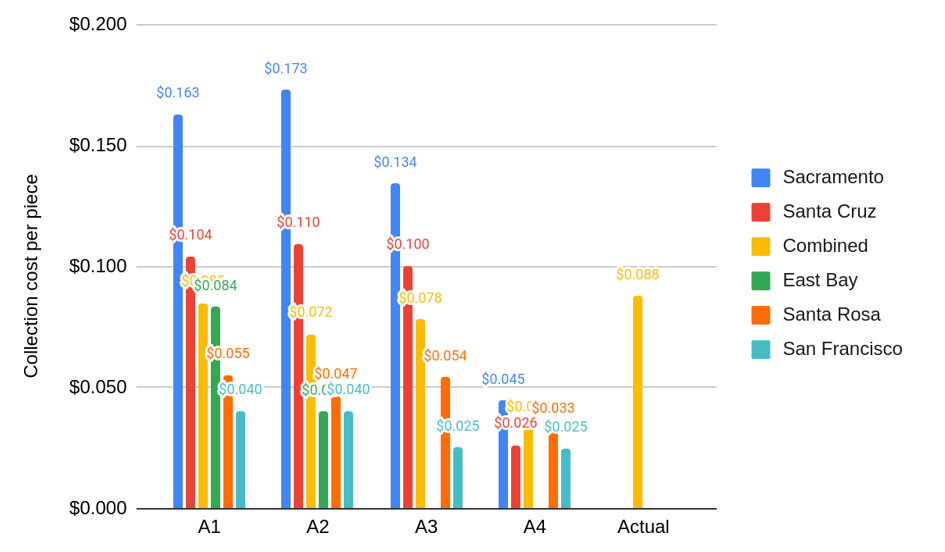
Figure 1: collection cost for various strategies and geographic areas.
The results of this analysis are shown in Figure 1. As expected, areas that are distant from our headquarters (Sacramento, Santa Cruz) have high collection costs in scenarios A1 and A2. Scenario A3 is relatively similar to A1 and A2 because these areas are large and collection locations are sparse. San Francisco fares well in all scenarios due to its density. Scenario A4 is attractive for all geographic areas, reflecting the shorter distance of an assumed local processing facility as well as the flexibility to visit only high-value sites. We note also that the combined data collected over the past 6 months (labeled “Actual”), which in practice was a mix of A1 and A2, matches well with the projected combined values for these scenarios, demonstrating that the model results are well calibrated.
Our recruitment efforts to increase collections initially focused on recruiting brewery taprooms to host our collection bins, and had a strong response that led to gains in the early months of the program. We subsequently began reaching out to liquor stores, bars, and refill shops, all of which showed moderate adoption rates as host sites. In the second half of the program we began to focus on recruiting grocery stores, which were generally not receptive to participation.
The most common reason cited was lack of space. During the program overall we expanded from 16 to 70 locations, reaching 46% of our expansion target. Collection volumes grew correspondingly, with a 4-6 week lag for collection bins to fill. Total collection during the program was 36,417 pieces, of which 20,407 have been resold to date.
In the process of characterizing our costs, we collected 854 entries to our data logging form. Combined with the results from our technical activities, we were able to project a path to viable unit economics. Figure 2 shows the potential impact of cost reduction measures (faster inspection and proposed localized processing), as well as the assumption of combined collection and delivery and a 25% increase in material collected from existing sites, on our baseline COGS. Under these conditions we project meeting our target of $0.074 per piece. With a sales price of $0.12, we would achieve a 38% gross margin, which compares favorably with a typical packaging industry value of 22.8%.
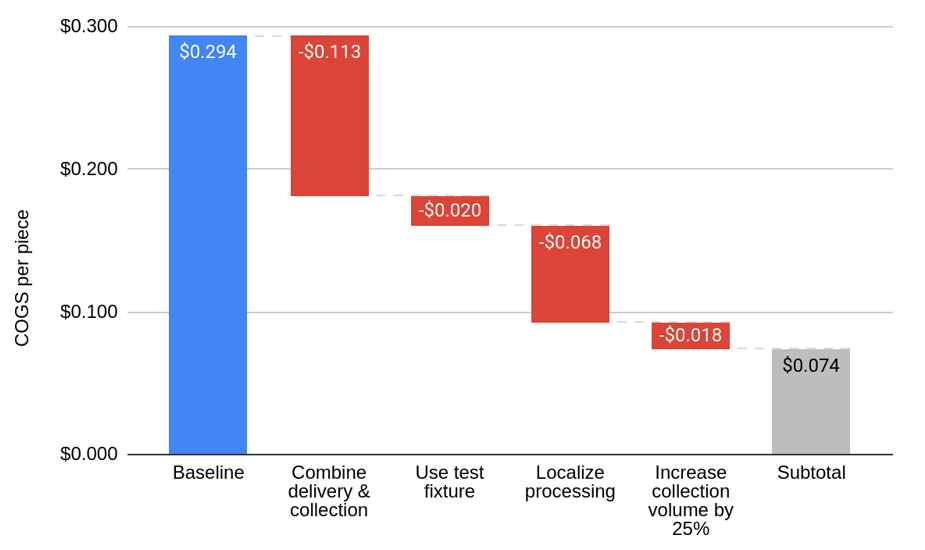
Fig. 2: components of COGS reduction.
Conclusions:
The research shows a path to feasibility of an open, for-profit system for reuse of post-consumer plastic packaging. In this system, packaging items can be freely collected by independent resellers, and resold locally to minimize logistics costs. A network of these independent resellers, across many local and regional geographic areas, dealing in a wide array of products, and mediated by a central marketplace platform, can form the basis of a scalable and self-sustaining nationwide packaging reuse system.
We offer the following recommendations and caveats for further development of this system. The density of collection – i.e. the amount of material collected per mile driven – must be higher than we have achieved to date. In addition to partnerships with logistics companies, and the micro-scale local processing facilities proposed by assumption A4 above, a logical and compelling strategy would be to collect and resell additional types of packaging. Items like bubble wrap and gel freezer packs would fit well into this approach.
The perspectives, information and conclusions conveyed in research project abstracts, progress reports, final reports, journal abstracts and journal publications convey the viewpoints of the principal investigator and may not represent the views and policies of ORD and EPA. Conclusions drawn by the principal investigators have not been reviewed by the Agency.