
Grantee Research Project Results
Final Report: Valuing Water Quality Improvements in Nationwide Ecosystems: Total Value Based on the Biological Condition Gradient
EPA Grant Number: R840465Title: Valuing Water Quality Improvements in Nationwide Ecosystems: Total Value Based on the Biological Condition Gradient
Investigators:
Institution:
EPA Project Officer:
Project Period: September 1, 2022 through May 2, 2025
Project Amount: $741,864
RFA: Water Quality Benefits (2022) RFA Text | Recipients Lists
Research Category: Water Quality , Water
Objective:
This project aimed to measure the economic value of surface water quality improvements in ecoregions across the continental US. The goal was to field both stated preference (SP) and revealed preference (RP) surveys that would measure values using the Biological Condition Gradient (BCG) as the water quality metric. The BCG is an ordinal index that summarizes the biological health of a waterbody based on the extent of degradation beyond its natural state. The BCG is designed to be spatially portable, rating the extent of degradation relative to natural conditions for the local ecological features. To meet the project goals, we planned to carry out the following objectives:
Objective 1 (Assemble BCG Data): Assemble data and develop models needed to measure baseline BCG levels at the 8-digit hydrological unit code (HUC8) in our study and policy simulation regions.
Objective 2 (Determine Study Areas): Identify a set of watersheds to study that span US ecoregions and are ecologically, geographically, and demographically representative of waterbodies and populations in the country, including areas underrepresented in valuation research.
Objective 3 (Communicate Water Quality): Design communication and presentation strategies for translating ecological concepts specific to BCG levels in our set of river basins into commodity descriptions suitable for use in SP surveys.
Objective 4 (SP Survey): Field a large scale, online SP survey that focuses on our nationwide sample of watersheds and implements our BCG valuation approach across ecologically and socio-economically diverse locations.
Objective 5 (RP Data): Construct an auxiliary data gathering module that enables assembly of RP recreation data in conjunction with the SP data or as a standalone survey vehicle.
Objective 6 (Benefit Estimation): Use our SP and RP data to construct benefit functions to represent use-based and total values for changes in aquatic ecosystem quality at locations across the country, conditional on household characteristics.
Objective 7 (Integrated Assessment Model): Integrate the new benefit functions into a national IAM framework to consider the efficiency and environmental justice consequences of potential policy actions.
Summary/Accomplishments (Outputs/Outcomes):
Because the project was terminated, we do not have findings to summarize. Instead, we describe accomplishments from when the project was active.
For objective 1, we worked with dozens of state agencies to assemble biological sampling data from as many locations as possible. We ultimately assembled 80,185 biological samples from 60,778 sample sites, taken between 2000 and the present. We used the raw data to compute a BCG score for each sampled site and then averaged them at the HUC8 level to characterize water quality in the landscape. The map below shows average BCG scores at the HUC8 level for all watersheds that had at least one sample site.
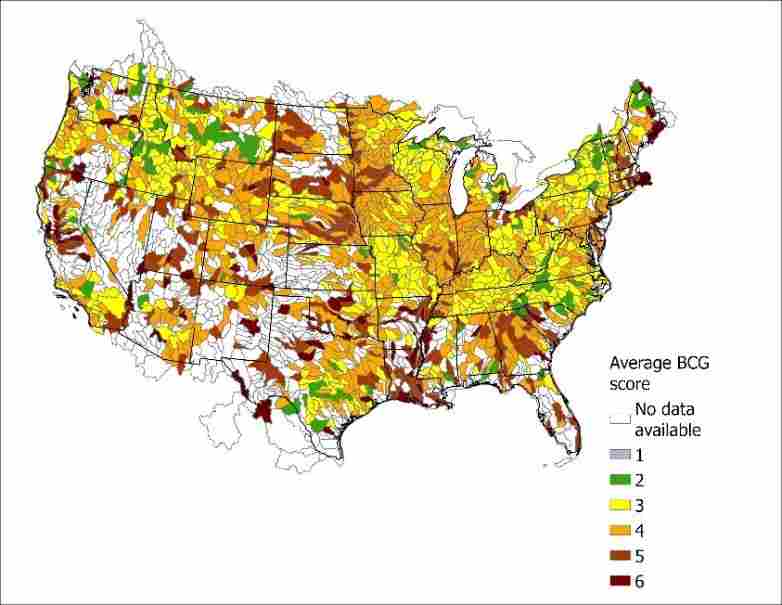
The distribution of BCG scores was to provide a characterization of baseline water quality conditions for subsequent fielding of our stated preference survey.
For objective 2, we assembled spatial data at the HUC4 and HUC8 level to visualize the joint spatial distribution of water quality (BCG scores) and population. We were in the process of selecting a set of HUC4 watersheds that would span ecoregions, different baseline water quality levels, and urban/rural populations. These were to be the study areas – the places we would concentrate sampling for our survey.
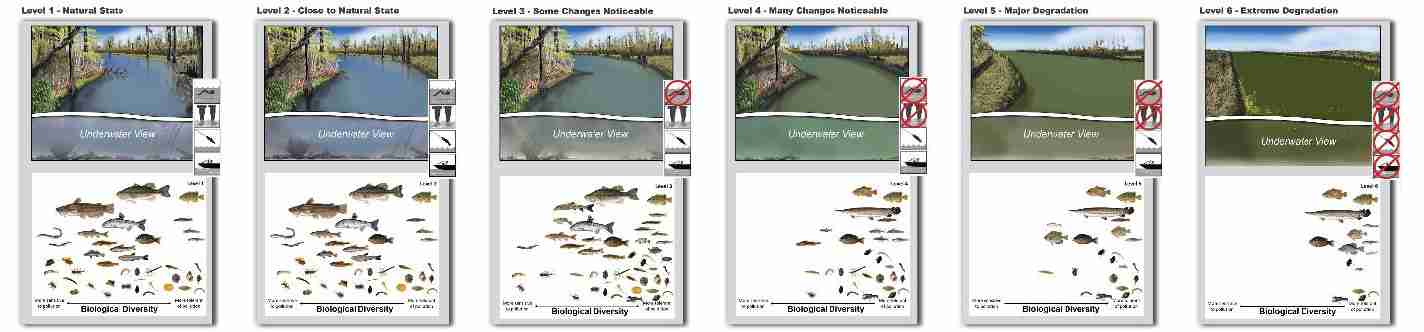
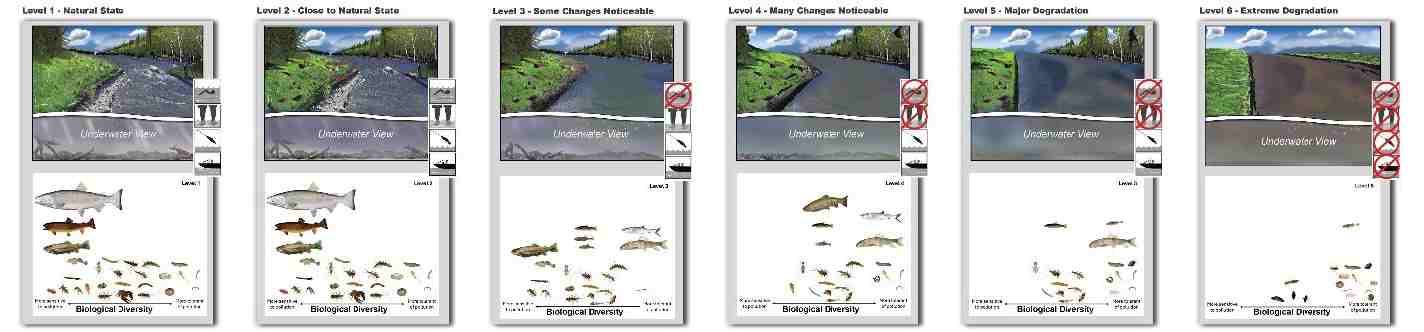
For objective 3, we designed communication strategies to convey lay-accessible information about BCG levels in each ecoregion. During the project we engaged with a graphic designer to construct visual representations that are ecoregion and BCG level specific and grounded in ecological concepts. Prior to termination, we had completed polished drafts of graphics for five ecoregions. Examples of BCG gradients for the Southeast and Northwest are displayed below.
Southeast
Northwest
For objectives 4 and 5, we completed substantial technical work programming Qualtrics (a software product for fielding online surveys) to (a) dynamically display maps showing local water quality conditions conditional on zip code; and (b) enable respondents to indicate via point and click on a dynamically generated map where they visited for recreation. These innovations were to be featured in the SP and RP surveys that were scheduled for fielding prior to termination. Objectives 6 and 7 were to be completed after the survey data was available.
There are no publications or presentations. Data gathering was staged but not executed at the time of termination.
Supplemental Keywords:
Biological condition gradient, nonmarket valuation, water quality, stated preference, revealed preference, surveyProgress and Final Reports:
Original AbstractThe perspectives, information and conclusions conveyed in research project abstracts, progress reports, final reports, journal abstracts and journal publications convey the viewpoints of the principal investigator and may not represent the views and policies of ORD and EPA. Conclusions drawn by the principal investigators have not been reviewed by the Agency.