
Grantee Research Project Results
Final Report: Continuous Quantitative Methane Emission Monitor With Vent Discrimination
EPA Contract Number: 68HERC22C0014Title: Continuous Quantitative Methane Emission Monitor With Vent Discrimination
Investigators: Frish, Michael B.
Small Business: Physical Sciences Inc.
EPA Contact: Richards, April
Phase: I
Project Period: December 1, 2021 through May 31, 2022
Project Amount: $99,974
RFA: Small Business Innovation Research (SBIR) Phase I (2022) RFA Text | Recipients Lists
Research Category: SBIR - Air , Small Business Innovation Research (SBIR)
Description:
This project aspires to demonstrate an innovative methane continuous emission monitor that combines our easily-installed high-speed laser-based long-open-path sensor, the Remote Emissions Monitor (REM), with our unique and novel fast laser beam scanning mechanism to create "flux planes" along tank battery perimeters. The resulting Enhanced REM (eREM) continuously measures and reports methane emission rates from oil and gas production site storage tanks. The eREM directly measures emission rates (e.g. scfh) of methane plumes transported through the flux plane at ~1 Hz without need for plume modeling. Its temporal resolution enables novel statistical data processing that identifies routine vents and distinguishes them from unintended emissions (leaks).
Benchmarking the technology's performance and effectiveness is essential for customer acceptance and market development. This project is intended to help overcome these barriers to market entry and commercialization. The Phase I project objective was to evaluate the accuracy and precision, as well as commercial potential, of the innovative sensor system, thus testing the hypothesis that the sensor system can meet the Key Performance Characteristics listed in Table ES-1.
Table ES-1. Key Performance Characteristics
| Configuration | Long-open-path laser-based quantitative continuous monitor. System comprises: 1) an optical engine co-mounted with control electronics, power source, and wireless communications; 2) one or more scattering targets mounted at the distal end of the measurement path |
| Leak Rate | 1- 100,000 scfh |
| Leak Rate Accuracy | +/- 20% of reading |
| Leak Rate Measurement Frequency | 1 Hz |
| Vent vs. Leak | Identifies and reports routine vent emissions in addition to fugitive emissions |
| Installation | Transceiver(s) and target(s) elevated on poles along storage site fenceline. Multiple units may surround the site perimeter. Commercial product to be user-installed, requiring fewer than 8 hours following manufacturer instructions. |
| Installation Time | <8 person-hours |
| Power | Local AC, solar, wind |
| Communication | Wireless via cellular or satellite for data transmission to cloud and remote diagnostics |
| Data Protocol | Commercial product will report data in industry standard format |
| Product Costs | <$10,000 per unit |
The project pursued six Tasks:
1. Design Flux Plane Configuration
2. Build Enhanced REM
3. Install and Evaluate Enhanced REM
4. Develop algorithms for leak vs vent
5. Write business plan with commercial product concept
6. Report project outcomes
Summary/Accomplishments (Outputs/Outcomes):
Tasks 1-3:
We integrated a fast laser scanner with our electro-optical engine installed within a handheld battery-powered package. We programmed the unit for linear scanning to create the flux plane. We installed the unit on a portable cart and utilized an outdoor building wall as the backscatter target. Set-up time is approximately 15 minutes. The flux plane horizontal path length was 30 ft. Its vertically-scanned vertex angle was +/- 4 deg relative to centerline, thus creating a 4 ft vertical edge where it intercepts the wall. To create a leak source, methane was piped from a compressed gas cylinder through a pressure regulator, needle valve, rotometer, and polyethylene tubing to a sandbox wherein the open tube end is buried The sandbox was located 5 ft horizontally from the flux plane, 5 ft from the wall, a) at ground level and b) 2.25 ft above ground. Leak rate was set at 20 scfh. Wind vector was measured by the anemometer.
Data acquired with the sandbox at ground level are presented in the figure below. At top are measured path-integrated concentrations (ppm-m) represented by color code - lighter blue represents higher ppm-m. Each vertical line (Sweep #) represents 35 pixels of the flux plane. Sweep# represents time, 35 msec per sweep. The 1700 sweeps are collected in one minute. The red point in each sweep is the average ppm-m. The initial 30 seconds shows background methane as 50 ppm-m. Subsequent data show elevated methane emanating from the emission source and blowing through the flux plane. The middle and bottom graphs show the wind vector and emission flux vs time. The standard deviation, averaged over the initial 10 s (283 sweeps) of ppm-m measurements for the 35 pixels in each sweep, is 0.56 ppm-m. The standard deviation of average ppm-m within a 1 sec window is 3.14 ppm-m. For a steady wind, this corresponds to a flux (leak rate) precision of 0.26 scfh.
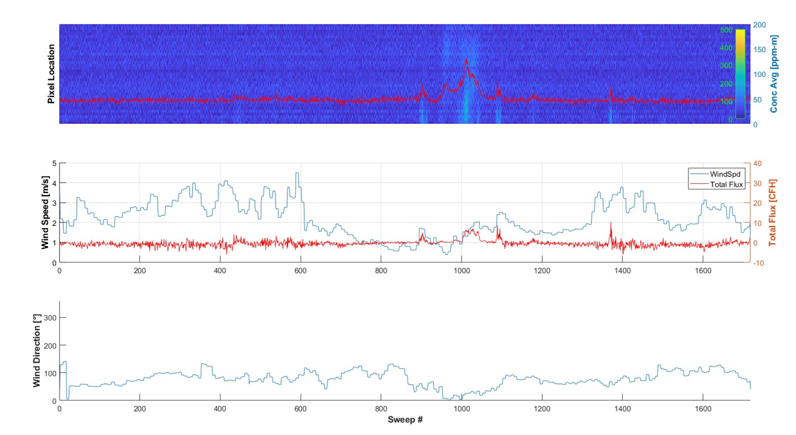
Data acquired with the sandbox at ground level
Task 4:
In this Phase I effort, we developed an algorithm that continually processes temporal segments of the REM data and computes their spectra. We processed REM data acquired prior to this project to quantitatively analyze visibly obvious changes in the REM signal temporal spectra resulting from the periodicity of vents compared to spectra during intervals of only leaks or no emissions. Our goal is to automate the real-time process of recognizing leak and vent signatures and discriminating between them. Our algorithm further selects a few quantitative features within the spectra that, based on their values, appear to be indicative of leaks and vents.
Task 5:
Working with TABA Foresight Science and Technology, we selected the a) Expert and End-User Outreach, and b) Preparation of Marketing Material services. The Foresight report includes a draft product description intended for distribution to and feedback from potential Phase II industrial collaborators.
We wrote a commercialization business plan in the form of a project proposal to advance the REM technology to mass production of out-of-the-box low-cost products. The plan describes our strategy for expanding the business to support manufacture and sale of >10,000 units annually.
Conclusions:
The Phase I project was successful. It affirmed the hypothesis that the sensor system can meet the Key Performance Characteristics listed in Table ES-1. Task 3 demonstrated the remarkable ability to detect and quantify emissions smaller than 0.5 scfh, comparable to a gas appliance pilot light flow rate. Task 4 identified quantified features in emission data that appear to enable discriminating between leaks and vents. These results encourage continued progression to optimize the algorithms and install then in operational REM units. This will be a key Phase II effort. Task 5 generated a viable business plan to be pursued.
This project focuses on deploying the eREM for monitoring natural gas storage sites. However, applications for eREM extend well beyond storage facilities. With over 825,000 active natural gas wellheads, gathering, and storage sites in North America, the potential market for upstream monitoring and emissions quantification exceeds tens of thousands of units per year. The urgency of complying with current and emerging federal and state regulations to reduce methane emissions is driving customers to begin deploying this technology in earnest before 2025 at costs <$10k per unit. Our commercialization business plan addresses this urgency. In addition, during the course of Phase I, we have been presented with additional applications and near-term commercial opportunities for eREM including measuring bovine methane emissions from cattle pens, temporary installations to identify intermittent leakage from abandoned wellheads, and measuring landfill emissions. PSI is actively pursuing these opportunities.
The perspectives, information and conclusions conveyed in research project abstracts, progress reports, final reports, journal abstracts and journal publications convey the viewpoints of the principal investigator and may not represent the views and policies of ORD and EPA. Conclusions drawn by the principal investigators have not been reviewed by the Agency.