
Grantee Research Project Results
2022 Progress Report: Evaluating agricultural management practices benefiting the Monterey Bay: reducing nutrient loads and Harmful Algal Bloom (HAB) events
EPA Grant Number: R840083Title: Evaluating agricultural management practices benefiting the Monterey Bay: reducing nutrient loads and Harmful Algal Bloom (HAB) events
Investigators: Clark, Ross , Bowers, Holly
Current Investigators: Bowers, Holly , O'Connor, Kevin , Clark, Ross
Institution: San Jose State University
Current Institution: San Jose State University , Moss Landing Marine Labs
EPA Project Officer: Ludwig-Monty, Sarah
Project Period: September 1, 2020 through April 28, 2025
Project Period Covered by this Report: September 1, 2021 through August 31,2022
Project Amount: $999,999
RFA: Approaches to Reduce Nutrient Loadings for Harmful Algal Blooms Management (2020) RFA Text | Recipients Lists
Research Category: Harmful Algal Blooms , Water
Objective:
The proposed project will demonstrate the effectiveness of farm runoff treatment systems in reducing nutrient discharges to coastal waterways and provide a blueprint for scaling-up treatment systems within two key agricultural watersheds of the Monterey Bay, CA. In addition, this project will examine the potential link between agricultural nutrient discharges and the growth of harmful algal blooms (HABs).
Progress Summary:
HAB Culturing. The bulk of work at EBL during 2022 has focused on 1) mesocosm experiments and 2) sampling in Monterey Bay. We have been working with established cultures of two toxin-producing algal bloom species common to Monterey Bay: Pseudo-nitzschia multiseries (diatom) and Alexandrium sp. (dinoflagellate). Two large mesocosm experiments, one with each species, have now been completed. EBL has a new incubator to support small flask experiments that help guide the larger mesocosm work. There is a dedicated room with grow lights and infrastructure for nine bags that hold up to 15L each to allow for mesocosm-scale work. In September we started participating in a long-standing monthly cruise transect (Watsonville Wastewater Treatment Plant; WWTP) offshore of the Pajaro River mouth.
Subwatershed Nutrient loading: CCWG has completed a second year of nutrient load monitoring for the two focus watersheds and documented load reduction capacity of a number of nutrient treatment systems. Specifically: CCWG has quantified Pajaro and Salinas sub-watershed loading of various nutrient constituents for spring and fall for 2021 and 2022 for 4 subwatersheds in the Pajaro and 5 subwatersheds in the Salinas (Table 1). Field equipment that was damaged has been repaired or replaced and is functioning properly, but some subwatershed load data were lost.
| Site | Year | Season | Nutrient | Concentration (mg/L) | Discharge (L/s) | Monthly Loading (kg/mo) |
| PR1 | 2021 | Spring | DIN | 4.3 | 77.7 | 831.1 |
| PR1 | 2021 | Fall | DIN | 21.9 | 0.8 | 43.0 |
| PR3 | 2021 | Spring | DIN | 0.2 | 44.2 | 19.0 |
| PR3 | 2021 | Fall | DIN | 0.3 | 0.1 | 0.1 |
| PR4 | 2021 | Spring | DIN | 2.0 | 57.1 | 355.9 |
| PR4 | 2021 | Fall | DIN | 3.2 | 14.5 | 123.6 |
| PR5 | 2022 | Spring | DIN | 11.9 | 3.6 | 124.0 |
| SR1 | 2021 | Spring | DIN | 6.6 | 100.8 | 1774.7 |
| SR2 | 2022 | Spring | DIN | 25.0 | 0.4 | 21.2 |
| SR3 | 2021 | Spring | DIN | 8.8 | 76.1 | 1770.4 |
| SR4 | 2021 | Spring | DIN | 6.4 | 61.5 | 1029.3 |
| SR4 | 2021 | Fall | DIN | 25.6 | 3.3 | 215.0 |
| SR4 | 2022 | Spring | DIN | 46.3 | 25.7 | 3021.6 |
Table 1. Seasonal Loading estimates for subwatersheds of the Pajaro River (PR) and Salinas River (SR) watersheds.
Nitrate reduction of treatment systems: Nutrient reduction rate estimates of the various water quality treatment systems are underway. Field collection and lab analysis techniques have been perfected and concentration data from various treatment systems is being generated accurately (0.1-3% corresponding replicates).
| Treatment System | Source | Avg. Nitrite (mg/L) | Avg. Nitrate (mg/L) | Avg. Ammonia (mg/L) | Avg. Urea (mg/L) | Avg. DIN (mg/L |
| Molera Triangle | Inlet | 0.094 | 27.176 | 0.093 | 0.024 | 17.363 |
| Molera Triangle | Outlet | 0.098 | 4.622 | 0.021 | 0.013 | 4.741 |
| Bryant Haybert Bioreactor | Inlet | 0.006 | 15.044 | 0.008 | 0.021 | 15.058 |
| Bryant Haybert Bioreactor | Outlet | 0.621 | 3.900 | 0.023 | 0.037 | 4.543 |
| Seamist Bioreactor | Inlet | 0.313 | 56.446 | 1.084 | 0.034 | 57.836 |
| Seamist Bioreactor | Outlet | 0.339 | 39.192 | 0.409 | 0.028 | 39.927 |
| Seamist Wetland | Inlet | 0.324 | 34.302 | 0.123 | 0.021 | 34.744 |
| Seamist Wetland | Outlet | 0.088 | 26.182 | 0.183 | 0.028 | 26.451 |
| Castroville Wetland | Inlet | 1.003 | 18.815 | 5.303 | 0.051 | 25.122 |
| Castroville Wetland | Outlet | 0.012 | 0.003 | 3.493 | NA | 3.501 |
Table 1. Nitrogen species reductions within 5 different treatment systems within the Pajaro and Salinas Valleys.
Both Woodchip Bioreactors and Treatment Wetlands reduced Nitrate and Ammonia concentrations from source water (Error! Reference source not found.). Nitrite concentrations were reduced in treatment wetlands but not the woodchip bioreactors (due to low DO concentrations limiting nitrification) and Urea was unchanged within all systems. Total DIN concentrations were reduced significantly within all treatment systems. Rate of reduction will be correlated with ambient temperature and residence time to generate treatment system specific nitrate reduction rates.
HAB response to treatment systems: Once the mesocosm infrastructure logistics were finalized, we performed a series of experiments to determine the optimal concentration of cells for each species to spike into bags. Early flask experiments guided us towards testing both species in mesocosms containing 85% filtered seawater + 15% freshwater (three control bags [Carmel River, clean water source], three bags with PRE-treated water from the Sea Mist bioreactor site, and three bags with POST-treated water from the same site).
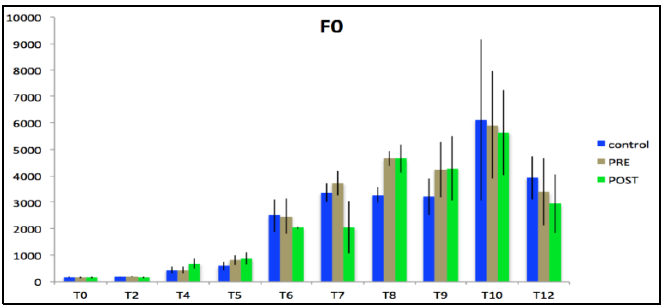
Figure 1. F0 (a measure of biomass) for a mesocosm experiment performed over a 12-day period with toxic Alexandrium sp.
Receiving water quality sampling: Receiving water monitoring arrays have been installed in the four primary agricultural watersheds discharging to the Monterey Bay. Each system (Pajaro, Moro Cojo, Tembladero & Old Salinas River) is functioning well to quantify hourly nitrate load to the Monterey Bay. The Pajaro system became operational in September 2022 after equipment supply chain delays. Initial nitrate loading estimates vary throughout the tidal cycle with greatest loading to the bay during low tides. Hourly loading ranges significantly among seasons and watersheds.
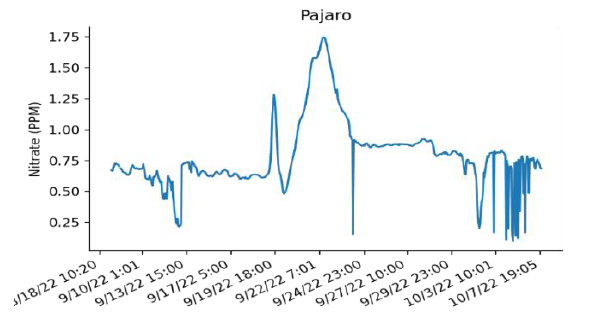
Figure 2. Pajaro River nitrate concentrations in September 2022. These data will be correlated with USGS flow gauge to calculate loading.
Future Activities:
We will investigate how the increase in temporal resolution of loading estimates will help document reductions in receiving water nitrate load due to individual management practices implemented within the watershed.
Journal Articles:
No journal articles submitted with this report: View all 1 publications for this projectProgress and Final Reports:
Original AbstractThe perspectives, information and conclusions conveyed in research project abstracts, progress reports, final reports, journal abstracts and journal publications convey the viewpoints of the principal investigator and may not represent the views and policies of ORD and EPA. Conclusions drawn by the principal investigators have not been reviewed by the Agency.