
Grantee Research Project Results
Final Report: Saving Water Using a Stages of Change Model with Smart Technology
EPA Grant Number: SU839273Title: Saving Water Using a Stages of Change Model with Smart Technology
Investigators: Telenko, Cassandra
Institution: Georgia Institute of Technology
EPA Project Officer: Page, Angela
Phase: I
Project Period: November 1, 2017 through November 30, 2018
Project Amount: $14,995
RFA: P3 Awards: A National Student Design Competition for Sustainability Focusing on People, Prosperity and the Planet (2017) RFA Text | Recipients Lists
Research Category: P3 Awards , P3 Challenge Area - Sustainable and Healthy Communities , Sustainable and Healthy Communities
Objective:
Background and Problem Definition
People are looking to be healthier and more sustainable versions of themselves, and technology is taking an increasing role in coaching and guiding people in bettering themselves. The self-help industry, including apps and devices, was estimated at $10 billion in 2016 and grows 4-6% annually according to Marketdata Enterprises. Most of the devices and apps currently available operate on a performance-focused paradigm that lets a user know how many steps they took or how much energy they saved. None of these devices or algorithms have realized the opportunity to replace expensive personal coaching by implementing a training-focused paradigm. We have merged the approaches of evidence-based coaching and sensing and computing to develop a first of its kind training-focused device for water conservation that gives feedback based on the trans-theoretic model of behavior change. Initial results yielded double the improvement in user behavior compared to a performance-based device.
Better coaching in water conservation is important because about 10% of the global population (700 million people) does not have access to clean water. Americans, as a nation, use about 99 gallons per person per day at home, over 5 times the amount “necessary to lead a comfortable life; about 13 gallons a day per person, as posited by Peter Glieck [1], [2]. A device that teaches and reinforces conservations behaviors could reduce demands on (and the resultant pollution from) water treatment facilities and infrastructure by providing real-time usage feedback, as well as tips and information about water usage and conservation. This EPA P3 project aimed to develop and test a novel, phasic behavioral feedback device for water conservation in-home. A prototype developed in 2016-2017 is shown in Figure 1.
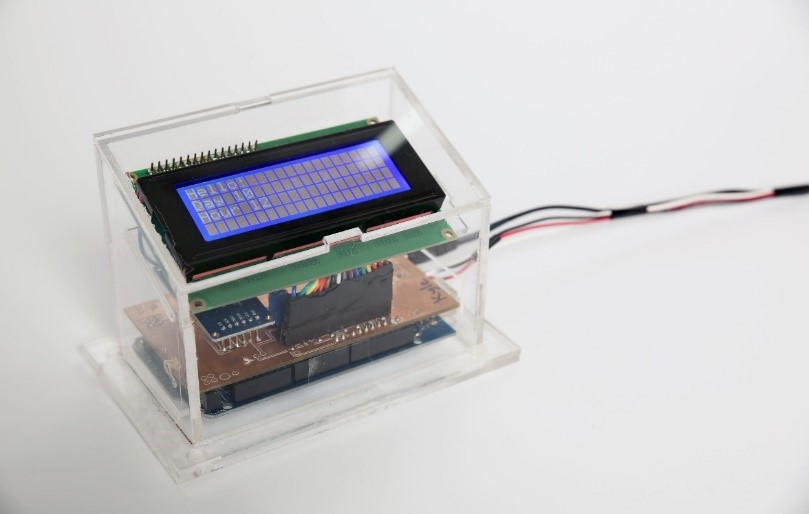
Figure 1: Prototype device used in pilot study 2016-2017
In their life cycle analysis of the city of Atlanta’s water delivery infrastructure, Jeong et al. succinctly detail exactly how much materials, processes, and direct emissions are associated with the entire water delivery infrastructure in Atlanta, on a per cubic meter of potable water delivered to point of use basis [3].The scope of their life cycle analysis includes the construction and retirement of the system, as well as the pretreatment and wastewater treatment, making their analysis of the impacts of municipal water usage very comprehensive. Shown in Table 1, these impacts include water pollutants, CO2 and electricity demands. These are just a few of the over 20 major material and energy resource impacts of our water supply.
In recent years, many new technologies for saving resources in-home have been developed and commercialized [4]. For water, these methods primarily take the form of water-efficient appliances and appliance “add-ons”, such as faucet and shower aerators. Through 10 states in the US now require new housing to be built with water efficient appliances, there are still 10s of millions of inefficient, old-fashioned appliances being used in the US [5]. Thus, it is important to motivate and enable homeowners to conserve water as effectively as possible. A system or device that “reaches out and affects” a user is termed an intervention.
| Material | Emitted/consumed per 1m^3 water distributed to point-of-use |
| Electricity for supply, collection, treatment | 1.228kWh |
| Water pollutants | 0.158 kg as Phosphorus 1.83 kg as Nitrogen |
| CO2 from biogas combustion | 0.12 kg |
There has been much research around such interventions, and what factors contribute to their success or failure. The proposed intervention design is hypothesized to be more effective than most existing forms of interventions: physical mail, pamphlets, stickers, web portals, surveys, and devices. Just this last group, devices, range in impact from 0-28% savings, thus this work will allow for the exploration of novel mechanisms of feedback as a means to creating behavior change. Further, as digitization of personal information as a means to create personal change gains popular traction (think Fitbit), and the internet of things becomes more encompassing, electronic sensing and feedback will become part of the modern effort to enhance the sustainability of our lives. Thus, we propose the further development of a device oriented-intervention aimed at achieving water conservation at the kitchen sink. This device has already been prototyped, and deployed in a successful beta test. To contextualize our device, the following paragraphs provide a review of the most popular devices in academic literature. Figure 1 on the previous page is a picture of the prototype device deployed in our pilot study.
The first water feedback device in academic literature was Arroyo et al.’s Waterbot. This provided auditory and visual feedback for the user of a single sink, tested in a lab environment, as s/he used it. It relies on two parallel LED strips, one of which illustrates one’s ‘average’ usage in abstract terms and the other shows real-time usage for comparison. The user was also given positive affirmation for using less than average. No data was reported about how this device affected water usage at this faucet [6].
Kutsenov et al. developed a device suite, called UpStream, consisting of a faucet device as well as a handful of shower-oriented devices. These devices used microphones to sense noise from pipes in order to estimate water flow rate. The devices reported water volumes with 10% error at 0.1 gallon, 0.37 L, increments. The faucet device provided only abstract feedback in the form of a green or red light. Additionally, it had limited real-world deployment as the devices had short battery lives. While deployed in a college dormitory, the faucet devices achieved a range from -33% reduction to a +125% increase in water usage at each faucet [7].
Also pertinent to this review is an open source project published on Instructables.com by Matthew Buchanon. His intention was to create an in-situ water monitor for faucets. He ultimately decided to use a modified Hall Effect monitor attached to a water main dial to measure instantaneous water usage, in conjunction with piezoelectric sensors on specific faucets to determine which was on. He employed a wireless network of “Pinocchio” microcontrollers.
There are devices that provide more information than simple real-time usage data. Thus, there is a gap in the literature our device aims to fill with respect to devices that take into consideration the point at which a user may be in his or her path towards behavior change. Furthermore, we have identified an additional gap in devices which attempt to educate their users as well as inform them of real-time water usage data. This gap was also highlighted in the paper “Sustainably Unpersuaded,” which criticized many sustainable persuasive technologies as making many fallacious assumptions about the intended audience of such devices [8]. Thus our group intended to take into considerations our own perceived gap in the literature, He et al.’s prescriptions for behavior change, and Bryanjisttador et al.’s criticisms of persuasive sustainable technologies [9].
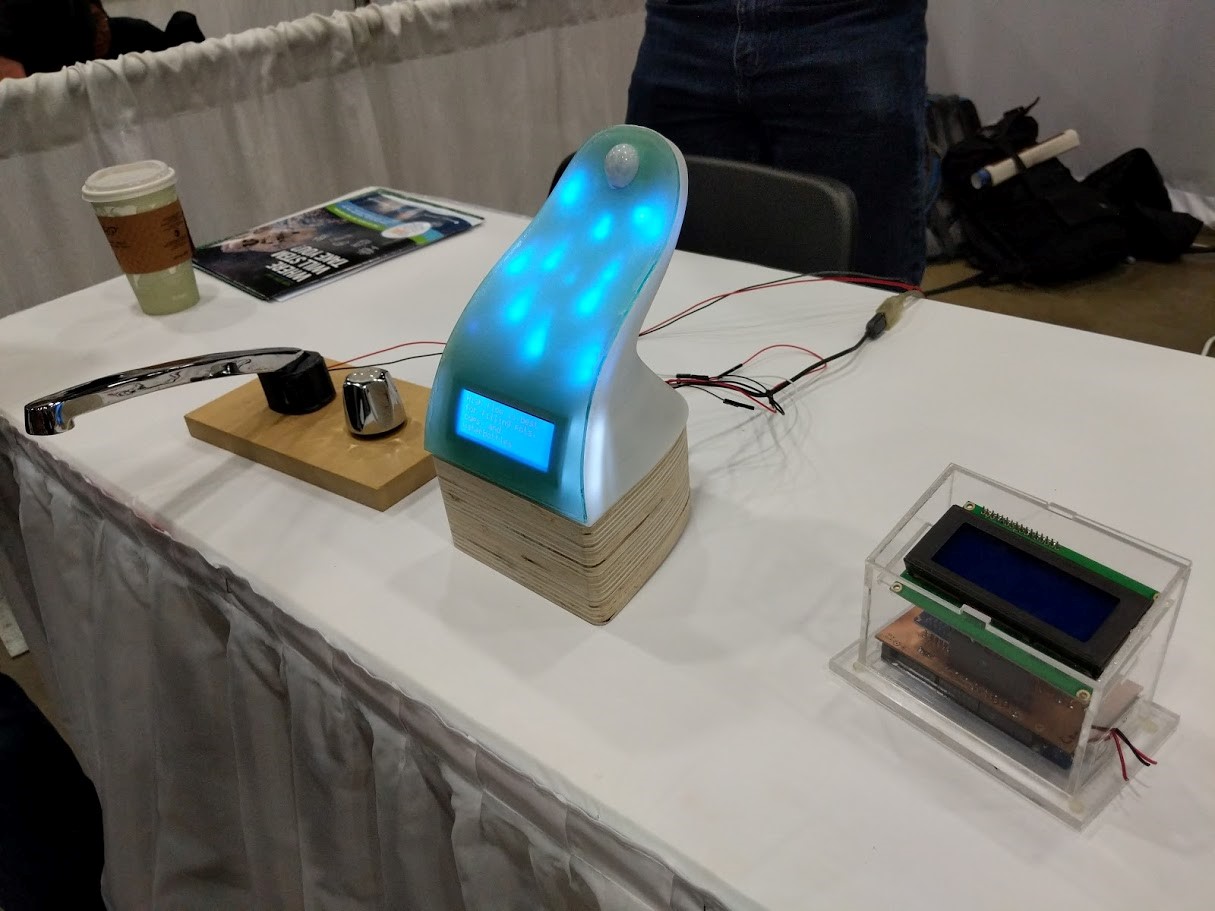
Figure2: Generation 2 Prototype at Science and Engineering Festival at EPA P3 booth in Washington D.C.
We proposed to create more effective training devices by combining sub-goal based instruction with the trans-theoretic model of behavior change. Sub-goal instruction breaks down large tasks or goals into smaller more immediate steps (sub-goals) that a novice can more easily implement. The trans-theoretic model of behavior change uses a series of priming stages to match feedback (such as sub-goals) to an individual's stage of development [9]. The model that we utilize is adapted from health services to electricity and water conservation devices [10] and has five different stages of behavior change:
- Pre-contemplation – Goal is to recognize need for behavior change.
- Contemplation – Goal is to consider changing behavior
- Preparation – Goal is to plan behavior change
- Action – Goal is to enact behavior change
- Maintenance – Goal is to maintain behavior change & manage relapses
Relationship of Challenge to Sustainability (People, Prosperity and the Planet)
This device directly impacts an individual’s water usage habits and opinions. Thus, it embodies natural resource accounting as the affected individual will have a greater respect for water, and such an effect will ripple throughout the user’s direct community. It also makes steps towards achieving water security by lowering an individual’s water consumption. Water security is an especially volatile issue in the Southeast this year, with massive droughts leading to unprecedented wildfires, water shortages, and legal battles over state’s water rights. Further, by limiting one’s water consumption, the device helps to protect the integrity of local water sources (the Chattahoochee river in Atlanta), and helps to mitigate the wear on water delivery and processing infrastructure.
Users of this device will receive direct economic benefits through the lowering of their water bills due to more efficient water usage practices. In places with very high water billing rates, such as Atlanta where this device was developed, this could mean saving upwards of $100 a month for the typical 4 person household. Further, as mentioned in the challenge description, a 30% decrease in home water consumption is estimated to result in a national savings of upwards of 5.4 billion gallons of potable water each day.
The goal of this project was to develop the technology towards the point where it is aesthetically, technically, and scientifically supported to be effective. Thus, the broader implications for its implementation are quite large. There are many routes through which such a device may be mass produced and used in water-education programs: bought by individual users, for instance, provided by environmental groups, or leased by water utility companies.
Purpose, Objectives, Scope
The objective of this research project was educate a diverse group of students in sustainable design by improving upon a prototype smart water device that provides coaching feedback directly at the point of use. The student team aimed to improve the industrial design of the device to make it more effective and appealing to users as well as manufacture and test the second generation of devices.
The team consisted of eight students, three industrial design masters students and 5 undergraduates. The students were diverse in their backgrounds, including sophomores, juniors and masters students from the colleges of engineering and design and 3 women.
| Phase | Type of Feedback |
| Baseline | Welcome message (collects data only) |
| PreContemplative | Facts about water |
| Contemplative | Facts about water’s value |
| Preparatory | Facts about water loss; Reports user’s consumption after use |
| Action | Tips for water conservation; Reports user’s consumption during and after use |
| Maintenance | Cycles all other phase information; Provides summary usage information after sink is off |
The devices, shown in Figures 1 and 2, sit on the counter next to a kitchen sink. The screen displays data so that users may view the content whenever nearby. A piezoelectric transducer is attached to the exterior of the faucet and senses water use through vibration in the faucet. The primary function of each generation device was to provide continuous information on water or water consumption, thus increasing awareness and promoting behavior change.
The device employed feedback according to the trans-theoretic model of behavior change. The phases and types of feedback utilized in each phase are shown in Table 1. When the faucet was not in use, the device displayed general feedback, such as tips about water use or daily water consumption totals. When the faucet was in use, it provided current water consumption values.
The objectives for the project were to:
(1) re-assess the initial prototype design and devise solutions to issues observed in pilot testing with users.
(2) design and build a new prototype
(3) present their work at the U.S. Science and Engineering Festival
(4) obtain user feedback
(5) engage in user testing
Additionally, learning objectives for the students were:
(1) to work with interdisciplinary teams
(2) to understand life cycle assessment and tradeoffs in design for smart technology for sustainable user behavior
(3) to provide effective technical communication to the general public
The redesign of the prototype aimed to improve device calibration, feedback, sensitivity, power source, and casing. The pilot device took up to two hours to set up and calibrate. For the device to be commercially viable, it would need to be set up in less than hour or less than 30 minutes. The less time it takes, the more likely users are to adopt the device. A number of users in the pilots also did not like that the device was on constantly. Also, the initial device was not attractive. The method of attaching to the sink was achieve with a piece of tape and needed a more robust and flexible method. The casing also made it difficult to engage in repairs of the pilot devices.
Summary/Accomplishments (Outputs/Outcomes):
Data, Outputs, Outcomes, Findings
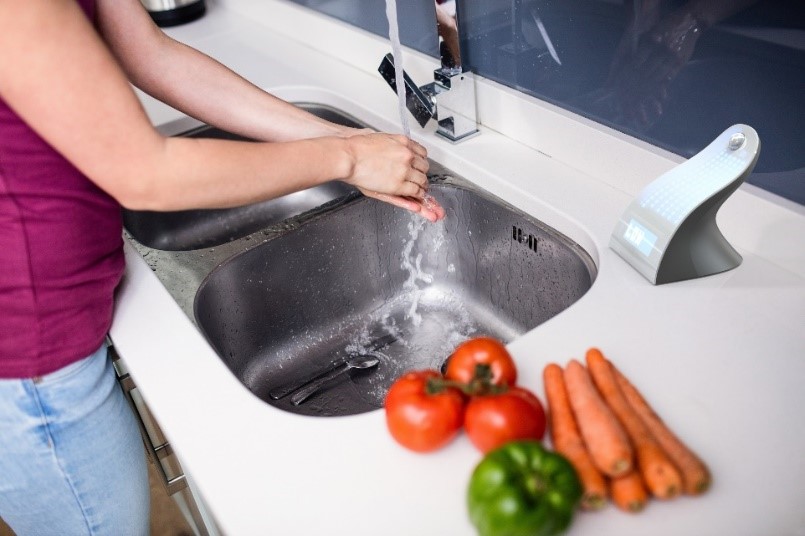
Figure 3: Rendering of EPA P3 Device Design in a Home Environment
The primary accomplishment of this EPA P3 student research project was the design and construction of an improved water device. The goal was to improve the aesthetics, technology, and effectiveness so that the device could be marketable. Shown in Figures 3 and 4, the new water device utilizes additional feedback features and sensors to resolve issues from the initial device design.
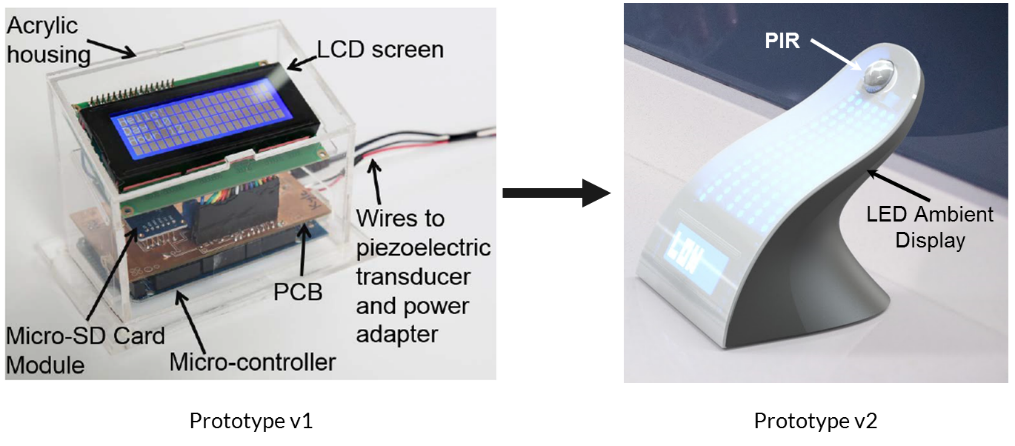
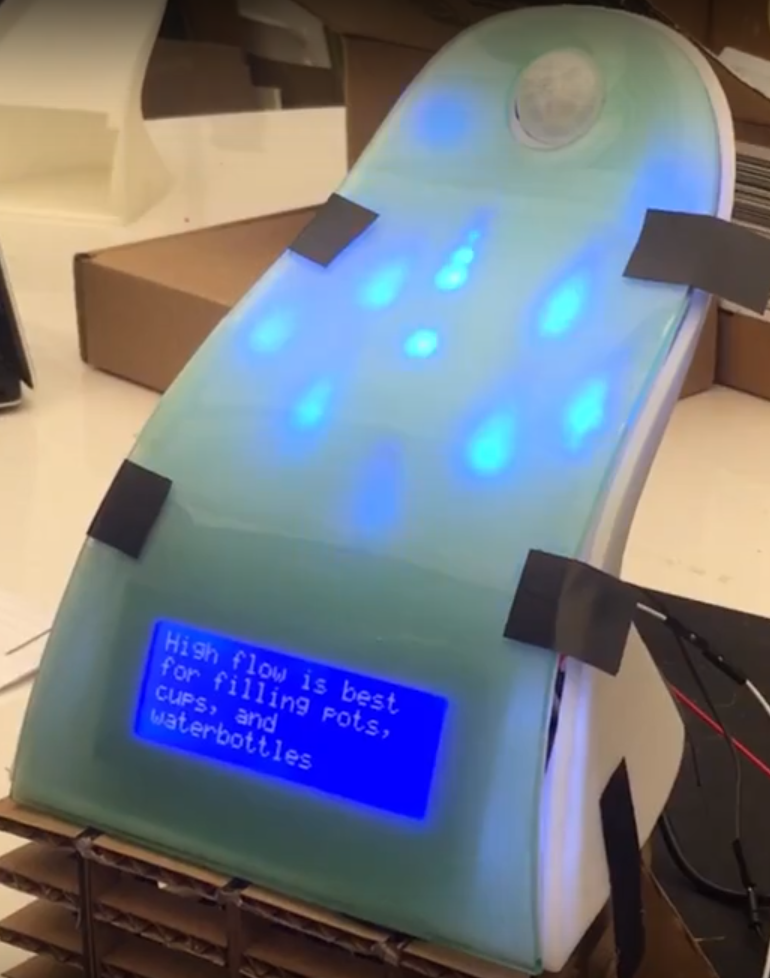
Figure 4: Comparison of Generation 1 and Generation 2 Devices
Aims 1 & 2: Assess Initial Design and Re-Design and Construct Generation 2 Device
The new design addresses multiple areas of concern from the initial prototype and outline in the project proposal.
Intelligent feedback: The initial pilot utilized a feed-forward logic for each phase, the system of feedback changed phases after a set period of time passes, a week, or two weeks in the case of the action phase. To improve this, the new design looks for a statistically significant behavior shift before a user can be “graduated” from the action to the maintenance phase of behavior change.
Less false positives of flow: An analysis of the pilot data showed clear periods of time where ambient vibration was misdetected by the transducer as sink flow, causing erroneous data to be collected. This was likely due to things like dishwashers, kitchen appliances, pipes, garbage disposals, and the like. The addition of a passive infrared (PIR) sensor reduced the number of false-positives because it would require that a user be at the sink before the device would start sensing water flow.
Casing redesign: Redesigning the case with the team of industrial designers allowed it to be more ergonomic, allowing for better access to necessary components in the system while also being more attractive and waterproof. The redesigned prototype is a much more commercial looking device with more engaging interface.
Improved display, added ambient feedback: The team maintained the original feedback text for tips and subgoals, but added additional flow rate display to engage the user and increase ease of use. This display shows water drops which slow or speed up with the water flow rate. This was deemed the more important aspect of feedback as turning off the faucet when not used and usng low flow rates are the primary means of conservation. This large display also helps distinguish between eduational display and in-use display feedback.
Sensing improvements by attachment: The team also designed multiple alternatives for attaching the sensor to the faucet and identified in-flow meters for further testing. In-flow meters were still judged to be too invasive for testing without hiring plumbers to assist, thus reducing ease-of-use of the device
Unfortunately, the redesign was not able to address issues of:
Power source redesign: The pilot device required a plug to have adequate power for the duration of the study. The team explored the addition of solar panels and batteries to replace the power outlet source. Unfortunately, the redesign require an extensive overhaul of the electronics, including instituting a sleep mode which was beyond the student team's capabilities within the time limitation.
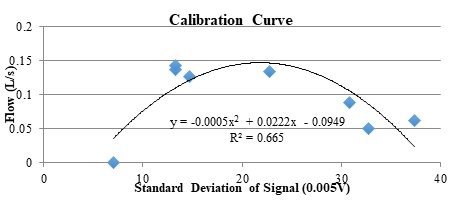
Figure 5 - Inverted exponential shape of calibration curve caused faulty device activity
Calibration time: The initial device had a long calibration step, this issues was not resolved in the new prototype. Shown in Figure 5, the device still utilizes the same steps to related a standard deviation of faucet vibrations to the flow-rate through systematically taking samples at different flow rates.
Aim 3: Present Device at US Science and Engineering Expo
Seven of the students on the project and the PI attended the US Science and Engineering Expo in April 2018 with a prototype of the generation 2 device. This device was demonstrated to dozens of visitors who attended the festival. The team created a poster detailing the operation and pilot testing results and answered questions from the general public. The eighth student had not yet joined the team.
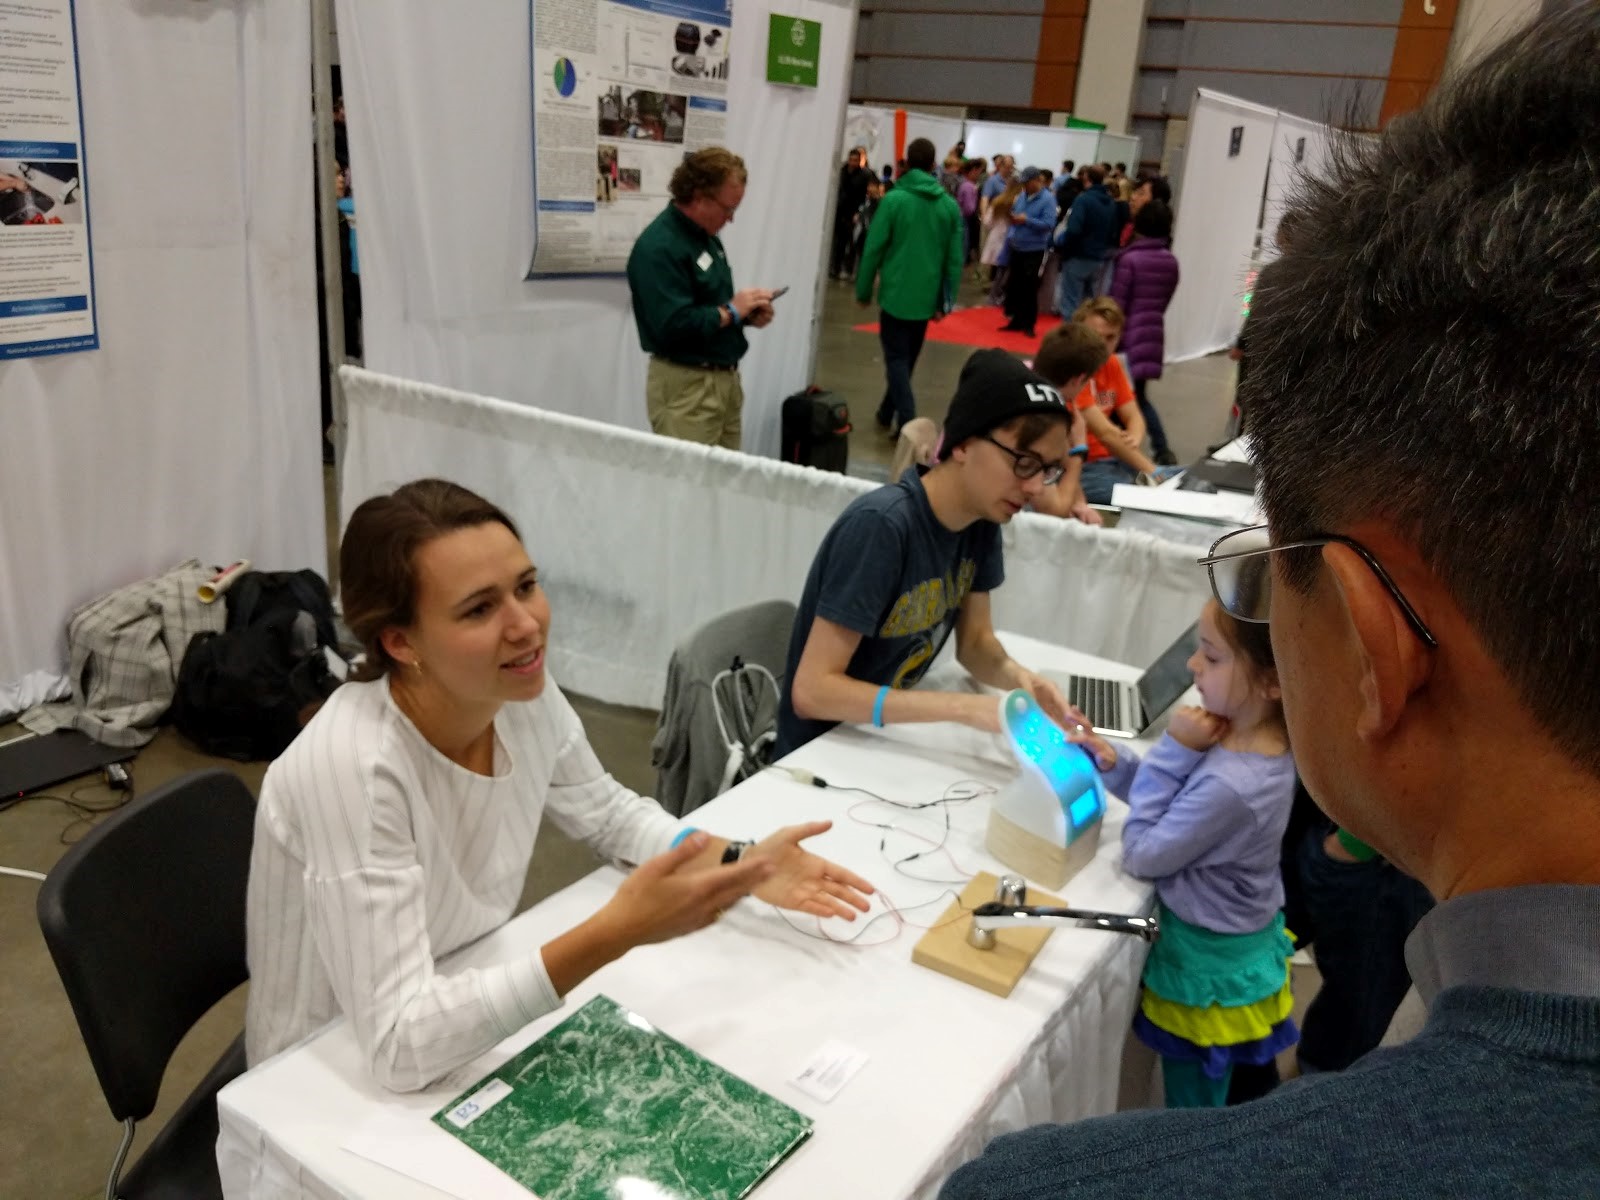
Figure 6: Interactive Display at Expo
Aim 4: Obtain user feedback
The Generation 2 device was well received by potential consumers. Feedback, summarized in Table 3, provided to the student team highlighted a desire for more interactive conservation products in the home. The feedback, however, showed a split between interests in a water coaching device and interests in a water conservation device. While most felt the device should be under $30. At least one potential consumer felt the device should be more expensive.
| Functionality | Marketability | Uses Cases |
|
|
|
Many potential consumers were very interested in the coaching aspect for their children. They were interested in an affordable (price of an Echo dot about $20) device to teach their children to turn off the faucet and not let the water run.
Other consumers were more interested in the savings data, both material savings of water and the monetary savings from the water bill. These consumers wanted more information graphics showing how their water use has changed and the use impacts.
A few consumers also were uninterested in the behavior aspects and excited about the potential to find leaks or drips and automatically close the leaky faucet or notify the resident.
Aim 5: Test the generation 2 prototype
The research team aimed to build and test the generation 2 device in households during the Fall of 2018. The two students in charge of recruitment visited ten different apartment buildings to speak with building managers and enroll participants with permission. However, it was not possible to enroll a sufficient number of participants for the study. Similar to previous studies, fewer than 10 participants expressed interest. There was not sufficient time in the study period to allow for recruitment to complete. It is essential to recruit a larger sample size due and long enough study period, as evinced by the second pilot study collected and analyzed in 2017.
A second pilot study was completed before design of Generation 2 and before funding was received. These results were used for the redesign and P3 project work (Aims #1 - #3). The results from the second pilot study run with participants in Spring 2017 were largely consistent with the initial pilot results described in the P3 proposal, though the shape of the usage curve was less conclusive.
The study tested the device with 5 participants randomly assigned to control or phasic groups. The control group utilized only the Generation 1 device with water usage readings. The phasic group utilized the device with the phasic feedback algorithm. Through the course of the 49-day intervention the phasic group lowered faucet volume usage by 50% while the non-phasic group lowered their average usage by 2%. However, in the second to last week of the study, Action Phase week two, the phasic group only reduced usage by 17%, while the control group reduced 30% compared with the baseline phase. The shape of usage was a bit noisier in this pilot study than in the Fall 2016.
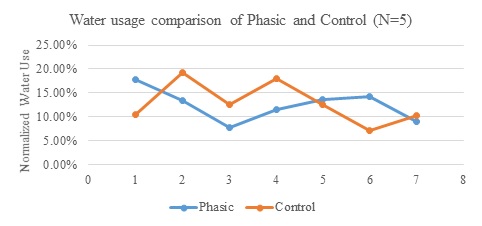
Figure 7 - Spring 2017 Weekly Usage
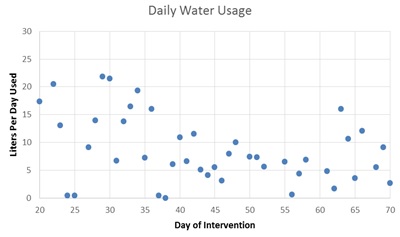
Figure 8 - One household's daily use, note day 21 and 23 had usages higher than the limit, 75L and 83L respectively
However, due to a small sample size this change is not statistically significant (P=0.93). From the open ended follow-up survey we learned that the phasic groups found the devices quite interesting while the non-phasic control groups did not.
Educational Aims 1-3
The project also achieve a number of learning outcomes for the students.
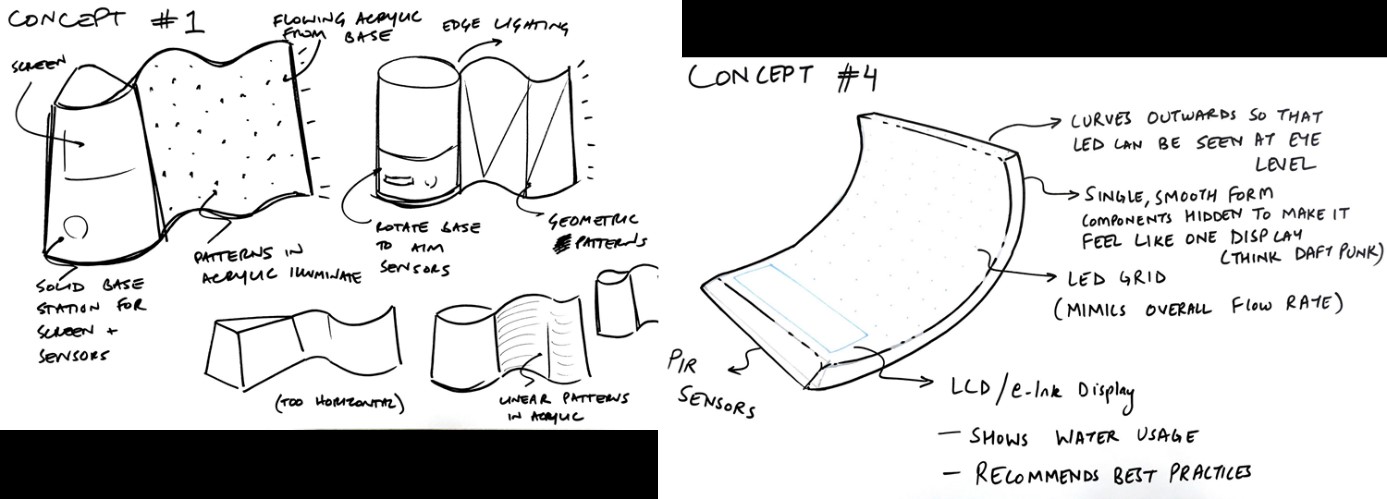
Figure 9: Sketches for Generation 2 Prototype
Interdisciplinary design: The students worked as a multidisciplinary team as industrial engineers and mechanical engineers. Generation 2 prototyping involved a semester long redesign workstream assessing the electronic system, circuit board, feedback algorithm, displays, and shape factors of the device. This process provided a hands-on educational experience that focused on commercial use and user experience, which is rare in engineering curriculum. Show in Figure 9, the students created many sketches and cardboard prototypes of new design forms that would look more attractive in homes and provide motivating feedback displays. In addition to the form of the device, the students learned about printed circuit board design, programming and design for environment.
Sustainable design: This project was also the first exposure to environmental life cycle assessment for many of the students. They learned about the tradeoffs between smart technology materials and conservation during use. Shown in Figure 10, the water coaching device has the potential to save pollution, such as CO2 by reducing need for water treatment. However, this saving is offset by the materials and electronics components. The device emits about 8.3 kg of CO2 during production and about 0.1 kg of CO2 per day during operation, resulting in a 44.8 kg CO2 e from the device after the first year of use. The water treatment value assumes that the average sink is used to wash dishes once per day by a very inefficient washer (approx. 100L of water [11]). If the user achieves the 60% reduction in use by week 5 observed in testing, the device may save 40 kg CO2 e in water treatment. Thus, the device results in a net positive emissions of 4.8 kg CO2 e. The students assessed these tradeoffs in sourcing and reviewing a wide set of materials and manufacturing processes.
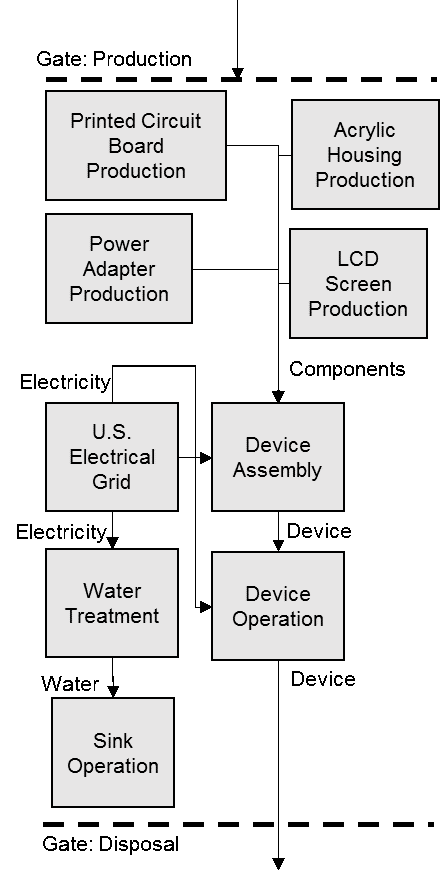
Figure 10: Gate-to-Gate Process Flow of the Water Device and Water Treatment
Public technical communication: This project was also the students' first experience traveling to a science conference to present their work to the general public. They worked together to design a demonstration with which visitors could interact. They also designed a technical poster and graphics for describing the mix of psychology and engineering used in the design. Most importantly, they spoke face-to-face with people of all ages, young and old, answering questions and engaging in debate and critical thinking on the design of their product. This interaction with the general public provides a new perspective on the work, exposing to many difference viewpoints.
Conclusions:
Discussion, Conclusions, Recommendations
This project designed a smart water savings device. Pilot studies demonstrate a savings potential of 60% and a streamlined life cycle assessment of the first generation design indicates high potential for net reduction in CO2 equivalent emissions. The redesign was successful in increasing the marketability of the device and consumer interest. Most interest seemed to be for children to learn about reducing waste and saving money and resources.
At 60% water savings, the emissions payback time for the device would be 405 days. These estimates assume that the device operates constantly. If the device went to sleep or otherwise shut off when a user wasn’t in viewing distance, the device power could likely be reduced by 66% or more. This 66% estimate assumes that for 16 hours of the day house hold members may be at work, running errands or asleep. If the device went to sleep, it would require a 20+% water savings.
The redesigned device focused on features to detect nearby users and enable sleep modes to reduce annoyance by the device being constantly lit and to reduce energy consumption. The redesigned device was also made to be more engaging and visually descriptive to communicate water flow.
The project was not able to complete user testing, however. Not enough in-home testing participants enrolled. The testing period requires multiple months of using the device to determine if it indeed coaches towards behavior change and water savings. Although the team visited many complexes and posted advertisements, the necessary 20-40 participants were not found. It was also important to have concurrent participation because of the impact of holidays and seasons on water consumption. For example, water may be run for longer periods during winter while waiting for hot water.
Nevertheless, the P3 competition succeeded in impacting a wide range of students who are better prepared to innovate and design products that are human centered and environmentally friends. Eight students were involved in the design, including manufacturing, procurement, technical communication, electronics design, prototyping, programming and other aspects of a commercially viable product. The team was diverse and interdisciplinary with three industrial design masters and five mechanical engineering undergraduates.
The results of this project were submitted to a Google Research Award competition in Sept. 2018 for further funding under the title of "From Trackers to Trainers: Devices that Monitor and Respond to User Behavior Change." This research would have focused on the use of machine learning to create more personal coaching experiences that responded to individuals unique rates of learning. It would identify what habits were being developed and which were required more assistance. The funding was not awarded.
Research Conduct
To the PI's knowledge, no research misconduct has occurred during the report period. EPA defines research misconduct as fabrication, falsification, or plagiarism in proposing, performing, or reviewing research, or in reporting research results [65 FR 76262. I], or ordering, advising or suggesting that subordinates engage in research misconduct.
References:
References
- P. Gleick, “Basic Water Requirements,” Water International. 1996.
- United States. Environmental Protection Agency, “Water on Tap - What You Need to Know,” Water, p. 33, 2009.
- H. Jeong, E. Minne, and J. C. Crittenden, “Life cycle assessment of the City of Atlanta, Georgia’s centralized water system,” Int. J. Life Cycle Assess., pp. 880–891, 2015.
- a. L. Sønderlund, J. R. Smith, C. Hutton, and Z. Kapelan, “Using Smart Meters for Household Water Consumption Feedback: Knowns and Unknowns,” Procedia Eng., vol. 89, pp. 990–997, 2014.
- “Water-Efficient Plumbing Fixtures.” [Online]. Available: http://www.ncsl.org/research/environment-and-natural-resources/water-efficient-plumbing-fixtures635433474.aspx. [Accessed: 08-Feb-2016].
- L. Bonanni, E. Arroyo, C.-H. Lee, and T. Selker, “Exploring feedback and persuasive techniques at the sink,” Interactions, vol. 12, no. 4, p. 25, 2005.
- S. Kuznetsov and E. Paulos, “UpStream,” Proc. 28th Int. Conf. Hum. factors Comput. Syst. - CHI ’10, vol. 3, p. 1851, 2010.
- H. Brynjarsdottir, M. Håkansson, J. Pierce, E. Baumer, C. DiSalvo, and P. Sengers, “Sustainably unpersuaded: How Persuasion Narrows Our Vision of Sustainability,” Proc. 2012 ACM Annu. Conf. Hum. Factors Comput. Syst. - CHI ’12, p. 947, 2012.
- H. A. He, S. Greenberg, and E. M. Huang, “One size does not fit all: Applying the Transtheoretical Model to Energy Feedback Technology Design,” Technology, pp. 1–11, 2009.
- Telenko, C., and Benzoni, N., 2018, “Life Cycle Tradeoffs in a Feedback Device for Reducing Water Consumption,” Procedia CIRP.
- U.S. Geologic Survey. How much water does the average person use at home per day? USGS Water Sci Sch 2014. https://water.usgs.gov/ edu/qa-home-percapita.html (accessed October 2, 2017)
The perspectives, information and conclusions conveyed in research project abstracts, progress reports, final reports, journal abstracts and journal publications convey the viewpoints of the principal investigator and may not represent the views and policies of ORD and EPA. Conclusions drawn by the principal investigators have not been reviewed by the Agency.