
Grantee Research Project Results
2019 Progress Report: Development of a multi-scale management tool for predicting and mitigating HABs in Ohio River watersheds
EPA Grant Number: R839269Title: Development of a multi-scale management tool for predicting and mitigating HABs in Ohio River watersheds
Investigators: Sullivan, Mažeika , Pintor, Lauren , Zhao, Kaiguang
Current Investigators: Sullivan, Mažeika , Atristain, Miren , Pintor, Lauren , Zhao, Kaiguang
Institution: The Ohio State University
EPA Project Officer: Packard, Benjamin H
Project Period: January 1, 2018 through December 31, 2020 (Extended to December 31, 2024)
Project Period Covered by this Report: January 1, 2019 through December 31,2019
Project Amount: $681,343
RFA: Freshwater Harmful Algal Blooms (2017) RFA Text | Recipients Lists
Research Category: Watersheds , Water Quality , Water
Objective:
The overarching objective of this project is to develop a watershed/catchment classification system to diagnose and manage harmful algal blooms (HABs) in the upper Ohio River basin. The goal is a multi-scale, hierarchical tool that links climate and land use with river physicochemical gradients and ecological condition to predict and prevent HABs. Our overarching hypothesis is that the timing and magnitude of HABs are related to variability in anthropogenic and natural factors in catchments. Our objectives are to: (1) Determine in-stream characteristics related to distribution, duration, and intensity of HABs, (2) Determine local climate and land-use features strongly linked with HABs, (3) Assess the ability of our system to scale up to large catchments, and (4) Develop and validate a classification system for use by communities and local and state agencies to predict and prevent HABs.
Progress Summary:
Objective 1 – Fine-scale characteristics and analysis:
Building off research conducted at Ohio stream and reservoir sites (3 catchments total: Indian, Hoover, Burr Oak) sampled since 2016, Indiana and Kentucky/Tennessee site selection and development of sampling protocols were completed for streams and reservoirs in the 2 catchments in Indiana (Monroe, Patoka) and 1 catchment in Kentucky/Tennessee (Barren River) (Figure 1). In the remaining Kentucky catchment (Taylorsville), 2 stream sites have been selected and an additional 5 stream sites will be added in 2020. Delays for Taylorsville site selection occurred due to the process of acquiring land-owner permissions taking longer than anticipated. In total, there will be 76 sites spread across the streams and reservoirs of the 7 study catchments that capture a range of land-use types (Table 1). Also see Appendix 1 for land-cover maps of each study catchment.
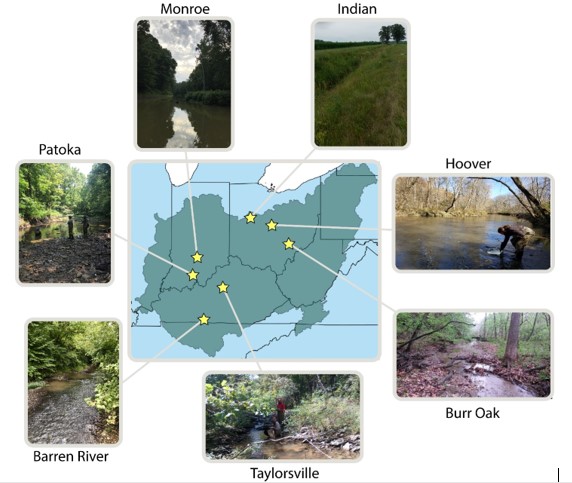
Figure 1. Study catchment locations in the upper Ohio River basin with stream examples. Note that the Barren River catchment spans Kentucky-Tennessee.
| Land Use | Indian | Hoover | Burr Oak | Patoka | Monroe | Taylorsville | Barren River |
|---|---|---|---|---|---|---|---|
| Soybeans | 0.473 | 0.263 | - | - | 0.016 | - | 0.028 |
| Corn | 0.252 | 0.184 | - | 0.014 | 0.014 | - | 0.025 |
| Deciduous forest | 0.069 | 0.257 | 0.821 | 0.762 | 0.844 | 0.669 | 0.196 |
| Drass/Pasture | 0.055 | 0.173 | 0.043 | 0.089 | 0.044 | 0.162 | 0.208 |
| Developed/Open Space | 0.051 | 0.059 | 0.070 | 0.038 | 0.020 | 0.025 | - |
| Open water | 0.043 | 0.015 | 0.3023 | 0.059 | 0.046 | 0.025 | - |
| Evergeen forest | - | - | 0.017 | 0.018 | - | 0.040 | - |
| Other hay/Non alfalfa | - | - | 0.009 | - | - | 0.054 | 0.147 |
Table 1. Land-use proportions by study catchment.
Stream Geomorphic Parameters: Stream geomorphic surveys were conducted using a total station (at one site in Patoka and all Ohio sites) to quantify channel dimensions (cross-sections, longitudinal profiles) and bed-grainsize distribution using Wolman’s Pebble counts (4 streams in the Patoka catchment, 4 streams in the Monroe catchment, and 6 streams in the Barren River catchment). Geomorphic surveys will be conducted at remaining sites in 2020-21. At a subset of sites, erosion pins and scour chains (Figure 2) were deployed in stream banks and beds, respectively, to evaluate erosion and deposition processes of both small and larger magnitude flow events. Erosion pins have been placed at 71% (10 out of 14) of sites in Indiana and 78% (7 out of 9) of sites in Kentucky. Scour chains have been deployed at 64% (9 out of 14) of sites in Indiana and 67% (6 out of 9) of sites in Kentucky. Additionally, large-wood surveys were conducted in the stream channels of 1 site in the Patoka catchment and 2 sites in the Monroe catchment to determine piece dimensions and characteristics associated with piece function and stability, and will continue in 2020 at a subset of sites.
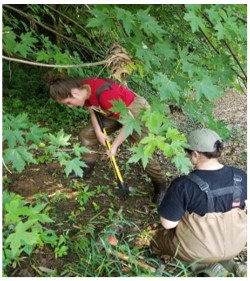
Figure 2. Deployment of erosion pins into a stream bank to monitor erosion events.
Initial analysis indicates that stream geomorphic conditions, as characterized by features such as mean depth, bankfull width, median sediment size (D50), slope, width-to-depth ratio (Figure 3A) and stream hydrology as, characterized by, e.g., Froude number and relative roughness (3B), are not different among Ohio catchments (Indian, Burr Oak, Hoover). Habitat as characterized by features such as flow habitat distribution (i.e., pools, runs, riffles), urbanization, and a habitat evaluation index, exhibit greater separation in ordination space (Figure 3C). Preliminary data also suggest that stream geomorphic features are related to multiple chemical and ecological parameters. For instance, median sediment size is negatively correlated with ammonium concentrations (Figure 4A), likely as a result of grainsize-mediated variability in sediment microbial activity rates and nitrogen assimilation. In contrast, median sediment size is positively correlated with mean carapace length of crayfish in streams (Figure 4B). This suggests that sites with larger sediment size might provide better microhabitat for crayfish, which often make up a large proportion of the biomass of aquatic invertebrates in these streams. Further, linear mixed models indicate that stream geomorphic features are more influential on variability in total P, total N, PO4, and NO3than either hydrologic or habitat characteristics.
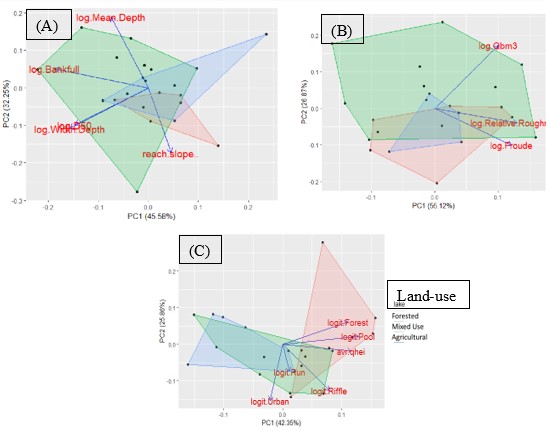
Figure 3. Principal component analysis ordinations illustrating relative separation (or similarity) of (A) stream geomorphic, (B) hydrologic, and (C) habitat features among catchments/land-uses (Forested – Burr Oak, Mixed Use – Hoover, Agricultural – Indian Lake) of Ohio.
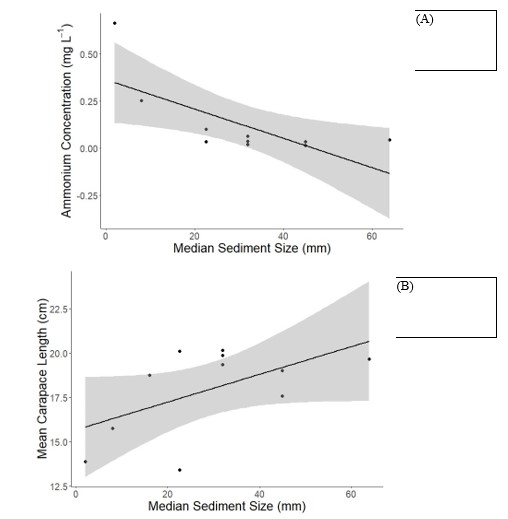
Figure 4. Mean sediment size (D50) is related to (A) ammonium concentrations (simple regression:R2=
0.50, F= 7.88, p= 0.023) and (B) mean carapace length of crayfish (linear mixed model: R2marginal =
0.26, R2conditional = 0.63, p= 0.032) in streams within the Patoka, Monroe, and Barren River catchments. Shaded areas represent confidence curves at α = 0.05.
Physicochemical Parameters: Physicochemical parameters were measured at all Monroe, Patoka, Taylorsville, Barren River, Indian, Hoover, and Burr Oak stream and reservoir sites. Grab samples were collected for water nutrient concentrations, dissolved oxygen, conductivity, temperature, pH, and turbidity. Continuous monitoring multiparameter water quality sondes were deployed in Burr Oak, Monroe, and Barren River lakes during 2019. Sondes were installed in buoys and programmed to collect measurements on temperature, conductivity, pH, dissolved oxygen, organic matter, turbidity, and chlorophyll every 30 minutes.
As in 2018, mean temperature during summer months was above 25oC in the seven reservoirs sampled and was especially high in Taylorsville (30.07 ± 1.88oC) and Barren River (29.96 ± 0.48oC) reservoirs. Due to the effect of temperature on biochemical processes, these values could imply a stress for the biological community. Mean river temperatures were typically lower than in reservoirs, with the highest average value recorded in Patoka sites (24.48 ± 0.05oC). Average pH was slightly basic, ranging between 7.32 ± 0.27(Monroe streams) and 9.26 ± 0.65(Barren River reservoir), which are within or slightly exceed the optimal pH range for most aquatic organisms. Average total N and P were similar in reservoirs and rivers. The lowest dissolved N and P concentrations were observed in Barren River reservoir (0.11 ± 0.05 mg N L-1and 0.04 ± 0.04 mg P L-1, respectively), whereas the highest values were found in Indian Lake (1.94 ± 1.37 mg N L-1and 0.20 ± 0.30 mg P L-1, respectively). Dissolved inorganic nitrogen (DIN) and phosphate were usually higher in streams (Figure 5A) than in reservoirs (Figure 5B). DIN concentrations were particularly high in streams from Hoover, Indian, and Barren River catchments, with phosphate high in Taylorsville as well (Figure 5B). The high variability observed in DIN and phosphate values in Indian and Hoover streams is noteworthy and suggest the occurrence of nutrient inputs associated with human activities, which could promote the development of HABs. Inorganic nutrient concentrations in Patoka (Indiana), Monroe (Indiana), and Burr Oak (Ohio) basins were low, often below the detection limit (Figure 6), which could prevent the occurrence of HABs.
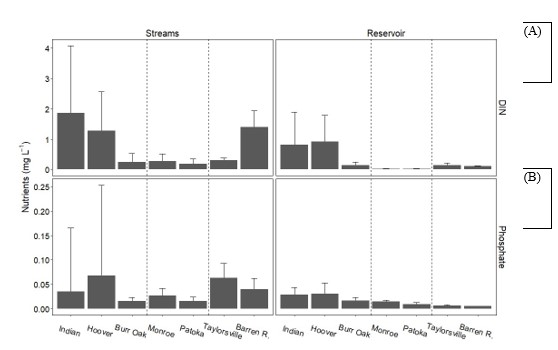
Figure 5. Mean inorganic nutrient concentrations in streams and surface water of reservoirs in the 7 catchments where sampling was conducted in 2019. Error bars are+1 SD. Note the different y-scale for (A) dissolved inorganic nitrogen (DIN) and (B) phosphate. Dashed vertical bars separate locations from different states (Ohio, Indiana, and Kentucky-Tennessee).
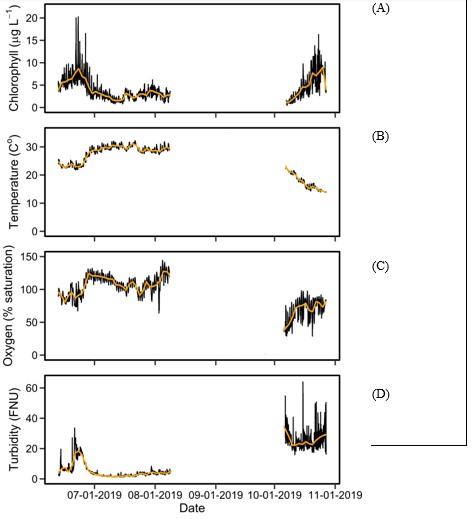
Figure 6. (A) Chlorophyll, (B) temperature, (C) oxygen, and (D) turbidity measured using a multiparameter EXO sonde in Monroe Lake during two time periods in 2019. Orange lines show average trends.
Toxin tracking and isotopes:
SPATT sampling.We increased our sampling effort in 2019 relative to measuring microcystin levels. We deployed solid phase adsorption toxin tracking (SPATT) bags at sites in Taylorsville (2), Barren River (8), Patoka (5), Monroe (4), Hoover (5), Indian (8), and Burr Oak (11). SPATT bags were replaced monthly at least once in every site, except in Hoover, so that a total of 121 SPATTs were deployed and collected during 2019. SPATT bags are scheduled to be sent to an external laboratory for toxin analysis in March 2020.
Isotopes – δ18O of phosphate. Isotope samples measuring δ18O of phosphate (δ18OP) in water were collected at stream and reservoir sampling locations in Ohio and Kentucky during 2019. In addition, we have analyzed spatial variability in the first set of samples from non-Ohio catchments, which were collected in 2018 (Figure 7). Equilibrium values in reservoir samples were calculated from δ18OP and temperature. δ18OP equilibrium values were typically higher than δ18OP values (Figures 7, 8A), which is a necessary condition to estimate the contribution of the different streams (i.e., phosphorus sources) to the dissolved phosphorus pool of the reservoir/lakes. Our sampling included several sites within each lake (usually 3 sites) in order to capture the spatial variability of the phosphate pool within lakes (Figures 7, 8A). Preliminary analysis using mixing models (MixSIAR R package) from Indian Lake catchment (Ohio) showed that Blackhawk Run and streams with similar isotopic values contributed 51 ± 30% to the dissolved phosphate pool of the northwest part of the lake (Figure 7). This is in agreement with the high phosphate concentration (0.038 mg L-1) measured in Blackhawk Run. In the case of south Indian Lake, δ18OP values mostly are distributed outside of the δ18OP stream-to-equilibrium range of values (Figure 8B), which precludes the estimation of stream contributions to this section of the reservoir/lake phosphate pool using mixing models. Samples collected in Indian Lake, Burr Oak, Hoover, Taylorsville, and Barren River catchments in 2018 and 2019 – including targeted point-source sampling to refine estimates of δ18OP contributions to reservoirs – are currently being analyzed (University of Nebraska Water Sciences Laboratory, Lincoln, Nebraska).
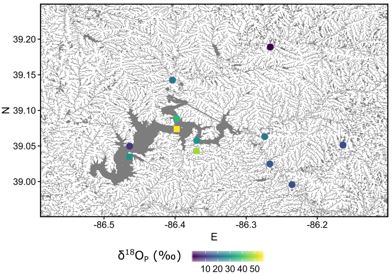
Figure 7. δ18O of phosphate values (circles) at stream and reservoir sites in Monroe Lake catchment (Indiana) during 2018. In reservoir sites, squares represent equilibrium δ18OP values.
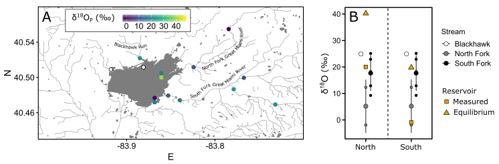
Figure 8. Variability of δ18O of phosphate values (circles) at stream and reservoir sites of Indian Lake
(Ohio) catchment in 2017. (A) Measured δ18OP of values are represented in circles. In reservoir sites, squares represent equilibrium δ18OPvalues. White dots indicate sites where samples were collected but δ18OP could not be measured. (B) Measured δ18OP values in the sampling sites located in the north (leftside) and south (right-side) sections of the reservoir (squares) and associated equilibrium values (triangles). Large circles and vertical bars represent mean and standard deviation values in each stream, respectively, which were calculated from values measured from stream sampling sites (small circles). Dots are horizontally displaced to avoid overlapping. Note that δ18OP values measured in the northern reservoir section generally fall between the equilibrium and stream values, whereas in the case of southern site they are out of range.
Ecological Parameters: Aquatic macroinvertebrates and fish have been sampled at Ohio sites since 2016. In 2019, all ecological parameters were sampled at all stream sites in Indian, Hoover, Burr Oak, Monroe, Patoka, Taylorsville, and Barren River catchments, except for fish that were only sampled at a subset of stream locations at Monroe (4), Patoka (5), Barren River (7), and Taylorsville (2). The remaining stream sites will be sampled in 2020-21. In Ohio, all ecological parameters have been sampled at least twice since 2016. In 2019, only periphyton and phytoplankton were sampled across all sites in Ohio.
Periphyton and phytoplankton. Periphyton (to quantify chlorophyll concentration, biomass, and species composition) and phytoplankton (to quantify chlorophyll) were collected at 43 sites. Periphyton biomass samples from stream sites were analyzed using Ash Free Dry Mass (AFDM) and chlorophyll-a. Most periphyton AFDM ranged from 0.13-1 mg cm-2 (Figure 9), with the greatest variability in the forested Patoka Lake catchment of Indiana. In contrast, mixed-use (Hoover and Barren River) and agriculturally dominated (e.g., Indian Lake) catchments exhibited the greatest variability in periphyton chlorophyll-a samples, which ranged from 0.103-9.945 µg cm-2(Figure 10).
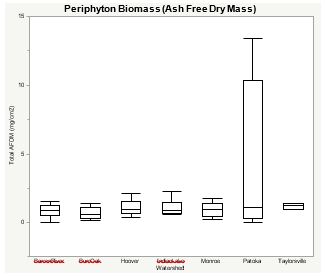
Figure 9. Box plot illustrating differences in benthic algal biomass (periphyton from stream sites) analyzed as differences in ash free dry mass (AFDM in mg cm-2). Lines in boxes are medians, box ends are quartiles, and whiskers show minimum and maximum values.
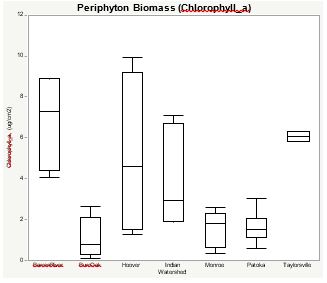
Figure 10. Box plot illustrating differences in benthic algal biomass (periphyton from stream sites) analyzed as differences in chlorophyll-a (µg cm-2). Lines in boxes are medians, box ends are quartiles, and whiskers show minimum and maximum values.
We started the analysis of phytoplankton communities using fluoroprobe from samples collected in Ohio catchments since 2016. Chlorophylla concentration, which roughly reflects phytoplankton biomass, was higher in reservoirs than in streams (Figure 11). Chlorophylla was particularly high in Indian, followed by Hoover and Burr Oak. Cyanobacteria and diatoms were the dominant phytoplankton groups, particularly in Indian Lake. Based on these results, Indian Lake presents the highest risk of occurrence of HABs among all our Ohio sampling sites.
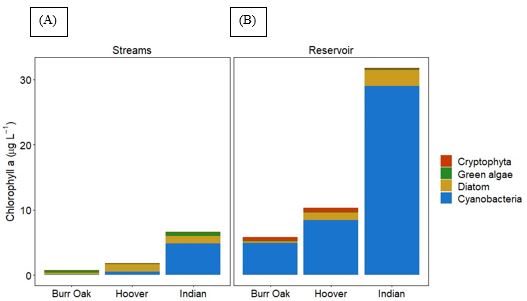
Figure 11. Chlorophyll-a concentrations of the different phytoplankton groups (color scale) measured in (A) streams and (B) reservoirs using a fluoroprobe in the three catchments sampled in Ohio (2016-2019).
Aquatic Macroinvertebrate Diversity.Aquatic macroinvertebrate samples are in the processes of being sorted in house and sent to Rhithron Associates, Inc. (Missoula, Montana) for identification. Preliminary results suggest that macroinvertebrate density is similar across Ohio catchments, but mean percentage of Ephemeroptera, Plecoptera, and Trichoptera (EPT) taxa was highest in the mixed-use watershed of Hoover Reservoir.
Fish Diversity.Fish diversity measured using the Shannon Diversity Index ranged from 0.003 to 13.43 mg cm-2at Ohio stream sample locations; preliminary analysis of fish assemblages at sites outside of Ohio is underway.
Objective 2 – Coarse-scale characteristics and analysis:
During the past year, we continued to compile and process a suite of environmental variables that are known to be related – either directly or indirectly – to hydrological regimes and water quality such as weather and climate, soil parameters, land use/land cover, crop types, and topography. These spatial layers are secondary data retrieved from a variety of sources; many are inputs to the water quality model SWAT that we propose to use for simulating water and nutrient transports at the catchment scales. In addition to the continued data preparation and collection, we conducted some initial model runs with SWAT for the three Ohio catchments. The catchments have contrasting land-use compositions (Figure 12). Burr Oak catchment is dominated by deciduous forests, the Hoover reservoir catchment by forests and croplands, and the Indian Lake catchment by cropland. This gradient in land composition is a key driver that determines the simulated catchment-level hydrological parameters, including those related to water quality as depicted in Figure 13. An important next step is to refine and calibrate these models with more in-situ data and extend the simulations to more catchments as well as to link these coarse-level simulations with the other stream and reservoir data collected from this project.
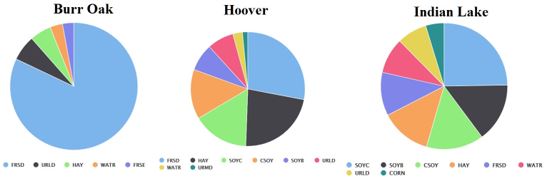
Figure 12. Land-use compositions for the three Ohio catchments. Acronyms of land-use/land-cover include: Forest-deciduous (FRSD), Residential-Low Density (URLD), Hay (HAY), water (WATER), Forest-evergreen (FRSE), Soybean-continuous (SOYC), Corn-soybean rotation (CSOY), Soybean (SOYB), Residential-Median Density (URMD), and Corn (CORN).
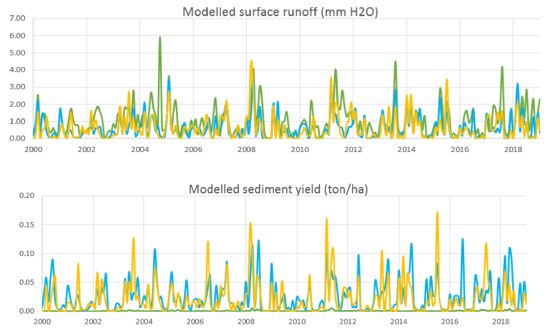
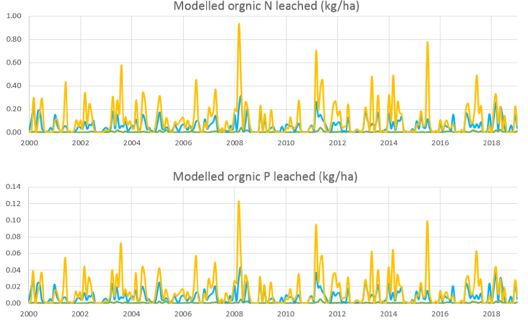
Figure 13. Time series of key water-quality parameters modelled by SWAT for the three Ohio catchments: Green (Bur Oak), Light blue (Hoover), and Brown (Indian Lake).
Future Activities:
Geomorphic, physiochemical, and ecological data will continue to be collected at stream and reservoir sites in Indiana and Kentucky/Tennessee. Additional data will be collected at Ohio sites where necessary to supplement the four years of existing data. Data buoys will be deployed during the spring, summer, and autumn of the next two years at Burr Oak, Hoover, Taylorsville, and Monroe lakes/reservoirs. Isotopic sampling and model building will continue across all catchments. The hydrological modeling framework will be configured and will begin to build our global model using statistical modeling (structural equation modeling) to seek predictive relationships from data, which will serve as the basis for our classification system. An initial classification system will be developed and tested to predict harmful algal bloom regimes.
Journal Articles:
No journal articles submitted with this report: View all 21 publications for this projectSupplemental Keywords:
catchments, cumulative effects, ecological condition, ecosystem, habitat, EPA Regions 4 and 5, Midwest, scaling, sediments, vulnerabilityProgress and Final Reports:
Original AbstractThe perspectives, information and conclusions conveyed in research project abstracts, progress reports, final reports, journal abstracts and journal publications convey the viewpoints of the principal investigator and may not represent the views and policies of ORD and EPA. Conclusions drawn by the principal investigators have not been reviewed by the Agency.