
Grantee Research Project Results
2019 Progress Report: Valuation of Water Quality Change in Environment and Economy Context: Ecosystem Services across Gradients of Degradation and Local Economic Interest
EPA Grant Number: R836320Title: Valuation of Water Quality Change in Environment and Economy Context: Ecosystem Services across Gradients of Degradation and Local Economic Interest
Investigators: Swallow, Stephen , Vadas, Timothy M. , Towe, Charles , Kirchhoff, Christine , Helton, Ashley , Liu, Pengfei
Current Investigators: Swallow, Stephen , Vadas, Timothy M. , Kirchhoff, Christine , Helton, Ashley , Liu, Pengfei
Institution: University of Connecticut
EPA Project Officer: Packard, Benjamin H
Project Period: August 1, 2016 through July 31, 2019 (Extended to July 31, 2023)
Project Period Covered by this Report: August 1, 2018 through July 31,2019
Project Amount: $799,994
RFA: Water Quality Benefits (2015) RFA Text | Recipients Lists
Research Category: Water
Objective:
The proposed research aims to value changes in water quality via a preference function model designed explicitly for calibration and adaptation to alternative study-sites. First, we will measure the relative value of water quality investments and stream ecosystem restoration in sites across the spectrum of degradation. Second, we will measure how the value of water quality and ecosystem restoration is affected by the context of where the streams are relative to current and past economic activity, especially jobs in pollution intensive industries versus other employment. Third, we will use measures of personal environmental attitudes, measures of ecosystem/degradation context, and measures of local economic context to develop a framework guiding the applicability for transfer of benefits to alternative sites not directly studied.
Progress Summary:
We have completed Phase 1: Site Selection and Sampling Phase. Currently, we are in the final stages of completing Phase 2: Focus Group and Survey Development phase of the project. We have continued to make revisions to our survey based on feedback obtained from several focus groups in the following locations: Syracuse, NY; East Greenbush, NY; Holyoke, MA; Bethlehem, PA; and Laureldale, PA. These discussions led us to a re-design of how we will present a distribution of river miles across water quality attributes. We plan to have at least two more focus groups to assist us in finalizing the survey instrument, particularly the presentation of the choice questions.
We have finalized our sampling strategy and have identified 20 counties to sample that are representative of three indices: index of Socioeconomic conditions, index of Ecological Integrity, and index of Pollution Economy. These indices were created for all 245 counties in our study region (MD, NJ, DE, PA, NY, CT, RI, MA, VT, NH, ME). We dropped island counties, counties with a population density greater than 2500 persons per square mile, and counties with less than 7000 households.
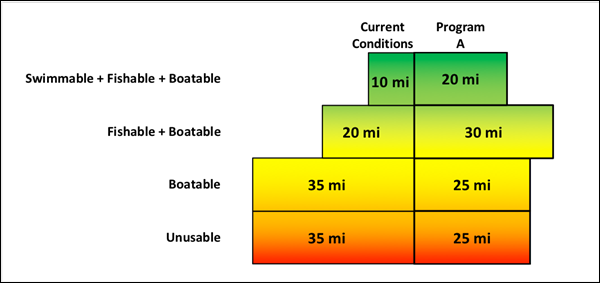
We have decided on the following attributes for our choice questions in the stated preference surveys to be administered in the next reporting period: the human use score, the ecological integrity score, and water clarity. Feedback from focus groups has provided us with valuable insight and resulted in changes to how the choice questions are presented, since many found intermediate approach difficult to evaluate. Instead of dials, we have decided to use separate bar graphs to represent the levels (number of river miles) in each water quality category used to describe alternative programs to be presented in choice questions (see Example Diagram for a sample focused on the human use score). We also believe these bar graphs do a better job of representing the distribution of miles across levels, something we have had difficulty communicating in the past. This design will also allow our choice experiment questions to capture the willingness to pay (WTP) for the full distribution of the water quality scale instead of only capturing the shift in the mean value of water quality improvement, which is common in existing studies.
Example Diagram:
Focus group discussions have continued to demonstrate that the choice of payment vehicle can play a significant role in producing individuals' Hicksian willingness to pay (WTP) for water quality improvements. To date, we have explored three payment vehicles, two modeled after how state and federal taxes have been used for real policy implementation and one modeled after Missouri's state constitutional amendments that strongly tie specific taxpayer funds for conservation through voter control. We believe that this payment vehicle will help to establish the theoretical conditions for measuring the maximum tradeoff (WTP) of respondents between money and water quality.
Future Activities:
We will proceed according to the timeline established by the previously approved no-cost extension. We are currently finalizing our survey and drafting a video to accompany our survey. We intend for the video to resolve questions posed by focus groups, assist with understanding the choice question design, and reduce the time participants will spend taking our survey. We will carry out data analysis will be carried out as initially planned and will take place after we finish the survey experiments.
Journal Articles:
No journal articles submitted with this report: View all 5 publications for this projectSupplemental Keywords:
ecosystem, regionalization, habitat, integrated assessment, public policy, decision making, community-based, conjoint analysis, observation, non-market valuation, contingent valuation, survey, preferences, public good, socioeconomic, willingness-to-pay, compensation, conservation, modeling, monitoring, analytical, surveys, measurement methodsProgress and Final Reports:
Original AbstractThe perspectives, information and conclusions conveyed in research project abstracts, progress reports, final reports, journal abstracts and journal publications convey the viewpoints of the principal investigator and may not represent the views and policies of ORD and EPA. Conclusions drawn by the principal investigators have not been reviewed by the Agency.