
Grantee Research Project Results
Final Report: Energy Node Locator Platform Development: Using Real-Time Monitoring to Conserve Energy
EPA Grant Number: SU835523Title: Energy Node Locator Platform Development: Using Real-Time Monitoring to Conserve Energy
Investigators: Alahmad, Mahmoud , Sharif, Hamid , Nguyen, Lim , Gilg, Katharine , Khan, Sameena , Wright, Geoffrey , Grindstaff, Jonathan , Peng, Yuye , Zulfiqar, Muhammad , Sordiashie, Evans
Institution: University of Nebraska at Lincoln
EPA Project Officer: Packard, Benjamin H
Phase: I
Project Period: August 15, 2013 through August 14, 2014
Project Amount: $15,000
RFA: P3 Awards: A National Student Design Competition for Sustainability Focusing on People, Prosperity and the Planet (2013) RFA Text | Recipients Lists
Research Category: Pollution Prevention/Sustainable Development , P3 Awards , P3 Challenge Area - Air Quality , P3 Challenge Area - Sustainable and Healthy Communities , Sustainable and Healthy Communities
Objective:
Efforts to provide energy information at varied granularity through energy feedback interventions have been at the forefront of conservation research for the past 40 years. Previous energy consumption monitoring has used either a top-down or bottom-up approach, depending on the granularity of information desired and the level of detail required. This information is important because 30 percent of the primary energy is consumed by miscellaneous electrical loads (MELs), which are defined as all nonmain electrical loads and include a variety of electrical and electronic devices. MELs constitute an increasingly large percentage of building energy use, in part due to the increasing number and variety of devices available as well as advances in the energy efficiency of main building loads. Studies have shown that up to 35 percent of MELs can be saved, but in order to achieve these savings, monitoring, smart measurements and tools at the node level are needed to better understand these loads. In the current state of the art, real-time information at the electrical outlet level (bottom-up approach) is obtained by deploying power meters and/or sensor networks at every electrical node. Given the number of devices as well as the labor needed for deployment, the strategy is very expensive and impractical but results in the collection of the most detailed information needed for MEL savings. At the other extreme is the least expensive collection strategy, in which aggregate data on the total building consumption are collected at the building’s main electrical service (top-down approach), and the detailed consumption information (e.g., the specific location of the energy consumption) is estimated. A compromise between both options is to install meters at the electrical panel and/or at the circuit breaker level within the electrical panels.
To improve the energy efficiency and economic security of the U.S. built environment, we are developing a technology termed the Live Energy Finder (LeEF). LeEF is the first integrated hardware/software technology that can remotely monitor and locate every active energy node in the electrical distribution network in real time without the need for sensors and monitoring devices to be placed at every electrical node. The LeEF system is comprised of three main components: (1) a circuit-level energy node locator that physically locates active nodes in the electrical system; (2) a circuit-level energy monitor that provides aggregate energy consumption data; and (3) a management unit that manages the collected data and identifies the consumption location for each physical node in the branch network.
The specific objectives are to:
- Identify, model, simulate and demonstrate various building electrical systems.
- Model and simulate the principles of the circuit-level energy node locator.
- Design, develop, build and demonstrate a prototype of the circuit-level energy node locator.
- Evaluate the effectiveness of the technology in terms of its ability to remotely identify active energy-consuming nodes.
- Conduct a hands-on demonstration of the proof-of-concept system in a classroom setting.
Summary/Accomplishments (Outputs/Outcomes):
The proposed outputs are: (1) models and simulations for electrical systems in buildings; (2) signal (SSTDR) models for adoption in the electrical system for real-time monitoring; (3) a prototype board to demonstrate the circuit-level energy node locator system; and (4) an educational component for the University of Nebraska–Lincoln and the community. The following summary discusses the main results obtained.
A prototype board (from a previously funded EPA People, Prosperity and the Planet [P3] competition) has been modified with various components, equipment and tools to test, evaluate, model and validate the research aspect of this project. Figure 1 shows the completely set up system.
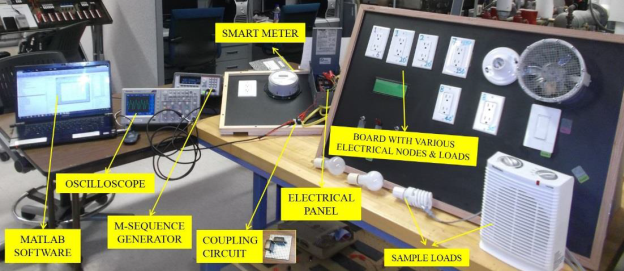
Figure 1. Testing platform for the proposed energy finder.
An electrical signal is developed and coupled on the live electrical network using well-established tools from power line communication. We investigated capacitive and inductive coupling techniques to couple the signal and developed a preliminary capacitive coupling circuit (Figure 2).
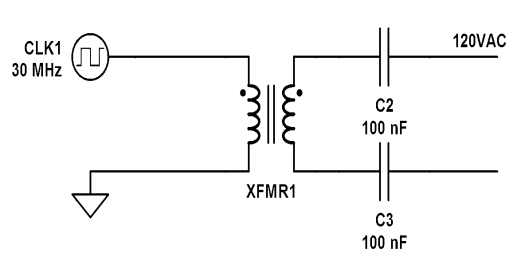
Figure 2. Capacitive coupling circuit option.
Live wire tests were performed on a single bus, two-circuit configuration, as shown in Figure 3. The coupling circuit was connected to the first circuit, which had one node (outlet) located at 110 feet from the actual circuit break location. The second circuit had two nodes. The first node was located at 45 feet, and the second node was located at 70 feet from the actual circuit break location. Several experiments were performed to identify the behavior of the correlated output for different load connection combinations. Table 1 lists the possible combinations of load connections that could be performed. The table demonstrates the types of loads and configurations used.
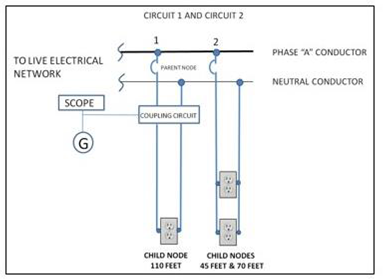
Figure 3. Two electrical circuit breakers with three nodes setup.
| Table 1. Various Live Wire Experiments Performed to Determine System Capabilities | |||
|---|---|---|---|
| Case No. | Circuit 1 | Circuit 2 | |
| Node 1 (110 feet) | Node 1 (45 feet) | Node 2 (70 feet) | |
| 1 | Laptop Charger | ||
| 2 | 60 W Incandescent | OPEN | |
| 3 | OPEN | 60 W Incandescent | |
| 4 | 60 W Incandescent | 60 W Incandescent | |
| 5 | Laptop Charger | OPEN | OPEN |
| 6 | OPEN | 60 W Incandescent | OPEN |
| 7 | OPEN | OPEN | 60 W Incandescent |
| 8 | OPEN | 60 W Incandescent | 60 W Incandescent |
| 9 | 60 W Incandescent | 60 W Incandescent | OPEN |
| 10 | 60 W Incandescent | OPEN | 60 W Incandescent |
| 11 | 23 W CFL | 60 W Incandescent | Fan |
Figure 4 represents one electrical circuit and two nodes with all cases shown. The common peak is close to 72 feet. Case 2 represents load connection at 40 feet only, and the curve exhibits two peaks, with the highest peak being at 46.93 feet. Case 3 represents load connection at 70 feet only, and the curve shows one high peak at 72.04 feet. Case 4 represents load connection at both 40 feet and 70 feet. The curve has two peaks like that of Case 2, but the highest peak is at 72.71 feet. Therefore, a circuit with two nodes can be distinguished based on curve characteristics.
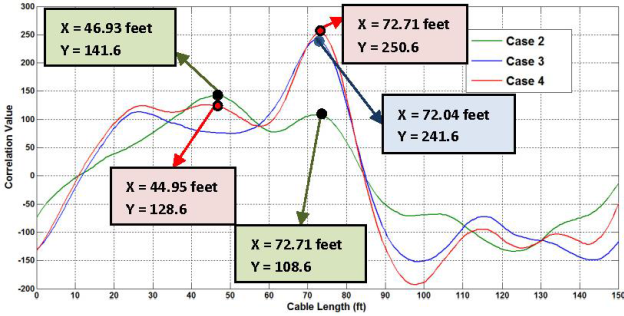
Figure 4. Possible connections outcomes for a circuit with two nodes.
Conclusions:
In Phase I, the research team has successfully developed a proof-of-concept of the circuit-level energy node locator, a critical component of the LeEF technology development proposed for Phase II. Specifically, the research team modeled the electrical system in a format that allows for modeling and simulation to take place. Then, using a combination of hardware components and software tools, the team developed the signal that needs to be injected into the electrical system of a typical building. To inject this signal, the team investigated methods while maintaining the safety and reliability requirements of the electrical systems and developed a capacitive coupling circuit that meets all code requirements. The team then developed a prototype board representing a real building electrical system in order to test the system. To identify the location of where consumption is taking place in real time, experiments were conducted to validate the components of the system and test the capabilities and limitations of the injected and retrieved signals.
According to our preliminary cost analyses in Phase I, the proposed project goal of developing a complete LeEF technology will impact the environment by reducing greenhouse emissions. A total overall energy savings of 20 to 30 percent is forecast as the technology is implemented in buildings. In addition, the savings are estimated at an average of $12,110 for a typical 50,000-square foot office building per year. The technology can realistically be implemented in as many residential and commercial facilities as are available. It is likely that the technology will create a disruption in the market, creating a learning curve that eventually will phase out more costly monitoring technologies and outperform market competitors. To accomplish this goal, the next phase of the project (Phase II) will focus on the platform to develop the technology.
Journal Articles:
No journal articles submitted with this report: View all 4 publications for this projectSupplemental Keywords:
energy, energy conservation, monitoring resource consumption, built environment, smart buildings, electricity consumptionThe perspectives, information and conclusions conveyed in research project abstracts, progress reports, final reports, journal abstracts and journal publications convey the viewpoints of the principal investigator and may not represent the views and policies of ORD and EPA. Conclusions drawn by the principal investigators have not been reviewed by the Agency.