
Grantee Research Project Results
Final Report: Renewable Energy-Powered Bulk Milk Cooling for Smallholder Dairy Farmers
EPA Grant Number: SU836006Title: Renewable Energy-Powered Bulk Milk Cooling for Smallholder Dairy Farmers
Investigators: Kisaalita, William S. , Rush, Bryan , Ndyabawe, Kenneth , Ssonko, Richard
Institution: University of Georgia
EPA Project Officer: Page, Angela
Phase: II
Project Period: August 15, 2011 through August 14, 2012 (Extended to August 14, 2014)
Project Amount: $75,000
RFA: P3 Awards: A National Student Design Competition for Sustainability Focusing on People, Prosperity and the Planet - Phase 2 (2011) Recipients Lists
Research Category: Pollution Prevention/Sustainable Development , P3 Awards , P3 Challenge Area - Air Quality , P3 Challenge Area - Sustainable and Healthy Communities , Sustainable and Healthy Communities
Objective:
n a first step toward the solution, we successfully reengineered an evaporative cooler (based on vacuum and zeolite adsorption cooling technology) in collaboration with a Germany company and made it applicable to milk cooling at the smallholder level. Through a World Bank Development Marketplace grant, we deployed (or field tested) this cooler among Ugandan smallholder dairy farmers and it received a very favorable response. This cooler was designed for cooling a maximum 15.5 liters, however, our field experience suggesting that there was a need for higher capacity (e.g., 50-100 liters) for smallholder farmers with a larger number of cattle (e.g., over 6 cows). In phase I P3 Award, we design the second generation renewable-energy (biogas) powered milk cooler, fabricated a first prototype and evaluate its performance with respect to cooling to 8 oC within 4 hours. Data from participating students was incorporated in a database of other students that have worked on similarly structured projects with the goal of establishing the learning outcome of these types of projects. The preliminary analysis shows that the participating students are likely in the future to make decisions in and outside their professional practice that are consistent with sustainability. Therefore by the end of Phase I funding period, we had completed the construction and testing of the cooler, as well as established the optimal temperature at which the zeolite is completely regenerated. In Phase II (this report), we proposed the following follow-up objectives:
- Construct and start-up a cow-dung anaerobic digester and demonstrate that the regeneration of zeolite can be accomplished under these field condition.
- Install a second generation renewable-energy (biogas) powered milk cooler on the partner (Smallholder Fortunes) dairy farm and show that the cooling achieved in the laboratory (to 8 oC within 4 hours) can be replicated under these field conditions and establish the cooling cost per liter of milk.
- Establish the greenhouse gas (methane) production from smallholder farm cow dung open pits. This will enable a more accurate estimate of difference in greenhouse gas – methane - emission due to wide spread cooler use.
Summary/Accomplishments (Outputs/Outcomes):
Objective 1: Construct and start-up a cow-dung anaerobic digester to produce biogas and demonstrate that the regeneration of zeolite can be accomplished under this field condition.
Table 1. Summary of comparison of anticipated and actual achievements under Objective 1
| Task | Anticipated accomplishment | Actual accomplishment |
| Construct and start-up a 24 m3 cow-dung digester and couple it to a regenerator (oven) | Optimal performance –producing biogas of approximately equal to the working volume of the digester | Achieved |
| Install the cooler (zeolite regenerator) and test its performance | Maintain temperature of approximately 200 oC for at least 3 hours with biogas | Achieved |
We pointed out in the previous annual report that instead of constructing a 24 m3 digester (CAMARTC design); we decided to repurpose 10 m3 polyethylene water tanks that are readily available in Uganda. The second motivation for this change was problems experienced with sealing the top of the water tank to achieve anaerobic conditions. Because of the high pressures that are generated, we went through two seal designs that all failed in the field. We solved the problem by using two polyethylene water tanks; one 10 m3 in the ground and one 8 m3 inverted face down into the larger tank (Figure 1). As biogas is produced, the small tank rises and the gas is withdrawn via a valve operated tap on top.
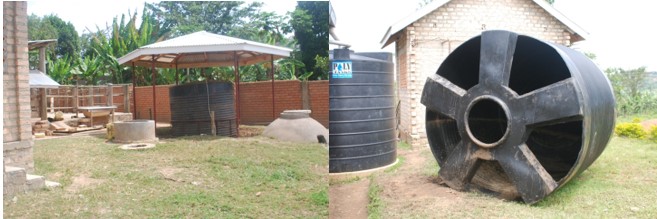
Figure 1. The two polyethylene water tanks digester. On the left, under the canopy, the larger tank (10,000 liters) is in the ground; its top was cut off and the small tank (8,000 liters) top was cut as shown on the right and lowered into the larger tank upside down. Under the canopy, the small tank is raised by the pressure of biogas being produced. The flexible tubing that is connected on a valve through which biogas is piped to a burner in the nearby demonstration building is visible. Biogas production is measured by multiplying the tank rise by the digester cross-section area and normalized with feed volume.
As shown in Figure 1. This design is being successfully operated at Smallholder Fortunes facility. The gas is used for cooking and milk cooling experimentation. A retention time of 50 days is used and when the digester stabilizes, gas production ranges from 0.7 to 1.0 of the optimal productivity of 5.3 m3 per day. Smallholder Fortunes is not operating fully as a zero-grazed farm; the cows are released in the day to feed on the grass in the compound and the cow-dung of the day is lost in the field. We had to rely on the night cow-dung and urine, which in some instances was not adequate for the needed 210 liters (1:1, dung: water/urine by volume) to optimally feed the digester. This explains our less than optimal biogas production.
As we indicated in the previous report, we had anticipated the prototype being ready to test in Uganda by December, 2012. We were unable to achieve this goal as it had taken longer to design and test the second component of the system, the zeolite generator. Experiments to determine the optimal temperature for zeolite regeneration of 200oC were determined with a high temperature oven, acquired during Phase I.

Figure 2. Zeolite plates regenerator. Left: showing hot gas inlet from the sides; the bottom inlet is not show. Middle: showing the zeolite plates’ placement. Right: showing the “chimney” and powering from propane. In the field, propane will be replaced by biogas.
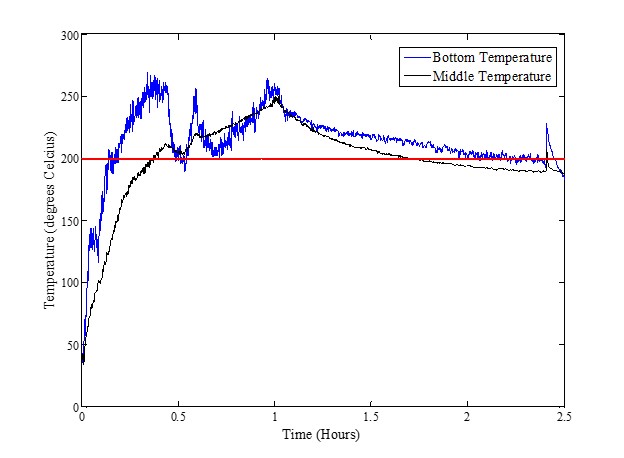
Figure 3. Temperature profile in the regenerator at two locations (bottom and middle). The regeneration temperature of 200 oC was maintained with manual control of propane flow for two hours. Typical temperature profiles at two locations: bottom (blue, 10 cm from bottom of chamber), middle (black, 21.25 cm from bottom of the chamber), and top (green, 31.5 cm from bottom of the chamber – not shown

Figure 4. Regenerator constructed in Uganda at smallholder Fortunes Facility powered by biogas. Left shows the regenerator constructed with clay bricks. Right-top shows two burners (2 mm and 4 mm holes) that were experimented with. Right-bottom showing the chimney, cage for zeolite plates and the burner connected to the biogas supply tubing.
The regenerator design (Figure 2) was tested with propane and as shown in Figure 3, the temperature of 200oC was achieved. To ascertain that biogas will work well, we constructed a similar regenerator in Uganda at Smallholder Fortunes facility as shown in Figure 4. As with propane, the 200 oC temperature was achieved (Figure 5).

Figure 5. Temperature profile in the regenerator at three locations (bottom, middle, and top). The regeneration temperature of 200 oC was maintained with biogas for three hours of operation.
Key features of the design included the unique hot gas flow we achieved with the use of a “chimney” in addition to insulation. As shown in Exhibit 1 below, the biogas consumption was determined to be approximately 2 m3 at one atmosphere and room temperature. Two burner designs (2 and 4 mm holes) were tested. The 2 mm burner was more efficient as it achieved higher temperatures with lesser biogas consumption (Exhibit 1).
Exhibit 1. Summary of biogas consumption by the regenerator
| REGENERATOR RUN & BURNER SIZE. | DROP IN TANK HEIGHT (H in m). | VOLUME ( |
| Run 2A – 2mm | 0.47 | 1.73 |
| Run 2B – 2mm | 0.46 | 1.72 |
| Run 4A – 4mm | 0.49 | 1.81 |
| Run 4B – 4mm | 0.51 | 1.89 |
 m3
m3With the 2 mm burner, the hourly consumption of biogas was 0.435 m3.
Objective 2: Install a second generation renewable-energy (biogas) powered milk cooler on a small-scale dairy farm and show that the cooling achieved in the laboratory (to 8 oC within 4 hours) can be replicated under field conditions and establish the cooling cost per liter of milk.
Table 2. Summary of comparison of anticipated and actual achievements under Objective 2
| Task | Anticipated accomplishment | Actual accomplishments |
| Fabricate a second generation cooler and ship it to Uganda, install the cooler and test its performance | Cool milk to 8 oC within 4 hours | A decision was made to locally fabricate the cooler, just as was done for the regenerator. It was not possible to test the locally made cooler because of the high humid environment that result in regenerated zeolite adsorbing water from the environment reducing its effectiveness. |
| Operate the cooler in rainy and dry seasons and determine the cooling cost per liter of milk. | Accurate estimation of cooling cost per liter of milk | Based on low success from the above task, this task was not implementable. |
Delays were experienced with the local fabrication of the cooler due to limited technical skills. The no-cost extension granted was helpful. Unfortunately, the performance of the cooler was poor (to 12 oC in four hours). Closer examination showed that the zeolite in highly humid environments adsorbs water from the atmosphere, reducing its effectiveness during cooling. Ability to operate a zeolite evaporative cooler in such environments calls for a sealed desiccator-like storage of the zeolite plates. This added feature complicates the ability of smallholder farmers operating the cooler. Funding from USAID is being used to explore an alternative cooler design as discussed in Section IV below. Without regular cooling, it was not possible to address a component of the objective - to establish the cooling cost per liter of milk.
Objective 3: Establish the greenhouse gas (methane) production from smallholder farm cow dung open pits. This will enable a more accurate estimate of difference in greenhouse gas-methane - emission due to wide spread cooler use.
Table 3. Summary of comparison of anticipated and actual achievements under Objective 3
| Task | Anticipated accomplishment | Actual accomplishments |
| Measure open cow-dung pit biogas (methane) production | Estimation of greenhouse gas methane emission from open cow-dung pits and its mitigation due to use of the biogas-powered cooler | Actual measurements of methane production over a long period of time were not completed. Total gas production from a pit simulation was measured after three months of operation and used to estimate the reduction in carbon foot print due to use of biogas-powered cooler use of approximately 68.4%. |
As indicated in the previous report, the original experimental design that called for work on many smallholder farms was too ambitious for the budget level. The work under this objective was restricted to piloting procedures and generating preliminary data that will be used in support of a larger proposal for a wider study. The scope was limited to a simulated cow-dung pit (1 m2 surface by 1.5 m deep) at Smallholder Fortunes farm (Figure 6).
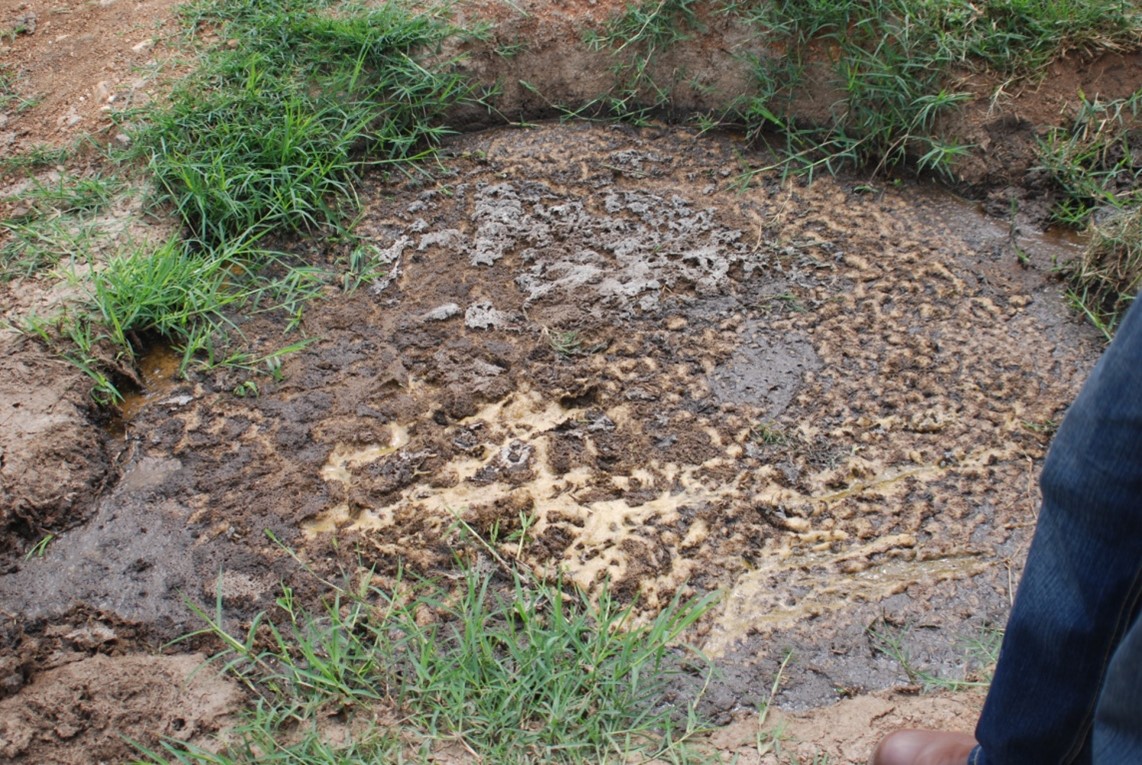
Figure 6. Cow-dung pit simulation used in biogas release measurements. The pit was seeded with 200 liters of digester effluent and was left to “settle” and “bubble” for three months before biogas measurements were conducted.
Tubes, 4 cm in diameter released the gas in inverted water-containing chambers that trapped the emitted biogas. The tubes were placed at three locations (middle, edge and in between) and biogas was collected for one week, three months after the pit initiation. The pit was inoculated with 200 liters of digester effluent to accelerate the bubbling. The total biogas (1.19, 0.43 and 0.51 liters/week) was averaged per unit surface area (0.71 liters/4x3.14)/7days = 0.0081 liters/cm2.day. Pit biogas production came to 10,000 cm2 x 0.0081 liters/cm2.day = 81 liters biogas per 1.5 m3 pit per day. But a 1.5 m3 anaerobically operated digester is expected to produce 800 liters of biogas per day. Therefore the pit biogas production came to approximately 10% of the equivalent fully anaerobically operated digester production. Unfortunately the CO2/CH4 break down of the biogas was not measured. The portable device procured in the USA could not be transported to Uganda, because the calibration gases are considered hazardous and cannot be airfreighted. The source of calibration gases identified from a South African supplier was no longer carried. The foot print reduction calculation below assumes the typical 40%/60% CO2/CH4 distribution.
We make a reasonable assumption of three zero-grazed heads of cattle per household (Menya et al., 2013) and each cow producing 35 liters of wet dung per day (~ 8 kg dry weight per day/0.23 fresh weight fraction; Lam and Heegde, 2010). With zero-grazing, all the dung and urine produced by the cattle are captured. To feed a digester, it is standard practice to dilute the cow-dung with water and/or cow-urine at a one to one ratio (by volume). Assuming a hydraulic retention time (HRT) of 50 days, the total digester working volume comes to:
3 cows x 35 liters dung/cow.day x 2 (dilution) x 50 HRT in days = 10,500 liters or 10 m3
We assume a 10 m3 digester, properly operated, which should produce 5.3 m3 biogas per day at room temperature and one atmospheric pressure (210 liters of feed slurry/day x 25 liters of biogas/liter of feed: 3 cows x 35 liters of wed dung/cow x 2 (dilution) = 210 liters of feed slurry/day; 25 liters of biogas/liter of feed slurry at 50 days HRT and 30 oC determined from a chart in Lam and Heegde, 2010). Biogas is usually made up of 40% and 60% CO2 and CH4, respectively. Based on densities of CO2 and CH4 of 1.87 and 0.68 kg/m3, respectively, each m3 of biogas is made up of 0.748 kg CO2 (0.4 volume fraction x 1.87 kg CO2/ m3) and 0.404 kg CH4 (0.6 volume fraction x 0.680 kg CH4/m3). With the following complete combustion:
CH4 (gas) + 2O2 (gas) → 2H2O (vapor) + CO2 (gas) + Energy (light/heat), and molecular weights of 16 g/mol CH4 and 44 g/mol CO2 , the 0.408 kg/m3 CH4 calculated above yield 1.122 kg CO2 (0.408 kg x 44/16). Total CO2 from a m3 of biogas comes to 0.748 + 1.122 = 1.87 kg CO2. Each smallholder farm produces 9.9 kg CO2 per day (1.87 kg CO2/m3 x 5.3 m3 biogas per day).
Milk cooling with biogas requires approximately 2 m3 of biogas per day (from Exhibit 1 above) with the balance available for cooking and/or lighting. Since the balance is not enough to meet the cooking and lighting needs of the household, it is most likely to be applied toward cooking, because this is the most time and energy consuming activity. The energy content of 3.3 m3 biogas is 19.8 kWh (6 kWh/m3 biogas x 3.3 m3 biogas). According to Lam and Heegde (2010), the calorific values of wood is 5.0 kWh/kg; The biogas balance replaces 4.0 kg of firewood, which is approximately 33.3% of a typical consumption of a smallholder household in Western Uganda (Naughton-Treves et al., 2007). More cows and therefore a higher capacity digester would be needed for increasing the percentage of firewood that is replaced by biogas. According to DEFRA (2012), the carbon emission of wood is 0.0782 kg CO2 per kg wood, suggesting that 0.31 kg (4.0 kg firewood per day x 0.0782 kg CO2 per kg wood) of CO2 emission is abated due to replacement of some of the firewood by biogas. However, as already calculated, cooking with or burning the 3.3 m3 per day emits 1.87 x 3.3 = 6.2 kg CO2, which is higher than the CO2 from equivalent firewood. The motivation to replace firewood with biogas rests with other benefits such as reduced deforestation/biodiversity degradation and reduced respiratory diseases. So the carbon footprint reduction as a result of biogas adoption comes from direct CH4 emission from cow-dung piles abatement, as demonstrated in the following paragraph.
The model smallholder dairy farming household without a digester typically piles up the cow dung and lets it sit till ready for application to crops as fertilizer. We assume, only 10% of the cow dung participates in producing biogas that is released to the atmosphere. This assumption is based on preliminary measurements presented above from a cow dung pit simulation under farm condition. Based on the size of the pit, biogas production was approximately 10% of what it would be if a digester with a similar capacity was operated as a fully anaerobic digester. Given that the GHG effect of CH4 is 23 times that of CO2 (Hansen et al., 2006), we use this multiplier factor to convert the amount of CH4 released into the atmosphere to its CO2 equivalent. Each m3 of cow dung pit biogas released is equivalent to 10.132 kg CO2 (0.748 kg CO2/m3 biogas + 23 kg CO2 equivalent/ kg CH4 x 0.408 kg CH4/m3 biogas). To account for the 10% anaerobic performance of the pit, we multiply this figure with 1.0 (10% x 10 m3 equivalent digester capacity – the household without the digester/cooler handles the same amount of cow-dung in pit(s) as their counterpart with the 10 m3 digester). Adding the CO2 from the firewood energy of 0.31 kg, that is not abated, yields a total of 10.442 kg CO2 per day. Therefore the introduction of a digester-cooler combination reduces the model smallholder household energy consumption CO2 footprint by 68.4% [(10.442-6.2)/6.2].
Conclusions:
We have used the three-cow smallholder household as the model to demonstrate the impact of the adoption of the cooler/digester combination on the energy footprint. As the calculation reveals, the 2 m3 needed for cooling milk leaves a small amount of gas to replace only a third of the firewood used as energy source for cooking. We recommend a larger capacity digester to at least replace 70% of the firewood. To achieve this biogas productivity will require doubling the number cows to 6 or including other substrates such as pig waste, poultry waste, or agricultural residues.
The catch with zeolites is that the high water adsobers are needed for high cooling efficiency, but the same material adsorbs water from the environment fast to the extent that by the time it is used in the cooling process, its performance is compromised. This problem was not anticipated. We have considered adding a storage containment that will exclude moisture, but this approach further complicates the operation, and will likely be a source of dissatisfaction with the technology. We are considering an alternative technology of evaporative cooling that will use water-ammonia as the refrigerant as opposed to just water. This technology is not new, but configuring a device that will be deployed among smallholder households calls for unique engineering for operation simplicity.
The change in carbon footprint analysis presented is limited to a baseline carbon foot print that results from cooking with firewood in addition to piling cow dung on the farm that emits CH4 in the atmosphere. Other sources, such as kerosene for lighting are not included as they are the same for the households compared. The major uncertainty in this analysis comes from the equivalent percentage of the cow dung in the pit that produces biogas or undergoes anaerobic fermentation. The variation in the pit sizes and management practices results in widely varying emissions. To increase confidence, baseline studies similar to that of Yacob et al. (2005) are needed. The clean energy use benefits of slowed deforestation, plant-animal diversity degradation, and enhanced health are not easy to capture in this type of analysis, but should be kept in mind in this type of narrative, because they are the key motivating factor in encouraging the adoption of clean energy biogas by smallholder households.
We are pleased to announce that we secured a three-year $1,000,000 grant from USAID to pursue the tasks we were not able to get to with the EPA funding, as well as the recommendations made herein. In the first year we have been laboratory-testing the ammonia-water evaporative cooler and we will be field-testing it among 50 smallholder farmers in Wakiso district of Uganda in the New Year. If the testing goes well, we will transition the project to a business in the last year of the grant, by locally manufacturing the units and scaling to other districts.
References:
- DEFRA 2012 Guidelines to Defra/DECC’s GHG Conversion Factors for Company Reporting (https://www.gov.uk/government/uploads/system/uploads/attachment_data/file/69554/pb13773-ghg-conversion-factors-2012.pdf).
- Dherani, M., Pope, D., Mascarenhas, M., Smith, K.R., Weber, M. and Bruce, N. 2008. Indoor air pollution from unprocessed solid fuel use and pneumonia risk in children aged five year: a systematic review and meta-analysis. Bulletin of the World Health Organization 86(5): 390-398.
- Hansen, L., Sommer, S.G., Gabriel, S. and Christensen, T.H. 2006. Methane production during storage of anaerobically digested municipal organic waste. Journal of Environmental Quality 35:830-836.
- Lam, J. and Heegde, F. ter 2010. Reader for the Compact Course on Domestic Biogas technology and Mass Dissemination, SNV.
- Meya, E., Alokore, Y. and Ebangu, B.O. 2013. Biogas as an alternative to fuel wood for a household in Uleppi sub-county in Uganda. Agric Eng Int: CIGR Journal 15(1):50-58.
- Naidoo, R. and Adamowicz, W.L. 2005. Economic benefits of biodiversity exceed costs of conservation at an African rainforest reserve. Proceedings of the National Academy of Science USA 102(46):16712-16716.
- Namaalwa, J., Hofstad, O. and Sankhayan, P.L. 2009. Achieving sustainable charcoal supply from woodlands to urban consumers in Kampala, Uganda. International Forestry Review, 11(1):64-78.
- Naughton-Treves, L., Kammen, D.M. and Chapman, C. 2007. Burning biodiversity: Woody biomass use by commercial and subsistence groups in western Uganda forests. Biological Conservation 134(2):232-241.
- Ndyabawe, K. and Kisaalita, W.S. 2014. Diffusion of an evaporative cooler innovation among smallholder dairy farmers of Western Uganda. Technology in Society 38:1-10.
- Pandey, B., Subedi, P.S., Sengendo, M. and Monroe, I. 2007. Biogas for Better Life: An African Initiative. Report prepared for the Dutch Ministry of Foreign Affairs. Winroch International.
- Rehefuess, E.A., Tzala, L., Best, N., Briggs, D.J. and Joffe, M. 2009. Solid fuels use and cooking practices as a major risk factor for ALRI mortality among African children. Journal of Epidemiology and Community Health 63(11):887-892.
- Yacob, S., Hassan, M.A., Shirai, Y., Wakisaka, M. and Subash, S. 2005. Baseline study of methane emission from open digesting tanks of palm oil mill effluent treatment. Chemosphere 59:1575-1581.
Journal Articles on this Report : 1 Displayed | Download in RIS Format
| Other project views: | All 5 publications | 1 publications in selected types | All 1 journal articles |
|---|
| Type | Citation | ||
|---|---|---|---|
|
|
Ndyabawe K, Brush R, Ssonko RE, Kisaalita WS. Biogas-powered evaporative cooling for smallholder dairy farmers’ evening milk:zeolite characterization and regeneration. Sustainable Energy Technologies and Assessments 2019;34:126-132. |
SU836006 (Final) |
Exit |
Supplemental Keywords:
Poverty-alleviation, Prosperity-building, Planet-sustaining, Service-learning, STEM (science, technology, engineering, and mathematics), Social entrepreneurship, Food security, Sub-Saharan Africa, Sustainable development, Environmental sustainability, Smallholder or small-scale or small-acreage farmers, Diffusion of technological innovations, Renewable energy or biogas, Change-making, Study abroad, Rural studiesProgress and Final Reports:
Original AbstractP3 Phase I:
Renewable Energy-Powered Bulk Milk Cooling for Smallholder Dairy Farmers | Final ReportThe perspectives, information and conclusions conveyed in research project abstracts, progress reports, final reports, journal abstracts and journal publications convey the viewpoints of the principal investigator and may not represent the views and policies of ORD and EPA. Conclusions drawn by the principal investigators have not been reviewed by the Agency.