
Grantee Research Project Results
Final Report: Cost Effective Seawater Desalination with FICP Element Arrays
EPA Contract Number: EPD13043Title: Cost Effective Seawater Desalination with FICP Element Arrays
Investigators: Frudakis, Tony
Small Business: Okeanos Technologies, LLC
EPA Contact: Richards, April
Phase: II
Project Period: July 29, 2013 through July 28, 2015 (Extended to July 28, 2016)
Project Amount: $292,350
RFA: Small Business Innovation Research (SBIR) - Phase II (2013) Recipients Lists
Research Category: Small Business Innovation Research (SBIR) , SBIR - Drinking Water Treatment and Monitoring
Description:
Our project, focused on scaling Electrochemically Mediated Desalination (EMD) for commercial application, has produced a succession of 8 prototype designs, each built upon lessons learned from the last. We built a test-bed system to test our designs that controlled and measured flow rates, power applied, pH, pressure, temperature etc. Various design configurations and materials choices were tested. Our V8 device achieved reliable desalination of Iodide (100mM) fortified artificial seawater solutions (see 2nd page, Prototype Report) and intermittent (observed twice) 4% desalination of unfortified natural seawater solution mimics. Our higher flow rate V7 device appears to operate similarly but at lower levels overall. Though we have been unable to achieve reliable desalination of natural, unfortified seawaters and we now believe the original EMD manuscript drafted and published by our former academic partners was erroneous, our work over the past 4 years and 8 prototype designs have illuminated what the likely problems were with this paper and how they can be ameliorated with a different but related electrochemical approach/design. Our hypothesis is that reliable natural seawater desalination will become possible upon adaption of this new approach/design we call MPMD and we are presently in the process of raising capital to continue our work building the first MPMD cartridges for testing.
Design of V8.X Prototypes:
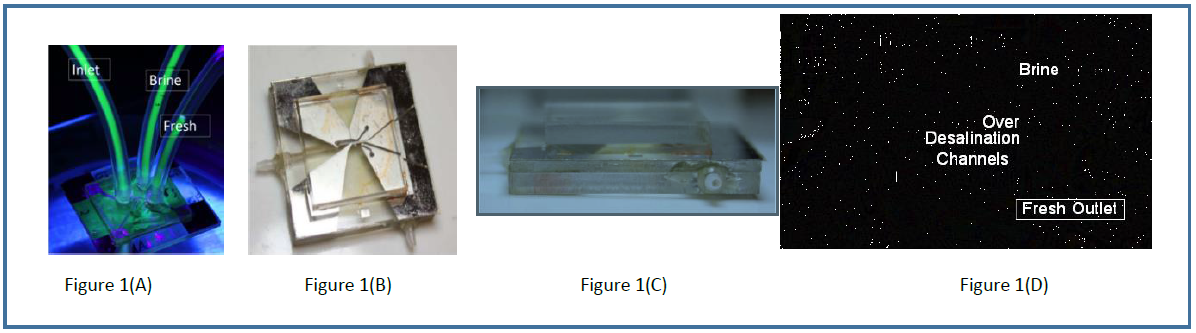
Figure 1 illustrates views of (A) Okeanos’ V8.1 and (B-D) V8.2 prototype modules. The two prototype modules include (1) a polymer support, (2) a layer of photoresist in which the inlet, brine and fresh outlet channels, and an array of N (here, N=20) desalination channels were photolithographically defined, (3) platinum cathodes in the inlet, brine outlet, and fresh outlet channels, (4) a platinum anode disposed over the top part of the array of desalination channels, and (5) a polymer overlayer that seals water within the channels. In V8.1, inlet and outlet ports are in the overlayer, whereas in V8.2 the inlet and outlet ports are on the sides of the support. In the image of V8.1 (Figure 1(A)), artificial seawater spiked with fluorescent marker (fluorescein, 0.8μM) is flowing through the channels with no voltage applied. The test results herein were all obtained using V8.2 operating in normal polarity where for each channel, chloride oxidation takes place at the entrance.
Fluorescent Marker Depletion and Enrichment:
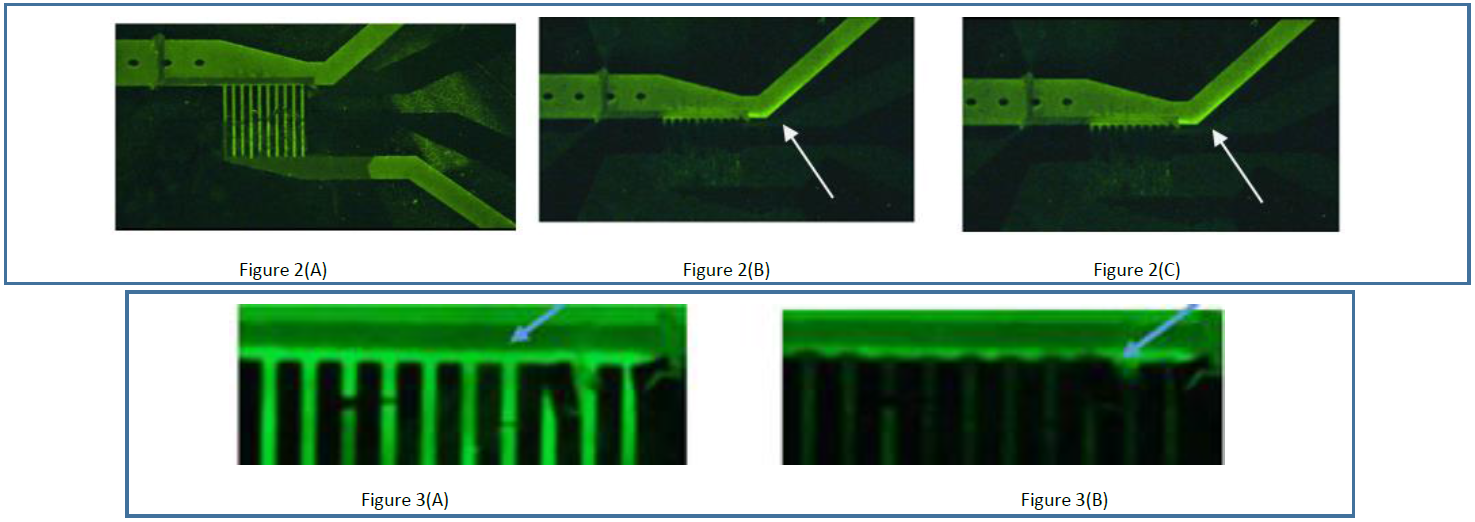
These qualitative tests demonstrate that different portions of the V8.2 prototype module cause the expected increase or decrease of the fluorescent marker that serves as a visual proxy for salt. In these tests, artificial seawater (500mM NaCl, pH 8.2) spiked with the fluorescent marker was flowed through V8.2. The feedstock flow rate was 12.5 times (1 μL/min) that of the original Y-shaped device published in 2013 by Knust et al. Figure 2(A) shows the prototype module before the application of voltage (0V); it can be seen that the marker is equally distributed among the feedstock inlet, the anodic desalination channels, and the downstream brine and fresh stream outlet channels. Areas that show brighter green at 0V are those with metallic surfaces serving as a background reflectant – cathode above and below the desalination channels and anode within the desalination channels – less bright spaces in between are insulating boundaries without the metallic, reflective background. Figures 2(B-C) show the prototype module upon application of 1.7V between the anode and cathode in two separate runs; the marker intensity is significantly diminished within the desalination channels, and becomes enriched immediately above and downstream of the desalination channels (for the latter, see white arrows pointing to bright regions near corner between inlet and brine outlet). Diminution and enrichment were observed not to occur at potentials below 1.4V, corresponding to the redox potential of chlorine.
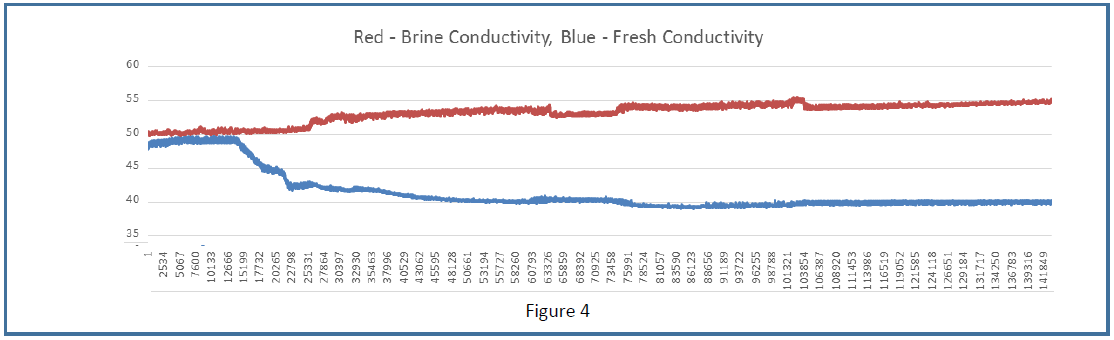
Closer inspection of the top of the desalination channels between the anode and cathode immediately (within 5 seconds) after the application of voltage and before the enrichment effect is fully realized, shows the contours of the ion depletion zone within which chloride oxidation is taking place (compare Figure 3(A) at 0V to Figure 3(B) at 1.7V). While fluorescein is subject to bleaching effects caused by chloride oxidation, bleaching cannot be used to explain fluorescein enrichment immediately above and downstream of the pores in the brine stream, and as with the 2013 Knust et al. publication, this type of result is indicative of desalination.
Conductivity Analysis:
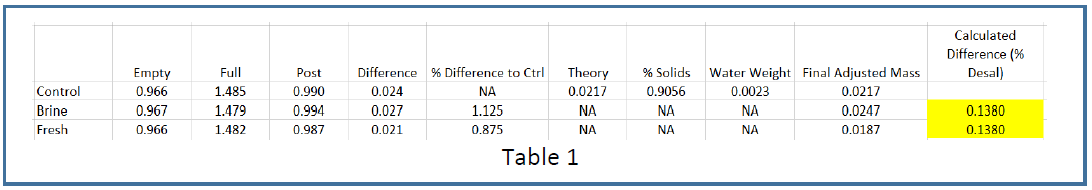
Conductivity plots were generated using artificial seawater feedstock (pH 8.2), a V8.2 prototype module, and measuring the conductivity of the fresh and brine product water output by the module using in-line, flow-through conductivity sensors. Figure 4, obtained on September 14, 2015 is representative of results from multiple runs carried out in the months of August and September 2015. The average between the brine conductivity increase and fresh conductivity decrease relative to prepower levels (0-12,000 seconds) corresponds to 15% desalination. Desalination results shown here are carried out at an energy expenditure of about 37mWh/L. In Figure 4, voltage was applied beginning at t=0 seconds. The dead space volume between anode and fresh water conductivity sensor is about 100L and the fresh water flow rate used for this run was 0.5 μL/min, so we calculate the time required for desalinate to reach the fresh water conductivity sensor to be about 12,000 seconds from the application of voltage. This is precisely what was observed (slightly different expectations and results for the brine stream). The difference in the magnitude of brine stream conductivity rise versus fresh stream conductivity drop is due to the fact that at the low potentials used here (and neutral pH), more gas evolution is expected in the brine stream, where the cathode is producing hydrogen, compared to the fresh stream. The effect of this gas in the brine stream is to reduce the conductivity, counteracting the rise in conductivity caused by increased salinity. In the fresh stream, if higher potentials are used, water oxidation and oxygen evolution at the anode can also artificially decrease fresh stream conductivity. The higher the potential used, the greater the discordance we expect between the brine stream increase and fresh stream decrease relative to pre-power baseline, and runs of varying voltage potentials will produce differing degrees of discordance. Therefore, when calculating desalination percentages from in-stream conductivity (in real-time), we always use an average of the brine and fresh stream data. Here we see a 5mS/cm rise in brine stream conductivity corresponding to 10% desalination and a 10mS/cm drop in fresh stream conductivity corresponding to 20% desalination; the average of the two is therefore 15%.
Total Dissolved Solids (TDS) Measurement:
Consistent with the conductivity measurements, the TDS measurements indicate approximately 14% desalination. We measured the TDS of the brine and fresh product waters, as well as the untreated feedstock (control), from the run described above in Figure 4 with regards to the Conductivity Analysis. The feedstock, fresh product water, and brine product water samples from this run were collected. 500mL of each sample was put into a tube and baked at 80oC in a vacuum oven for 24 hours with the vacuum off until the liquid levels were down to about 100L, after which the vacuum was turned on (27 mmHg) and the temperature increased to 90oC for another 14 hours. After cooling, the mass of each tube was obtained. As shown in Table 1, residual azeotropic water was calculated using the control (feedstock) sample, final adjusted mass determined, and the % desalination was calculated (yellow boxes). Note that % desalination values obtained when omitting the azeotropic water correction were insignificantly different than those obtained when using the corrections.
Desalination percent obtained from the brine relative to control residual salt mass agreed with that obtained from the fresh relative to control – 14% and was very close to the 15% calculated from the in-line conductivity data. These TDS results are typical of those we have obtained from numerous other runs during August/September of 2015.
Conclusion:
Herein we have proven desalination using the V8.2 prototype module. The data herein demonstrate that the V8.2 prototype is capable of from 15-20% desalination at 0.5-1 L/min flow rates. Other similar data accumulated during the past 2 months demonstrates the prototype is capable of up to 20% desalination at flow rates up to 5 L/min, depending on the run conditions. This provides a 50-100 fold improvement in flow as compared to the results from the technology in the pending “Membraneless Seawater Desalination” patent application.
SBIR Phase I:
Cost Effective Seawater Desalination with ICP Element Arrays | Final ReportThe perspectives, information and conclusions conveyed in research project abstracts, progress reports, final reports, journal abstracts and journal publications convey the viewpoints of the principal investigator and may not represent the views and policies of ORD and EPA. Conclusions drawn by the principal investigators have not been reviewed by the Agency.