U.S. flag

An official website of the United States government

Here’s how you know

Dot gov

Official websites use .gov
A .gov website belongs to an official government organization in the United States.

HTTPS

Secure .gov websites use HTTPS
A lock (LockA locked padlock) or https:// means you have safely connected to the .gov website. Share sensitive information only on official, secure websites.

  • Environmental Topics
  • Laws & Regulations
  • Report a Violation
  • About EPA
Contact Us

Grantee Research Project Results

Final Report: Development of Real-Time Flare Combustion Efficiency Monitor

EPA Contract Number: EPD13024
Title: Development of Real-Time Flare Combustion Efficiency Monitor
Investigators: Zeng, Yousheng
Small Business: Providence Photonics, LLC
EPA Contact: Richards, April
Phase: I
Project Period: May 15, 2013 through November 14, 2013
Project Amount: $79,854
RFA: Small Business Innovation Research (SBIR) - Phase I (2013) RFA Text |  Recipients Lists
Research Category: Small Business Innovation Research (SBIR) , SBIR - Air and Climate

Description:

There are thousands of flares operating at petroleum refineries, chemical plants and other industrial facilities in the United States, and many more in other countries. Flares are used as a safety and emission control device to combust process vent gases that are otherwise difficult to control. Because flares operate in open air, currently there is no good method to measure or monitor the combustion efficiency (CE) or destruction and removal efficiency (DRE) of a flare. In the state of Texas alone, there were 1,130 flares in 2006 that emitted 13,078 tons per year of volatile organic compounds (VOC), a portion of which was air toxics, based on an assumed DRE of 98%1. Research has shown that the assumed 98% CE or DRE is not reliable and that actual VOC emissions could be drastically different from estimates using current estimation method.

For many years, both regulating and regulated communities have been searching for a practical method to directly measure or monitor flare CE. Currently available technologies include: 1) extractive sampling followed by conventional flue gas analyzers, and 2) Passive Fourier Transform Infrared (PFTIR). The extractive sampling method is a “point measurement” method. It is used in research only and is not practical for routine monitoring. The PFTIR technology is a path measurement method, and it has several technical shortcomings. The instrument must be aimed at a specific region of the flare plume and must assume that the optical path length during a data acquisition cycle remains constant. Flare plume dynamics and long data acquisition cycles (> 1 second per cycle) make both of these requirements unreliable. The PFTIR also has a limited dynamic range due to a one-sensor configuration and must operate at lower temperatures where atmospheric interferences can be significant. In contrast, the Flare Efficiency Monitoring System (FEMS) technology proposed and evaluated in this research is based on 2-dimensional (2-D) measurement (see Figure ES-1), and it has at least 20-30 times faster data rate than PFTIR. Therefore, it can overcome the shortcomings associated with PFTIR.
 
Figure ES 1
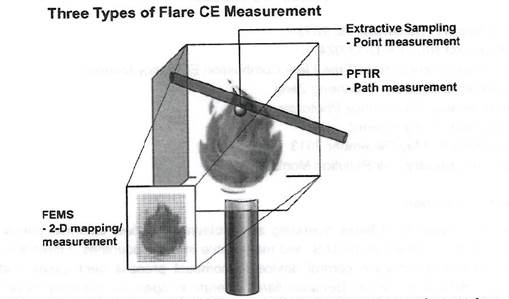
Figure ES-1. Illustration of Three Types of Flare CE Measurement Approaches. 
 
The purpose of this SBIR Phase I research is to determine the technical feasibility of an innovative technology for real-time monitoring of flare CE. At the core of this technology is a multi-spectral Infrared (IR) imager that is designed to measure relative concentrations of unburned hydrocarbons, product of combustion (i.e., carbon dioxide, or C02), and product of incomplete combustion represented by carbon monoxide (CO). A bench-scale experiment was set up to evaluate the technical feasibility of the proposed technology by comparing the CE values determined by the proposed technology to the true CE values determined by conventional analyzers. In the bench-scale test, the flare plume was captured and analyzed by conventional analyzers, allowing independent measurement of true CE values as the benchmark to validate the proposed technology.


Summary/Accomplishments (Outputs/Outcomes):

A total of 28 test runs were conducted. Thirteen test runs had matching CE measurements by conventional analyzers, suitable for the proof-of-concept test. The remaining test runs were conducted to gather data that could be used in future design of a commercial prototype to implement this technology. The results of the 13 proof-of-concept test runs showed strong correlation (r2 = 0.9852) between the CE measured by the proposed method and the true CE values. The strong correlation is demonstrated in Figure ES-2 below.
 
Figure ES2
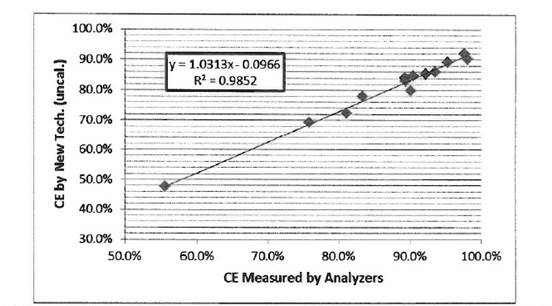
Figure ES-2. Correlation between True CE Measured by Analyzers and CE Determined by the 
New Method without Callibration. 
 
With such a strong correlation and proper calibration, the Phase I study has demonstrated the technical feasibility of this proposed technology. In addition, the proposed technology has successfully generated both CE map and temperature maps over the entire flare plume, which are useful tools for flare operators and combustion engineers. There are no current technologies that can generate the flare CE map and flame temperature maps. The data generation frequency of this technology is 20-30 Hz, meaning that 20-30 sets of flare performance data (each including a single CE value to represent overall flare performance, a CE map and a temperature map) can be generated in one second. Although the operators may not need such a high data rate, the high data rate is necessary to complete a measurement cycle during which the flare plume is relatively constant. The high frequency raw data measurements can be averaged over a specified time period, and the average CE can be reported to an operator or control device in real time.


Conclusions:

This Phase I study has validated the proposed real-time flare combustion efficiency monitoring technology. The technology is capable of directly, remotely and continuously monitoring flare CE and temperature. The bench-scale test has demonstrated both the technical feasibility and the superiority of this technology over existing flare measurement methods. The commercial product derived from this technology will be an industrial-grade monitoring device that can monitor performance of one or more flares in real-time and enable operators to adjust and optimize flare operating conditions. It also could be connected to a control system to automatically optimize flare operations.

References:


Supplemental Keywords:

air pollution, flares, flare efficiency monitoring, air toxics emissions, volatile organic compound (VOC), imager

SBIR Phase II:

Development of a Real-Time Flare Combustion Efficiency Monitor  | Final Report

Top of Page

The perspectives, information and conclusions conveyed in research project abstracts, progress reports, final reports, journal abstracts and journal publications convey the viewpoints of the principal investigator and may not represent the views and policies of ORD and EPA. Conclusions drawn by the principal investigators have not been reviewed by the Agency.

Project Research Results

  • SBIR Phase II | Final Report

Site Navigation

  • Grantee Research Project Results Home
  • Grantee Research Project Results Basic Search
  • Grantee Research Project Results Advanced Search
  • Grantee Research Project Results Fielded Search
  • Publication search
  • EPA Regional Search

Related Information

  • Search Help
  • About our data collection
  • Research Grants
  • P3: Student Design Competition
  • Research Fellowships
  • Small Business Innovation Research (SBIR)
Contact Us to ask a question, provide feedback, or report a problem.
Last updated April 28, 2023
United States Environmental Protection Agency

Discover.

  • Accessibility
  • Budget & Performance
  • Contracting
  • EPA www Web Snapshot
  • Grants
  • No FEAR Act Data
  • Plain Writing
  • Privacy
  • Privacy and Security Notice

Connect.

  • Data.gov
  • Inspector General
  • Jobs
  • Newsroom
  • Open Government
  • Regulations.gov
  • Subscribe
  • USA.gov
  • White House

Ask.

  • Contact EPA
  • EPA Disclaimers
  • Hotlines
  • FOIA Requests
  • Frequent Questions

Follow.