
Grantee Research Project Results
2019 Progress Report: Development of a larval fish neurobehavior adverse outcome pathway to predict effects of contaminants at the ecosystem level and across multiple ecologically relevant taxa
EPA Grant Number: R835798Title: Development of a larval fish neurobehavior adverse outcome pathway to predict effects of contaminants at the ecosystem level and across multiple ecologically relevant taxa
Investigators: Murphy, Cheryl A. , Garcia-Reyero, Natàlia , Carvan, Michael , Jones, Michael
Institution: Michigan State University , University of Wisconsin - Milwaukee , Mississippi State University
EPA Project Officer: Spatz, Kyle
Project Period: June 1, 2015 through May 31, 2018 (Extended to May 31, 2021)
Project Period Covered by this Report: June 1, 2019 through May 31,2020
Project Amount: $800,000
RFA: Systems-Based Research for Evaluating Ecological Impacts of Manufactured Chemicals (2014) RFA Text | Recipients Lists
Research Category: Chemical Safety for Sustainability
Objective:
The overall objective of this project is to advance the adverse outcome pathway framework to predict effects of contaminants with different modes of action on the neurobehavior of larval fish from three different species and to determine what Adverse Outcome Pathways (AOPs) are common between species
Objective 1: Identify genes predictive of neurobehavior toxicity in response to exposure to two different chemicals with different molecular initiating events and modes of action in order to identify neurobehavior AOPs using a reverse engineering approach on zebrafish
Objective 2: Determine the effects of PCB126 and MeHg on gene expression and behavior of the larval stage of two species of ecological relevance (fathead minnow and yellow perch).
Objective 3: Incorporate behavioral effects and transcriptomics data from fathead minnow and yellow perch into an individual-based model (IBM) to predict changes in growth and survival to complete the neurobehavior AOP suitable for ecological risk assessment for MeHg and PCB126.
Objective 4: Define and compare neurobehavioral AOPs between species and contaminants to determine their similarities and to elucidate what kind of information is lost or gained by using a typical laboratory model to inform on environmentally relevant species at the population level.
Progress Summary:
We have continued to make progress on the grant, after a delay in the beginning, Covid -19 delayed transcriptomic analyses, prompting a no-cost extension. However, we have completed this now, and the bulk of the remaining grant money has been spent. Our graduate student, Janice Albers, and our post-doctoral associate will complete the analyses this upcoming year and we will submit a final report with everything completed by August 2021.
Objective 1 and Objective 2.
We have completed exposures for both contaminants and videotaped behavioral assays for all four fish species: yellow perch, zebrafish, killifish and fathead minnows. The behavioral assay data has been collected and analyzed completely for yellow perch and has recently begun for zebrafish and killifish. The brains for all four species were isolated using our newly developed microdissection technique. The brains of fathead minnows were sent off for RNA extraction and the killifish samples are being prepared for RNA extraction. The RNA was extracted from the yellow perch and zebrafish and was in excellent condition, and the data has been received. Currently we are conducting transcriptomic analysis on yellow perch and zebrafish samples.
Preliminary results of yellow perch brain gene expression trends were compared with behavior trends to determine if there were similarities between these two endpoints. Preliminary results indicate total number of swimming bouts was correlated with ripor2 and eef1b gene expression in yellow perch exposed to MeHg. Total time swimming was correlated with PLK3 and TANC2 gene expression and fast to slow swim transition probability was correlated with Thoc3 gene expression in yellow perch exposed to PCB126.
The graduate student (Janice Albers) has completed the locomotion and feeding yellow perch assay analysis and has a draft manuscript summarizing the results of the locomotion assay modeling where 17 out of 72 different locomotion behavioral endpoints were found to differ between treatments (Table 1; preliminary since analysis is still in progress). All Killifish assay data collection has also been competed with modeling of the same behavior endpoints just beginning. Additionally, we continue collecting data on the zebrafish locomotion assays, with 580 of the 1800 Zebrafish tracked and finished QA/QC to follow and lastly, 217 out of 270 zebrafish feeding assay fish tracked with QA/QC to follow.
Table 1. The number of fish tested in each of the behavioral assays.
| Species | VMR fish count | Locomotion fish count | Feeding fish count |
| Zebrafish | 838 | 1800 | 270 |
| Yellow Perch | Not possible | 2440 | 351 |
| Killifish | 166 | 277 | 206 |
As an example of the type of results from the yellow perch locomotion assays, we found the complexity of the swimming patterns changed as the level of both toxicants increased (Figure. 1). These results emphasize the impacts human pollution has on fish populations, even at very low levels, levels that are common throughout most industrial landscapes.
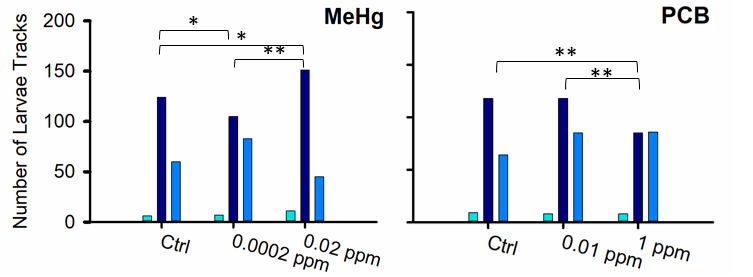
Figure 1. Number of best-fit hidden Markov models for yellow perch larvae that contained one, two, or three different behavior states. * indicates significant difference at a p-value < 0.1, ** indicates significance at a p-value < 0.05.
Table 2. Significant results of the treatment effects on yellow perch larvae behavior after exposure to sublethal levels of MeHg and PCB126. Presented for each behavior endpoint and treatment is the mean (original or back-transformed), transformed mean, P-value in parentheses, and pattern of significant trends. Trends are reversed if transformation caused a reversal in the trend means to reflect original mean trends. P-values and trends are reported in the following order: first level is the trend between control and middle treatment, second is middle verses upper treatment, and third is control vs upper treatment (neg = significant negative trend, pos = significant positive trend, “-“ = no significant trend).
| Chemical | Parameter | Control Treatment | Middle Treatment | Upper Treatment | Significant Trends |
| MeHg | Swimming Bouts (per sec) | 0.105374 63.71 (0.0020) | 0.174398 48.51 (0.0174) | 0.118846 60.33 (0.4148) | pos neg - |
| Swimming Bout Speed (mm/s) | 5.588129 38.96 (0.0198) | 3.773514 45.77 (0.1538) | 4.770151 41.63 (0.2258) | neg - - | |
| Swimming Bout Turning Angle | 1.013024 169 (0.0780) | 1.27925 185.5 (0.0061) | 0.849571 158.6 (0.1626) | - neg - | |
| Total Time Swimming (sec) | 61.14 (0.0002) | 139.6 (0.0016) | 101 (0.0388) | pos neg pos | |
| Overall Turning Angle Variation | 1.292833 25.54 (0.2368) | 1.477003 27.87 (0.0280) | 1.117157 23.34 (0.1811) | - neg - | |
| HMM Model Parameters Slow State Step Length Variation | 0.083661 76.71 (0.1406) | .060183 82.46 (0.0039) | 0.111645 70.52 (0.0708) | - pos - | |
| Medium State Step Length (mm) | 0.206492 5.184 (0.6356) | 0.219083 4.999 (0.0348) | 0.162709 5.9 (0.0660) | - neg - | |
| Step Length Variation | 0.172207 5.555 (0.9968) | 0.172036 5.558 (0.0388) | 0.126532 6.435 (0.0192) | - neg neg | |
| Count | 1276.041 253.4 (0.5314) | 1527.919 259.4 (0.2984) | 2038.438 269.3 (0.0068) | - - pos | |
| Fast State Step Length (mm) | 0.63396 4.34 (0.8378) | 0.577572 4.607 (0.7254) | 0.493242 5.058 (0.0266) | - - neg | |
| Turning Angle | -0.172 (0.6788) | 0.07468 (0.890) | 0.1528 (0.0286) | - - pos | |
| State Transition Probabilities Medium -> Slow | 0.033724 59.31 (0.0414) | 0.045552 49.58 (0.0074) | 0.029666 63.1 (0.3476) | pos neg - | |
| Slow -> Medium | 0.009948 71.07 (0.0351) | 0.014619 60.61 (0.2664) | 0.011895 66.5 (0.3916) | pos - - | |
| Total Time Swimming (sec)
| 68.23 (0.3182) | 87 (0.0278) | 50.02 (0.2894) | - neg - | |
| HMM Model Parameters Slow State Step Length Variation
| 0.078524 82.78 (0.1118) | 0.112929 76.53 (0.0336) | 0.063871 85.66 (0.5016) | - neg - | |
| Fast State Count | 1739.653 330 (0.8432) | 1655.692 327.4 (0.0198) | 805.8319 291.8 (0.0077) | - neg neg | |
| State Transition Probabilities Fast -> Slow | 0.015665 58.04 (0.0242) | 0.008566 74.19 (0.0412) | 0.015337 58.7 (0.9214) | neg pos - |
Objective 3
The yellow perch IBM is almost complete. All of the behavioral endpoints of interest, derived from the behavioral assays, have now been implemented in the model as multipliers. These include swimming speed, capture success, reactive distance and handling time. To develop these multipliers, code was developed in R. This code can be used to develop multipliers for the remaining species as well. Inserting these multipliers did result in the need for recalibration of the model to baseline runs. We then ran multiple simulations and have been removing some minor bugs to the model based on these results. We hope to complete all yellow perch runs, including the sensitivity analysis, and submit our paper in the next 2 months. Afterwards, we will finalize the calibration of the model for killifish and fathead minnows so that their simulations can be completed following the completion of the behavioral assays.
We have a Co-operative agreement with Dr. Diane Nacci’s group at the EPA in Narragansett RI. They have completed parallel experiments in killifish. We have analyzed the behavior and sequenced the brains of these killifish. We have been collaborating with Dr. Roger Nisbet and his co-investigators of an EPA STAR grant funded under the same RFP as this grant, through a National Institute of Mathematical and Biological Synthesis (NIMBioS) working group to bridge our adverse outcome pathway work to dynamic energy budgets. This has potential to be quite transformative because it will mean we can screen thousands of chemical to predict impacts on thousands of species.
Future Activities:
We will complete the data collection from the fathead minnow, zebrafish, and killifish behavior assays, analyze the transcriptomic data from all species, and finish analyzing the behavior data. We will complete a neurobehavior AOP.
Journal Articles:
No journal articles submitted with this report: View all 23 publications for this projectSupplemental Keywords:
transcriptomics, larval fish, fathead minnow, yellow perch, zebrafish, neurobehavior, MeHg, PCBs, Adverse outcome pathways, individual-based models, ecological risk assessment, uncertainty, riskProgress and Final Reports:
Original AbstractThe perspectives, information and conclusions conveyed in research project abstracts, progress reports, final reports, journal abstracts and journal publications convey the viewpoints of the principal investigator and may not represent the views and policies of ORD and EPA. Conclusions drawn by the principal investigators have not been reviewed by the Agency.