
Grantee Research Project Results
Final Report: Developing Alternative Power to Drive a Partitioned Aquaculture System for Intensive Food Fish Production
EPA Grant Number: SU834755Title: Developing Alternative Power to Drive a Partitioned Aquaculture System for Intensive Food Fish Production
Investigators: Leavitt, Dale F. , Riley, Linda A. , Thomas, Charles R. , Boisclair, Joshua , Pica, Jessica , Roy, Adam , Schork, George , Thomas, Sarah , McAskill, Mata , Reynolds, Thomas , Hild, Tyler , Elefante, Daniel , Futoma, Elizabeth , Pettit, Rebecca , Grodeska, Stephanie , Sylvester, Brianna , Farrington, Christopher , Garlasco, John , Szczepanek, Nathan , Richard, Andrew
Institution: Roger Williams University
EPA Project Officer: Page, Angela
Phase: II
Project Period: July 7, 2010 through December 31, 2012
Project Amount: $74,786
RFA: P3 Awards: A National Student Design Competition for Sustainability Focusing on People, Prosperity and the Planet - Phase 2 (2010) Recipients Lists
Research Category: Pollution Prevention/Sustainable Development , P3 Challenge Area - Sustainable and Healthy Communities , P3 Awards , Sustainable and Healthy Communities
Objective:
The program proposed was focused on developing a collaboration of undergraduate students, primarily from the Roger Williams University School of Engineering, Computing, and Construction Management and from the RWU Feinstein College of Arts and Sciences Marine Biology/Biology Department, to participate in the implementation of a proof of concept of an intensive aquaculture production method that can be driven by low-impact renewable energy sources (i.e. photovoltaic power – PV). By combining a new intensive fish farming technology with non-carbon consuming power sources, the result (the sPAS) will be a viable food production system that can be applied throughout the world, requiring a minimum of technical infrastructure while providing a substantial harvest of fish for local consumption and/or for processing for broader markets and economic return.
The Phase I component to the RWU EPA-P3 grant focused on designing an energy efficient intensive fish rearing facility adapted from conventional pond culture technologies. Upon the completion of Phase I, we undertook the proof of concept implementation of the Phase I design. The first objective was for the PV-powered sPAS system to be constructed as designed in partnership with a local cranberry farm (DoubleM Cranberry Co., Rochester, MA). Our purpose was two-fold; in that, by constructing the proof of concept model at a local farm, it will provide a mechanism for us to evaluate the system in terms of application for remote installations while providing a local demonstration of opportunities for crop diversification in regional farms. Both outcomes, new sustainable technology for food production and crop diversification using low impact technology in US farms, are completely in line with the positive impacts required of the P3 Program.
The second objective of the Phase II undertaking, once constructed, was to evaluate the performance of the sPAS to produce market size fish in an independent and economical manner. To gauge the success of this project, we evaluated the sPAS capacity to grow fish to market size in a timely and effective manner. Timely entails maximizing the growth rate of the fish, relative to published performance measures of other systems to grow a similar species of fish. Effective describes the ability of the system to sustain good growth with negligible mortality in the system while minimizing the ecological footprint of the operation, both locally and globally. To meet the second objective, we operated the sPAS through a production cycle while monitoring key environmental, biological and economic parameters to evaluate the operations of the novel system.These data were used to gauge the overall success for producing fish while allowing us to fine tune the system prior to further evaluation in a more challenging environment, i.e. installation in a less advantaged location.
Summary/Accomplishments (Outputs/Outcomes):
Objective 1: Construct a pilot scale sPAS for evaluation.
The original proposed design for the sPAS, as developed in Phase I, is included in the schematic and the specifications, represented in Figure 1 and Table 1.
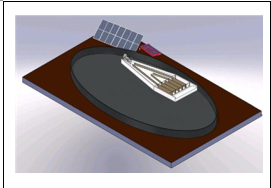 Figure 1. A schematic of the design proposed as the pilot scale sPAS to be constructed during Phase II |
|
| Eqipment Needed | Characteristics | Number of units |
|---|---|---|
| Excavated pond | app 133 x 75 ft with depth from 18 - 42 inches | 1 app. 0.21 Acres |
| Pond Liner | 20 mL black polyolefin plastic, app 144 x 92 ft | 13,248 sq. ft |
| Photovoltaic Panels | 210 W - Vmax 26.6 V (Kyocera KD210GX-LP) | 18 |
| Charge Controller (s) | Midnight Solar Classic 200 | 2 |
| Battery | 12 V Lead acid deep cycle (8DDC) | 18 |
| Power Inverter | 24VDC to 115VAC 300 Watt | 1 |
| Air Blower | Medo Linear Piston Air Pump (SL22) | 2 |
| Airlift Pump | Custom fabricated 2 inch diameter | 12 |
| Fish holding area | Custom fabricated from wood panels @ 6'W x 8'L x 4' D | 15 pens app. 67 m2 |
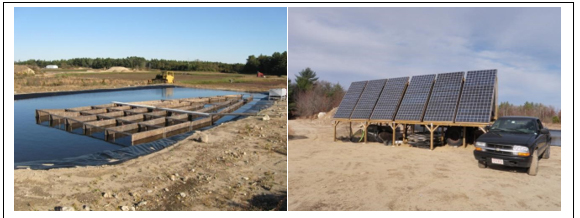
The final sPAS installation (Figure 2) consisted of the materials specified in Table 2. As the sPAS design was being finalized, a few of the design elements and components were adjusted to allow the sPAS to fit the location where the system was being installed. We also changed the specifications on the photovoltaic panels to take advantage of a better price on the units.
Numerous obstacles were overcome during the installation of the sPAS, mostly associated with powering the system. The original airlift pump system was ordered but the manufacturer went out of business and never delivered the equipment, thereby delaying the completion of the system until 2012. An alternative airlift system was ordered from a second manufacturer however the air volume and pressure demand exceeded the capacity of the remote-drive air blower, resulting in catastrophic failure of the blower. A third airlift system was designed by the Principal Investigator and custom fabricated using an array of twelve 2-inch PVC pipe airlifts, each capable of moving approximately 70 gpm at 3.2 ft3/min airflow pushed to a water depth of 36 inches. The air flow was provided by redundant 120VAC linear air pumps operating through the application of a 24VDC to 120VAC power inverter. The overall power consumption for the final system design was approximately 48 watts/hr.
Figure 2. A photograph of the sPAS as installed at the cranberry farm in Massachusetts: left photo is
the constructed pond with liner and fish pens installed, right photo is the photovoltaic panel array
adjascent to the pond.
Excavation began in the beginning of May 2011, the liner was installed in July 2011, and water was introduced into the constructed system in early August 2011. The first fish slowly were introduced into the sPAS fish pens on 1 September 2011 and additional fish were transferred in through the fall. The photovoltaic system installation was not completed until June 2012 and the airlift pump system problems were not reconciled finally until mid-summer of 2012. A full complement of fish was introduced into the pens in June 2012 and their performance was monitored throughout the remainder of the research interval (See Objective 2 below).
As a component to Objective 2, an economic analysis of the sPAS was proposed. The capital costs for the final sPAS installation are included in Tables 3 & 4 and are based on a detailed breakdown of the materials utilized and activities performed to complete the construct of the fish farm in its final design configuration. The total time required for the construction and installation of the sPAS was estimated at 392 person-hours, not including the excavation of the pond, which was contracted out and is listed as a capital cost. The capital costs for the final sPAS installation were on the order of $24,188.
| Estimated Labor | hours/ind | # ind | hours |
|---|---|---|---|
| Assembly pen assembly assembly baffle assembly airlift assembly |
30 |
4 |
120 |
| Installation |
| 6 4 4 3 2 | 24 64 32 48 48 |
| Total Hours: | 392 | ||
Table 3: An estimate of labor required for the construction of the sPAS fish farm.
| Table 4: Itemized list of materials and activities associated with the final installation of the sPAS and their associated costs, based when possible on prices collected during early 2014.
| |||||||||||||||||||||||||||||||||||||||||||||||||||||||||||||||||||||||||||||||||||||||||||||||||||||||||||||||||||||||||||||||||||||||||||||||||||||||||||||||||||||||||||||||||||||||||||||||||||||||
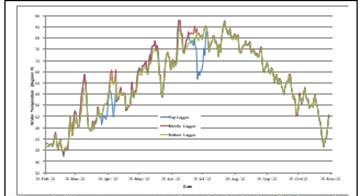
Figure 3. Water temperature at three depths in the sPAS over
the LMB growing season.
Objective 2: Evaluate the pilot scale sPAS in terms of its capacity to grow fish in an economical and efficient manner.
LMB are ectothermic animals where their metabolism, and therefore production (i.e. growth), is temperature dependent. As is true of most ectothermic animals, there is a range of temperatures where the productivity is optimal; whereas, as you vary away from that optimal range (above or below), the productivity decreases. By placing
Onset Computer Hobo® Temperature and Light Sensors at three depths in the deeper fish pen area (surface, mid-water and bottom in 40 inches of water), we were able to track the temperature (Figure 3) and light penetration (Figure 4) throughout the full depth of the pond.
Upon careful examination of Figure 3, under normal operating conditions (from mid-July through to November), the water temperature is homogeneous throughout the depth of the pond. As we were reworking the water circulating and aeration system, there were time intervals when the water flow was intermittent and/or stopped to allow for alterations. During those quiescent intervals (particularly in mid-April and mid-July), the water column in the sPAS appeared to rapidly stratify with the temperature between depth levels being more variable and often relatively different from each other.
As a general rule of thumb, largemouth bass should not be fed an artificial diet more than once a week (for maintenance) when the water temperature drops below 10oC (Brandt & Flicklinger 1987). The optimal temperature for feeding, metabolism, and growth in largemouth bass is 15 to 30oC (Coutant and DeAngelis 1983). In considering the seasonal variation in water temperature (Figure 4, red line - fitted by eye) in the sPAS, it is evident that feeding needs to be
Figure 4. Average daily water temperature in the sPAS fitted with a 7-day moving average (black line) and
an approximation of the seasonal variability (red line, fitted by eye).
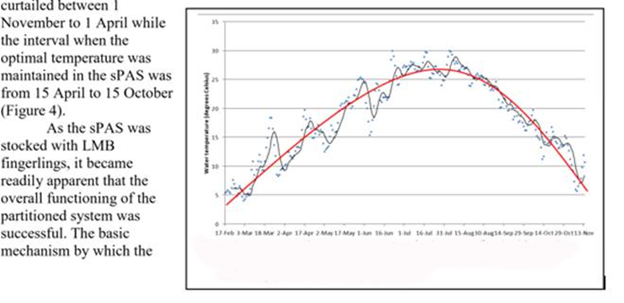
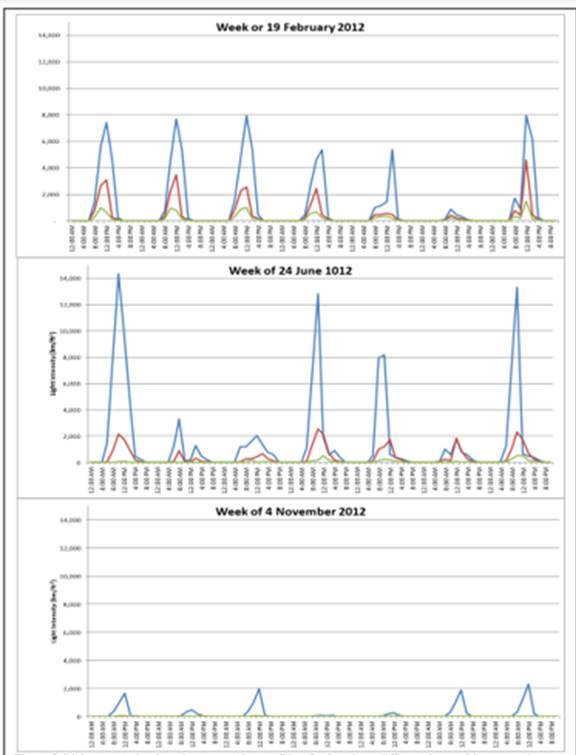
partitioned system works is to enhance primary productivity in the PAS through design elements of the system that incorporates a shallow pond area to stimulate phytoplankton population growth As the primary productivity increases, the light penetration in the pond will be curtailed due to the high concentration of suspended phytoplankton particles in the water. Using the Onset Computer Hobo® Light Logger, we tracked light penetration into the fish pen area of the sPAS (Figure 5). Six-inch largemouth bass (500) were introduced into the sPAS in November 2011 and by February 2012, the phytoplankton levels in the pond were sufficiently high to reduce the light intensity at mid-water by 2/3's and to effectively extinguish light intensity at the bottom of the fish pens (Figure 5). Throughout the entire year, the productivity remained high enough to sustain the light reduction between surface and bottom, suggesting that the overall design of the sPAS was carrying out its function of promoting phytoplankton growth to reduce nitrogen levels in the system and subsequently to reduce the toxicity of the fish waste products.
The exceedingly high level of phytoplankton in the water also resulted in high levels of dissolved oxygen in the system during daylight hours. We measured dissolved oxygen concentration with a YSI DO Meter (Model 550) intermittently throughout the growing season and the level of oxygen was never below 110% saturation during the day every time it was measured, regardless of the number of fish in the system. The caveat to this observation is that the dissolved oxygen measurements were made during the daylight hours, when photosynthesis by the phytoplankton is generating oxygen as a waste product. Unfortunately, we did not have an opportunity to monitor the dissolved oxygen on a 24-hour basis to see what the levels were during the hours of darkness, a time when dissolved oxygen in ponds is routinely found to be limiting for biological activity. Future work will involve deploying a dissolved oxygen logger that will continuously record the level.
The overall strategy for producing largemouth bass (LMB) consisted of a two stage production cycle (Table 5) where the fingerlings were acquired from a commercial hatchery in September, held through the first winter in
a small-scale indoor recirculating Table market size largemouth bass in the 5: Proposed production timeline fosPASr growing . aquaculture system (RAS) (Stage 1) before
being transferred to the sPAS the Production Stage Approximate Time following May (Stage 2). Stage 1a. Acquire 2" fingerlings early September
During Stage 1, LMB fingerlings b. Grow from 2" to 6" were purchased (approximately 2,000 per in the RAS September to April year for three years, 2010-2012) at a length Stage 2
of ~2 inches (50 mm) from a commercial a. Transfer to sPAS April/May
hatchery (Delmarva Aquatics, Smyrna, b. Grow from 6" to 14"in sPAS May to October DE) and stocked into a 700 gallon RAS Market fish October/November housed either at Roger Williams
University (Bristol, RI) or at the Bristol County Agricultural High School (Dighton, MA). They were fed an appropriately sized pellet of Aquamax® carnivorous fish diet at 3% of body weight and length/weight data were taken at regular intervals during Stage 1.
Figure 5. Light penetration into the wter column of the sPAS at three different times of the year, where
the blue line represents the light intensity at the surface, the red line at mid-water and the green line
at the bottom of the fish pen area.
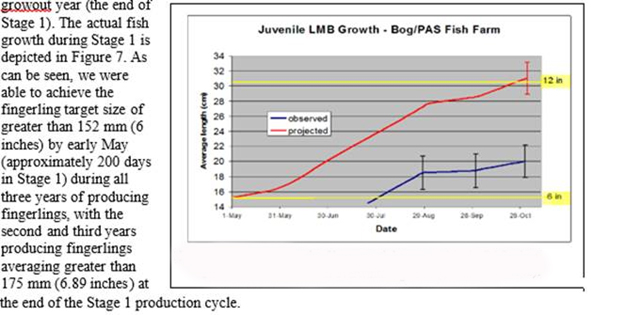
The target fish size produced during Stage 1 was ~6 inches (152 mm), where the preliminary growth model (Figure 6) suggested that we could produce market size LMB in the fall of the growout year, if we could stock the sPAS with fish at 6 inches in the spring of the
Fighre 6. Projected growth of largemouth bass reared in the PAS when stocked with 6" fish from overwintering
RAS (Leavitt, et al. 2002)
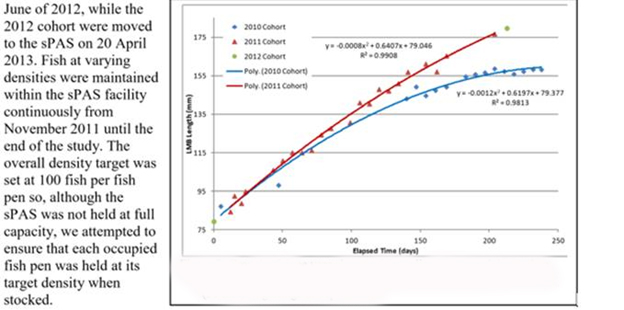
Due to the overall sPAS construction timeline, the transfer of a full complement of bass fingerlings between the RAS and the sPAS did not occur as originally proposed until the spring of 2013. The 2010 cohort were moved to the sPAS in November 2011 and the 2011 cohort were moved to the sPAS in
Figure 7. Growth of three year classes of fingerling largemouth bass when housed in a recirculating
aquacultere system after stocking with 2 inch (51 cm) fingerlings in September.
Because of the husbandry practices required to grow largemouth bass, i.e. the need to closely size-grade the fish to reduce the occurrence of cannibalism, it was difficult to monitor the performance of an individual cohort of fish from the time of installation in the sPAS until harvest for market. As the fish were size graded, different cohorts were mixed and moved from pen to pen according to their size, making it impossible to track a single grouping of fingerlings. However, the entire farm performance was carefully monitored for an approximately two-month interval during the height of the growing season in 2012 and these data are used to gauge the overall performance of the system. The analysis of LMB performance in the sPAS is summarized in Table 6. Using these data, we are able to project the overall performance of the sPAS system for growing largemouth bass, allowing us to make a judgment as to the overall efficacy of the system to grow fish.
| Table 6: A summary of the performance of a cohort of largemouth bass cultured in the sPAS during the interval of 9 August to 23 September 2012.
stdev 0.92% 0.22 57.9 54.2 0.591 0.414 26.2% | |||||||||||||||||||||||||||||||||||||||||||||||||||||||||||||||||||||||||||||||||||||||||||||||||||||||||||||||||||||||||||||||||||||||||||||||||||||||||||||||||||||||||||||||||||||||||||||||||||||||||||||||||||||||||||||||||||||||||||||||||||||||||||||||
Although we had trouble with LMB survival in the indoor RAS, due to cannibalism and a bacterial skin disease ("Columnaris"); once the LMB juveniles were moved into the sPAS, the mortality rate dropped to a very negligible amount (average was 0.52% (+ 0.92% SD) over the 45 day interval). Reduced mortality was observed throughout the three-year interval where LMBs were held in the sPAS, although the primary effort to quantify the actual rate was during the current two month interval.
LMB are ectothermic animals where their production (i.e. growth) is temperature dependent. As is true of most ectothermic animals, there is a range of temperatures where the productivity is optimal; whereas, as you vary away from that optimal range (above or below), the productivity decreases. Largemouth bass growth occurs between 15 to 36oC (Coutant and DeAngelis 1983), which was maintained in the sPAS from mid-April to mid-October (Figure 4). The interval defined by the data represented in Table 4 represents a time span when LMB productivity in the sPAS is optimal. As such, the average daily gain (ADG) in size for LMB in the sPAS was 0.47 mm/day (+ 0.22 SD) and for weight was 0.94 g/day (+0.59 SD) while the specific growth rate (SGR - in % body weight per day) was 0.56 (+0.41 SD). Over the 45-day time span, the biomass gain for a pen of LMB averaged 30.1% (+ 26.2%). As we monitored the weight gain, we roughly weighed the amount of feed offered to the entire pond of fish. Using these numbers, we calculated a feed conversion ratio of 2.52 lbs of feed to generate 1 lb of fish weight, although this should be considered a very rough estimate as there was a small volume of food that flushed out of the pens with each feeding episode.
The growth observed in the current study exceeded the growth reported for largemouth bass in other culture systems. For example, Zhou et al. (2012) reported an ADG of 0.735 g/day compared to our 0.935 g/day while Portz et al. (2001) observed an ADG of 0.100 g/day. However, our feed conversion ratio (2.52) was higher than that reported in other LMB systems, where Zhou et al. (2012) measured an FCR of 0.84, Tidwell et al. (2007) at 1.55 and Portz et al. (2001) at 1.16. Again, the FCR in this study may have erred on the high side due to the uneaten feed pellets that drifted out of the pen system during feeding.
For application in the economic analysis (to be discussed in Section 4), feed costs were calculated based on the standing biomass in the sPAS and adjusted as the LMB grew in size, starting at 3% of body weight per day when at 2" fingerlings and decreasing to 2% of body weight when approaching market size. During the data collection period, feed offered was recorded and a rough estimate of average consumption of feed per fish per day was calculated. The average feed consumption for the mixed population of LMB in the sPAS was 2.84 g feed per fish per day with a maximum intake during the heaviest feeding days of 5.20 g feed per fish per day.
Conclusions:
The growth performance of largemouth bass reared in the sPAS, in the presence of ample food, is dominated by the water temperature. A summary of the role that temperature plays in the husbandry of the LMBs in the sPAS is depicted in Figure 8. Outside of the vertical blue lines (1 November through 20 March), growth is negligible and feeding is reduced to 1% of BW one time per week.
Figure 8. Water temperature of the sPAS over the growing season (from Figure 3) superimposed with
critical time points associated with largemouth bass husbandry. Blue vertical lines indicate the time point
where feeding is reduced to once per week at 1% of BW (1 November thorugh 20 March), red vertical lines
indicate the time point where feeding can be increased to daily at full ration (15 April through 15 October),
the purple polygons represent the interval when growth is less than optimal due to water temperature, the
yellow polygons represent when growth is optimal, and the red polygon represents the time interval when
the wter temperature is high enough to suppress daily feeding.
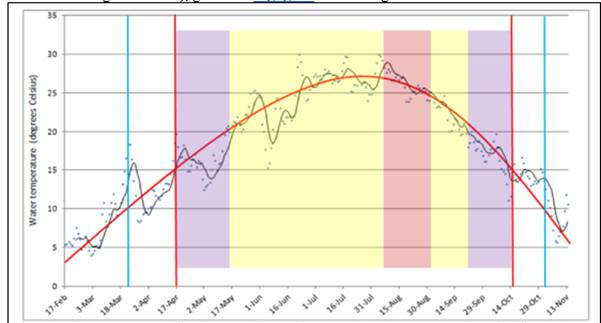
Feeding is ramped up between the blue and red vertical lines such that within the interval described by the red lines (15 April through 15 October), feed is provided at the full level (between 2 and 3% of body weight, depending on fish size). The intervals described by the purple polygons represent the time when the growth response is reduced due to cooler temperatures while the yellow polygons represent the time when LMB growth is optimal. During a short interval in August, when water temperature increases to the warmest level (the red polygon), feeding was suppressed in the bass. The annual water temperature schedule represented by Figure 8 was used as a basis to generate a largemouth bass production model for the sPAS to allow one to predict the overall performance of the sPAS and to generate an economic projection of its profitability.
Figure 9. Projected growtn model of largemouth bass produced in a combined RAS/sPAS growout system.
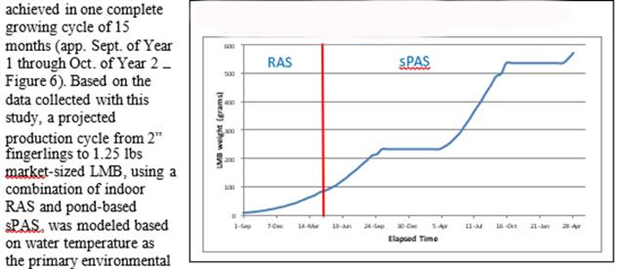
Using the data collected during this study, it is possible to project the overall fish performance in the sPAS and to predict the time to achieve a market sized LMB using the combined RAS/sPAS growout strategy. By using the growth data from the RAS system and coupling that with the estimated growth of the LMB over the entire seasonal growout cycle (by adjusting the rate of growth observed in the data reported above by the ambient temperature of the sPAS), we can estimate the time to market for LMBs (average market weight at 1.25 lbs - 568 grams) (Figure 9). As originally proposed, we estimated that market-size LMB could be factor influencing growth (Figure 8). Based on the model, LMB grown in the two stage production system (RAS and sPAS) will only achieve a size of approximately 229 g (0.50 lbs or 10 inches) during the originally proposed production cycle. To achieve the 12.5 - 13.5" (456 - 568 g or 1.0 - 1.25 lbs) LMB that is demanded by the targeted markets (pond stocking and for human consumption), an additional growing season is necessary, resulting in a two-year production cycle. This makes it necessary to hold the juvenile fish in the production system through a winter season. With the airlift pump operating through the winter, survival of overwintered fish in the sPAS (winters of 2011 and 2012) was close to 100%.
While the projected production strategy takes longer than originally anticipated, an analysis of the overall production and economics of operating the sPAS looks very favorable, due to the low cost of energy consumption by the system following initial installation. Using the projected capital costs for installation (Table 4), feasibility, sensitivity, breakeven and annual equivalence analyses, based on production estimates and market value in the northeast, was generated for two different scenarios. An initial economic analysis was projected during the Phase I reporting process and is included in Table 7.
| Table 7: Economic analysis of the proposed SPAS, based on the demonstration project installed in Rochester, MA (from the Phase I Final Report).
| |||||||||||||||||||||||||||||||||||||||||||||||||||||||
Because feed cost is the primary expense in annual operations of the sPAS, the updated economic analysis was based on two different feeding scenarios. The first was based on feeding the LMBs at a scale equivalent to their body weight, as is conventionally recommended (Brandt & Ficklinger 1987). The economics for this projected production strategy are included in Table
8. Under this feeding scenario, the scale demonstration system has the potential of generating an annual profit of $3,070 each year ($15,348 per acre per year) over a 20 year project life. The net present value of this system is $1,944. This has been calculated by making several assumptions in the economic analysis, outlined in Table 8. The demonstration scale system breaks even in 7-8 years and generates revenue in year two and every year thereafter.
| Table 8: Economic analysis of the proposed SPAS, based on the demonstration project installed in Rochester, MA where the bass are fed at a percent of their body weight and reared to a market size of 13.5" or 1 lb.
| |||||||||||||||||||||||||||||||||||||||||||||||||||||||
The second production scenario (Table 9) is based on a food conversion ratio of 2.3, similar to what was observed in the pilot scale facility (Table 6). In this scenario, the scale demonstration system has the potential of generating an annual profit of $6,418 each year ($32,089 per care per year) over a 20 year project life. The net present value of this system is $30,450. The demonstration scale system breaks even in 3-4 years and generates revenue in year two and every year thereafter.
| Table 9: Economic analysis of the proposed SPAS, based on the demonstration project installed in Rochester, MA where the bass are fed at a food conversion ratio of 2.3 and reared to a market size of 13.5� or 1 lb.
| |||||||||||||||||||||||||||||||||||||||||||||||||||||||
Based on the stated objectives, the completed project was a success. Objective 1 focused on the construction of a pilot-scale sPAS at a cranberry farm in southeastern Massachusetts. After a few false starts, the system was constructed and operational by mid-2012 and was completely stocked with fish during late 2012 and into 2013. Since start-up in mid-2012, the system has been running continuously with no interruption. The final cost of installation was approximately $24,000 for the 1/5 acre culture system.
Objective 2 proposed to conduct a production performance assessment by rearing a crop of largemouth bass from 2" juvenile to 13.5" market-sized fish. To that end, an in-depth evaluation of the fully stocked sPAS was undertaken for 45 days, leading to the measurement of survival, growth and food consumption of a mixed cohort of largemouth bass. Data collected from this trial permitted the compilation of a production model for the sPAS to allow for an analysis of production potential and costs. Using the production model, an economic analysis of the overall profitability of the sPAS was generated.
It should be noted that in 2013, the farm experienced a catastrophic (90%) loss of fish during a time interval shortly after stocking with the 2013 cohort. Due to travel commitments, the PIs were not able to be on site during the mortality event so water quality was not tested. However, given the time of day and the conditions under which the mortality event occurred, it was deduced that the mortality event was due to a short duration hypoxia event resulting from over stocking the system. Based on this knowledge, the production potential of the one-fifth acre pilot-scale sPAS was estimated at a more reasonable level of approximately 1,250 lbs of fish per year with a total stocking density of 2,000 fish split evenly between Year 1 and Year 2 stocks.
On the whole, the sPAS proved to be an effective system for growing largemouth bass in the northeast. Although the system performance timeline was longer than initially speculated, the overall efficacy was demonstrated and a more realistic projection of bass production was generated as a result of the current work. In addition to the capacity to produce edible fish, the sPAS proved to an economically viable means to grow fish. With a net present value over 20 years of $30,450 and an annual profit of $32,089 per acre, there is significant potential for northeast farmers to increase their crop diversity and earn additional funds.
There are two primary reasons for this project's success within the framework of the P-3 Program. First, people benefit from the newly designed sPAS by having a source of protein to eat or generating a profit from selling the fish. The system is relatively inexpensive and fairly easy to construct. The applications for the sPAS are numerous and the system is scalable with slight modifications. For example, if the sPAS were exported to developing countries, only basic components would be needed. Power requirements would be significantly less to make the system functional and therefore the number of solar panels, and thus cost, could be reduced. The second reason for the system's success is that the system does not require grid electricity. Since this system is powered by a renewable energy source, it also does not produce carbon emissions. These systems can be placed anywhere in the world where there is sufficient sun.
The sPAS is a revolutionary design for the aquaculture farming community. With the cost of renewable energy sources decreasing daily and efficiency increasing, the system will become only more viable and profitable in the future. The sPAS has the potential to launch a new wave of sustainable design in the aquaculture industry.
References:
- Brandt, T.M. and S.A. Flickinger. 1987. Feeding largemouth bass during cool and cold weather. The Progressive Fish-Culturist49:286-290.
- Coutant C.C. and D.L. DeAngelis. 1983. Comparative temperature-dependent growth rates of largemouth and smallmouth bass fry. Trans. Am. Fish. Soc. 112:416-423.
- Leavitt, D., B. Morse, S. Soares, and K. Wilda. 2003. There is something fishy about that cranberry bog. J. Shellf. Res. 22(1):295.
- Leavitt, D., B. Morse and S.Soares. 2002. Final Report: Cranberry Bog Fish Culture (RFR: AGRAQUA401). Mass. Department of Agriculture Resources. Boston, MA. 10 pgs.
- Portz, L., J.E.P. Cyrino, and R.C. Martino. 2001. Growth and body composition of juvenile largemouth bass Micropterus salmoides in response to dietary protein and energy levels. Aquac. Nutr. 7:247-254.
- Tidwell, J.H., S. Coyle & L.A. Bright. 2007. Effects of different types of dietary lipids on growth and fatty acid composition of largemouth bass. N. Am. J. Aquac. 69(3):257-264.
- Zhou, H., N. Chen, M. Zhao and L. Jin. 2012. Arginine requirement and effect of arginine intake on immunity in largemouth bass, Micropterus salmoides. Aquac. Nutr. 18:107-116.
Supplemental Keywords:
Animal Feeding Operation, Renewable Energy, Solar Energy, Intensive Fish FarmingProgress and Final Reports:
Original AbstractP3 Phase I:
Developing Alternative Power to Drive a Partitioned Aquaculture System for Intensive Food Fish Production | Final ReportThe perspectives, information and conclusions conveyed in research project abstracts, progress reports, final reports, journal abstracts and journal publications convey the viewpoints of the principal investigator and may not represent the views and policies of ORD and EPA. Conclusions drawn by the principal investigators have not been reviewed by the Agency.