
New Additions!
In addition to chemical data updates, ECOTOX has added new features based on user feedback:
- NEW option in Explore to export Plot View data file and information to use R (https://www.r-project.org/) to create customizable, high-quality figures comparable to display on Plot View tab. This option is designed for users with basic knowledge of R with R installed. The R script can be customized by the user (i.e., change plot layout/colors).
- In Explore, select module of interest (Chemicals, Species, Effects, or Publications) and then select group(s) or Create Custom Group(s). Click 'Explore Data'.
- Within Explore Module, apply Query Filters of interest (in left hand panel).
- Navigate to the Plot View (3rd tab on the top).
- The default plot type is 'Custom', where this new option allows the user to export the data and R script to re-create the plots viewed on Explore.
- Within plot type Custom click 'Change Plot Parameters' to select different options for x-axis, y-axis, and legend category (if desired).
- Click green 'Export' button and select 'Data to R Plot'.
- Save .zip file to preferred directory and folder. File will be date and time stamped with name 'ecotox_R_YYYY-MM-DD-HHMMSS.zip' and include comma delimited data file (ecotox_explore_data_YYYY-MM-DD-HHMMSS.csv) and text file with R script (ecotox_explore_data_ YYYY-MM-DD-HHMMSS.r).
- Unzip files to a common folder. Open and run R script (file ending in ".r") in R or RStudio.
- R script will install required packages (if needed), import data file, and create color and greyscale figures (exported as .jpeg files) with selections from Explore for x-axis, y-axis, and legend category. Note that text labels will be suppressed when there are more than 50 categories for the x-axis or legend category.
As with the Plot View in Explore, records are plotted if they can be converted to Standardized Concentration Units (unit ratio equivalent to ppm) – see ECOTOX Help for information on ECOTOX unit conversion logic. Records are ordered by Concentration (low-high), with display and export limited to a maximum of 3,000 records.
- The NEW Explore Publications module continues to be improved to provide options to query by citation information (author, title, ECOREF Number, DOI) and display toxicity data by reference. This new explore module follows the general structure and options within the other Explore modules (for Chemicals, Species, and Effects), but also has some functionality that differs (such as, how the records are displayed) - these continue to be tested and may be incorporated into the Chemical, Species, and Effects Explore modules in the future. We welcome feedback and ideas! Please send comments through the Contact Us page.
Did you know? There are multiple resources on how to use ECOTOX, including:
- The new ECOTOX Knowledgebase Virtual Training recording and slide deck (presented in May 2022) that are now available on the EPA's new New Approach Methods (NAMs) Training website. This training website includes resources for multiple tools. To find the most recent ECOTOX trainings, filter the Topic and Subtopic to 'Ecotoxicology' and sort by Year.
- Looking for short videos to get started using the ECOTOX Knowledgebase? Check out the ECOTOX Tool Tips videos on Navigating the Application, Help Page, Explore Module, Data Visualization, Searching ECOTOX, and Exporting ECOTOX Data.
- Help page which includes the ECOTOX User Guide, Learning the Basics, Data Field Definitions and Terms, and the Terms Appendix with the ECOTOX-specific controlled vocabulary.
- Contact Us page where you can submit comments and questions about ECOTOX including technical questions about conducting queries and exporting data.
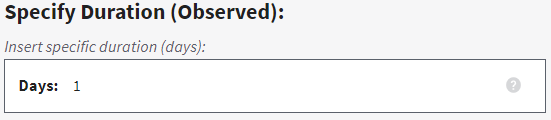
 , on the left-hand side under "Parameters".
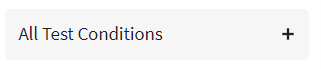
 , and then also go to the "All Endpoints",
 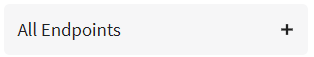 , section under "Parameters" to select "LC50"
 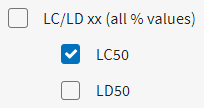 .
. , on the bottom left-hand side to apply filters and view resulting records.
 , or within a single window by clicking on the "Reset" button in top right of a window
  .
. and select from the list of available fields.